Solved Examples on Block Diagrams | Control Systems - Electrical Engineering (EE) PDF Download

Examples related to the block diagram reduction, signal flow graph, mason's gain formula, and basic concepts of the control system.
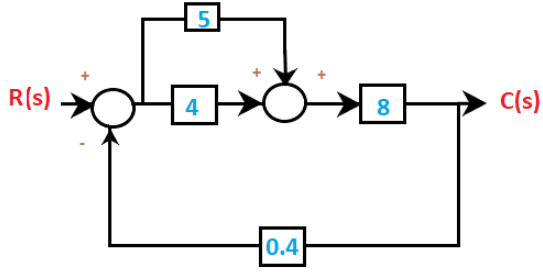
Example 1: Find the transfer function of the given block diagram.
(a) 10
(b) 7.7
(c) 4.5
(d) 2.416
Ans: d
In the given block diagram, R(s) is the input and C(s) is the output. The transfer function of the system will be the ratio of the output and the input. It is given by:
C(s)/R(s)
Let's begin with the steps to solve the transfer function of the system.
Step 1: We will first combine the two blocks in parallel using the rule that the value of the two blocks in parallel is added, forming an equivalent block. It is shown below:
4 + 5 = 9
After solving, the block diagram will now appear as:
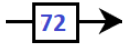
Step 2: Now, we will combine blocks in series using the rule that the value of the two blocks in cascade is multiplied forming an equivalent block. It is shown below:
9x8 = 72
The block diagram after the second step will appear as:
We are left with a close loop. The close loop transfer function is given by:
C(s)/R(s) = 72/1 + 72x 0.4 = 72/29.8 = 2.416
C(s)/R(s) = 2.416
Example 2: The transfer function of a linear system is given by:
(a) The ratio of the output Vo(t) and the input Vi(t) of the system.
(b) The ratio of the derivatives of the output dVo(t)/dt and the input dVi(t)/dt of the system.
(c) The ratio of the Laplace transforms of the output Vo(s) and the input Vi(s) of the system with all initial conditions zeroes.
(d) The ratio of the Fourier transform of the output Vo(s) and the input Vi(s) of the system.
Ans: c
For a given block diagram or characteristic equation, the transfer function of a linear system is always expressed in terms of Laplace. It is calculated as the ratio of the Laplace transform of the system's input and output.
For example,
Vo = (1 + t2) Vi
The transfer function of the above equation can be calculated by first taking the Laplace, which is given by:
Vo (s) = (1/s + 2/s3) Vi(s)
Vo (s)/ Vi(s) = (1/s + 2/s3)
Thus, the transfer function is (1/s + 2/s3). It is obtained after assuming all the initial conditions as zeroes.
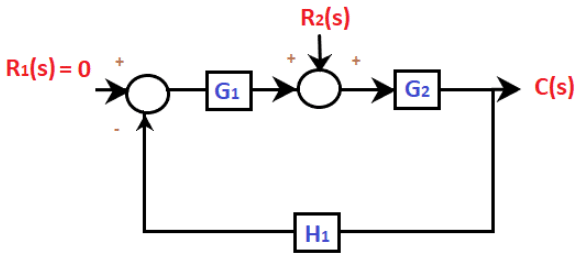
Example 3: Find the transfer function of the given block diagram.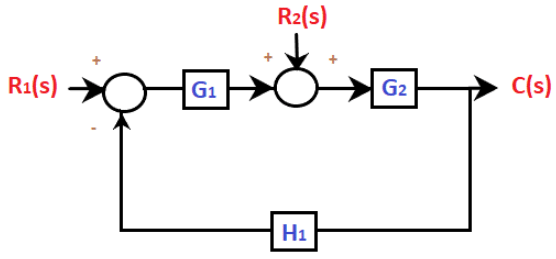 (a)
(a) 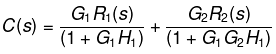
(b)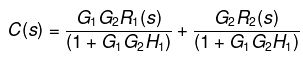
(c) 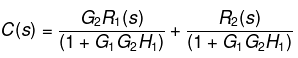
(d) 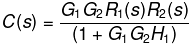
Ans: b
The above question is of system with multiple inputs. Let's consider some steps that may help to solve the problems with multiple inputs.
- Consider one input and other inputs as zero.
- Perform the above step for every input.
- Rearrange the block diagram and determine the transfer function with the single non-zero input.
- Repeat step 3 for all inputs.
- Add all transfer functions to obtain the final output.
In order to solve the above problem, follow the below steps:
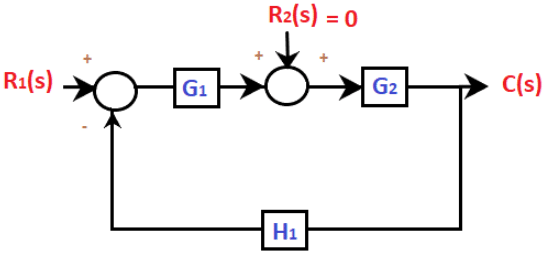
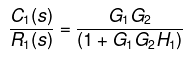
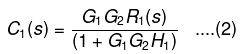
Step 1: In the given figure, there are two inputs R1 and R2. Let's first set R1 =0.
The block diagram thus arranged will appear as:The resulted block diagram will now appear as:
The transfer function will be:
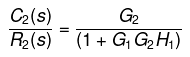
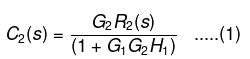
Step 2: Now assume R2 = 0
The block diagram thus arranged will appear as:
The resulted block diagram will now appear as:The transfer function will be:
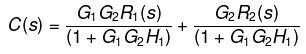
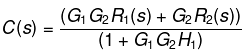
Now, adding both the equations, we will get the desired transfer function. It is given by:
C(s) = C1(s) + C2(s)
Example 4: The type of system denotes the number of:
(a) Zeroes at the origin
(b) Poles at the origin
(c) Poles at infinity
(d) Finite poles
Ans: b
The type of system usually denotes the number of poles at the origin. If there are two poles at the origin, it means that the system is of type 2. Type 1 signifies the open loop transfer function and has 1 pole at the origin. Similarly, we can say that if the system has no pole at the origin, it is categorized under Type-0 systems.
Example 5: In the given signal flow graph, y/x equals to: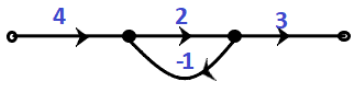 (a) 2.5
(b) 8
(c) 6
(d) 4
Ans: b
There is only one loop present in the signal flow graph. The gain of the loop is given by:
2/( 1 + 2(1)) = 2/3
All the other branches are connected in cascade or series. Hence, the equivalent result will be the product of all the values at the three nodes.
y/x = 4 x 2/3 x 3 = 8
Example 6: The purpose of the signal flow graph is to find the:
(a) transfer function of the system
(b) controllability of the system
(c) stability of the system
(d) observability of the system
Ans: a
The signal flow graph in control system is used to find the transfer function of the system, such as Mason's gain formula. It was specially designed to find the transfer function of a signal flow graph, which includes non-touching loops and forward-path gain.
Example 7:
Which of the following is true about the transfer function of a system?
(a) The transfer function is always defined in terms of the Laplace transform.
(b) The transfer function can be directly obtained from the system's time response.
(c) The transfer function represents the relationship between output and input in the time domain.
(d) The transfer function is a constant for linear time-invariant (LTI) systems.
Ans: a
The transfer function is a mathematical representation of the system in the Laplace domain and represents the relationship between the Laplace transform of the output and the input. It is derived based on the assumption of zero initial conditions and is typically used for analyzing system behavior in the s-domain. Thus, option (a) is correct.
Example 8: Find the initial value f(t) of the transfer function F(s) = 4 /s2+2s + 5, where F(s) is the Laplace transform of the function f(t).
(a) 4
(b) 4/5
(c) 0
(d) 1
Ans: c
The initial value of the transfer function is given by:So, we will put, s = infinity in the given transfer function F(s) = 4 /s2+2s + 5.
We get,
F(s) = 0
Example 9: Which of the following statement is incorrect?
(a) The transfer function is represented along the branch in the signal flow graph
(b) Reduction of a block diagram is a complex procedure
(c) The transfer function is represented along the branch in the block diagram
(d) There are no self-loops in the block diagram
Ans: c
Let's discuss each of the four statements in detail.
- Transfer function is represented along the branch in signal flow graph
The signal flow graph is in the form of branches connected with the nodes. We find the forward path and gain of the branches from one end to the other end. Hence, the first statement is correct.- Reduction of a block diagram is a complex procedure.
The reduction of the block diagram involves various steps as it is necessary to draw a block diagram at each step. The reduction needs to be followed carefully. Hence, the second statement is also correct.- The transfer function is represented along the branch in the block diagram.
The transfer function in the case of a block diagram is represented inside the block instead along the branch. Hence, the third statement is incorrect.- There are no self-loops in the block diagram.
Self-loops are present in the case of the signal flow graph. Hence, the last statement is correct.
Example 10: The characteristic equation of a control system is given by:
³²
Determine the stability of the system.
(a) The system is stable.
(b) The system is marginally stable.
(c) The system is unstable.
(d) Cannot be determined.
Ans: c
To determine the stability, we use the Routh-Hurwitz criterion. For the characteristic equation ³², we can form the Routh array.
The Routh array helps in determining how many roots of the characteristic equation lie in the right half of the s-plane (which indicates instability). If any row of the array has sign changes, the number of sign changes indicates the number of unstable poles.
By applying the Routh-Hurwitz criterion, we determine the system's stability.
|
53 videos|115 docs|40 tests
|
FAQs on Solved Examples on Block Diagrams - Control Systems - Electrical Engineering (EE)
| 1. What is a block diagram and how is it used in engineering? |  |
| 2. How do you represent feedback in a block diagram? | |
| 3. What are the advantages of using block diagrams in system analysis? | |
| 4. Can you explain the concept of transfer function in block diagrams? | |
| 5. What are common mistakes to avoid when drawing block diagrams? | |


ppt
,video lectures
,shortcuts and tricks
,Free
,study material
,Important questions
,Viva Questions
,mock tests for examination
,Solved Examples on Block Diagrams | Control Systems - Electrical Engineering (EE)
,Semester Notes
,Objective type Questions
,Solved Examples on Block Diagrams | Control Systems - Electrical Engineering (EE)
,Sample Paper
,past year papers
,Summary
,Solved Examples on Block Diagrams | Control Systems - Electrical Engineering (EE)
,MCQs
,Extra Questions
,Exam
,Previous Year Questions with Solutions
,practice quizzes
;


Solved Examples on Block Diagrams Free PDF Download
Importance of Solved Examples on Block Diagrams
Solved Examples on Block Diagrams Notes
Solved Examples on Block Diagrams Electrical Engineering (EE) Questions
Study Solved Examples on Block Diagrams on the App
|
© EduRev
|
Education Revolution
|


|


