Data Handling Class 7 Worksheet Maths Chapter 4

Q.1. State true of false.
(i) A data set may have more than one mode.
(ii) The data set 4, 8, 11, 7, 5, 0 has the mode 0.
(iii) The median can be value which is not equal to any of the observation.
(iv) It is impossible to get a sum of 14 of the numbers on both dice when a pair of dice is thrown together
(v) Mean of the observations can be lesser than each of the observations.
(vi) Mean of a data set is the value which divides the value into two equal parts.
(vii) The value of median changes if the value in a data set are arranged in ascending order instead of descending order.
(viii) Rolling the number 7 on a standard die is an impossible event.
(ix) Mean of the data is always from the given data.
(x) Mode of the data is always from the given data.
 View Answer
Ans: (i) - True
A mode is the value(s) that appear most frequently in a data set. If two or more values have the same highest frequency, then the data set can have more than one mode (this is called a bimodal or multimodal distribution).
(ii) - False
The mode is the most frequently occurring value, but in this data set, all values appear only once. Since no value appears more than once, this data set has no mode.
(iii) True.
The median is the middle value in a data set when arranged in order. If the data set has an even number of values, the median is the average of the two middle values, and this average may not be an original value in the data set.
(iv) - True
The maximum sum when rolling two standard dice (each numbered 1 to 6) is 12 (6 + 6). Therefore, a sum of 14 is impossible.
(v) - False
The mean (or average) is calculated as the sum of all the values divided by the number of values.The mean can be less than some values but not less than all values if all are positive and distinct. It will always lie between the smallest and largest values.
(vi) - False
The median is the value that divides the data into two equal parts. The mean is the average of the data values and does not necessarily divide the data into two equal parts.
(vii) - False
The median is the middle value and remains the same regardless of whether the data is arranged in ascending or descending order, as long as the order is correct.
(viii) - True
A standard die has faces numbered from 1 to 6. Therefore, rolling a 7 is impossible.
(ix) - False
The mean is the average of all the values in the data set. It may not necessarily be one of the values in the data set. For example, the mean of 1, 2, 3 is 2, which is a data value, but the mean of 1, 2, 4 is 2.33, which is not in the data set.
(x) - True
The mode is the value(s) that appears most frequently in the data set, so it must always be one of the values in the data set.
Q.2. A batsman scored the following number of runs in six innings:
36, 35, 50, 46, 60, 55
Calculate the mean runs scored by him in an inning
View Answer Ans: Mean = sum of all values / number of values
[36+35+50+46+60+55]/6
=282/6=47
Q.3. Fill in the blanks:
(i) The difference between the highest and lowest values of observations in a set of data is called the_________
(ii) The representation of numbers using bars of uniform width, the length of the bars depicting the frequency is called the_________
(iii) When the raw data is arranged in ascending or descending order, it forms an_________
(iv) The probability of getting 1 in tossing of coin is_________
(v) The outcomes which have equal chances of occurrence are called_________.
(vi) Different forms of central tendency are _________and__________
(vii) On dividing the sum of observation by total number of observations, we obtain the_________
(viii) The possible results of an experiment are called_________
(ix) The measure of chance of happening something is called_________
(x) The probability of getting a tail in a throw of a dice is_________.
View Answer Ans: (i) - Range
(ii) - Bar graph
(iii) - array
(iv) - 0
(v) - equally likely
(vi) - Mean, median and Mode
(vii) - mean
(viii) - outcomes
(ix) - probability
(x) - 0
Q.4. The mean of 5 numbers is 25. If the four numbers 16, 26, 31, 32. Find the fifth number.
View Answer Ans: Let the fifth number be "x"
Mean = sum of all values / number of values
25= [16+26+31+32+x]/5
transposing 5 to L.H.S
25*5 =105 + x
125 =105 + x
transposing 105 to L.H.S
125-105 = x
20 = x
Q.5. Find the mode of the following data:
24, 26, 23, 26, 22, 25, 26, 28
View Answer Ans: Arranging the given data with the same value together, we get
22, 23, 24, 25, 26, 26, 26, 28
Here, 26 occurs the greatest number of times i.e. 3 times
Thus, the required mode = 26.
Q.6. Find the median of the following data:
8, 6, 10, 12, 14
View Answer Ans: Let us arrange the given data in increasing order,
6, 8, 10, 12, 14
n = 5 (odd)
Median = (n + 1/2)th term = 3rd term = 10
Thus, the required median = 10.
Q.7. A fair die is rolled, find the probability of getting a prime number.
View Answer Ans: Number on a die = 1, 2, 3, 4, 5, 6
n(S) = 6
Prime numbers = 2, 3, 5
n(E) = 3
Probability = n(E) / n(S) = 3 / 6 = 1 / 2
Thus the required probability = 1 / 2.
Q.8. Find the mean of the first 5 multiples of 3.
View Answer Ans: Five multiples of 3 are 3, 6, 9, 12 and 15
Mean = 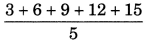
= 45 / 5
= 9
Q.9. Find the mean and median of first five prime numbers.
View Answer Ans: First five prime numbers are: 2, 3, 5, 7 and 11
Mean = 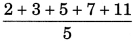
= 28 / 5
= 5.6
The median is the middle number when arranged in ascending order.
Since there are 5 numbers, the middle number is the 3rd one:
Median = 5
Q.10. A bag contains 5 white and 9 red balls. One ball is drawn at random from the bag. Find the probability of getting
(a) a white ball
(b) a red ball
View Answer Ans: Total number of balls = 5 + 9 = 14 balls
(a) Number of white ball = 5
n(E) = 5
Probability of getting white ball = n(E)/n(S) = 5 / 14
(b) Number of red balls = 9
n(E) = 9
Probability of getting white ball = n(E)/n(S) = 9 / 14
Q.11. Find the range of the following data:
21, 16, 30, 15, 16, 18, 10, 24, 26, 20
View Answer Ans: Greatest number 30
Smallest number = 10
Range = 30 – 10 = 20
Q.12. Find the average of the numbers 8, 13, 15.
View Answer Ans: Average = Sum of the numbers / Total number of terms
= 8 + 13 + 15 / 3
= 36/3
= 12
Q.13. Find the median of the following data:
20, 14, 6, 25, 18, 13, 19, 10, 9, 12
View Answer Ans: Arranging the given data in increasing order, we get
6, 9, 10, 12, 13, 14, 18, 19, 20, 25
n = 10 (even)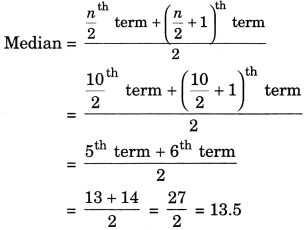
Thus, the required median = 13.5
Q.14. The following bar graph shows the number of books sold by a publisher during the five consecutive years. Read the bar graph and answer the following questions:
(i) About how many books were sold in 2008, 2009 and 2012 years?
(ii) In which years were 575 books were sold?
(iii) In which years were the minimum number of books sold?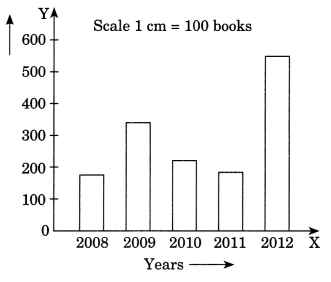
View Answer Ans:
(i) 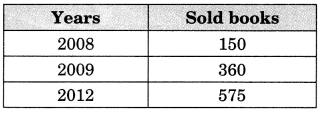
(ii) In the year of 2012, maximum number of books i.e. 575 were sold.
(iii) Minimum number of books i.e. 150 were sold in the year 2008.
Q.15. The marks obtained (out of 10) by 80 students in a class test are given below:
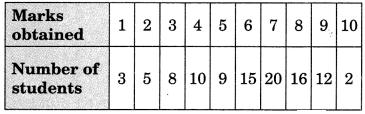 Find the mode of the above data.
View Answer Ans: In the given frequency distribution table, we find that the observation 7 has maximum frequency, i.e., 20
Hence, the required mode = 7.
|
77 videos|386 docs|39 tests
|
FAQs on Data Handling Class 7 Worksheet Maths Chapter 4
| 1. What is data handling and why is it important in statistics? |  |
| 2. What are the basic steps involved in data handling? | |
| 3. How can graphs and charts be used in data handling? | |
| 4. What tools or software can assist with data handling? | |
| 5. How can one ensure data accuracy during the handling process? | |


Free
,MCQs
,ppt
,mock tests for examination
,Previous Year Questions with Solutions
,Data Handling Class 7 Worksheet Maths Chapter 4
,Extra Questions
,video lectures
,Objective type Questions
,Sample Paper
,practice quizzes
,Summary
,study material
,shortcuts and tricks
,Important questions
,Exam
,Viva Questions
,past year papers
,Data Handling Class 7 Worksheet Maths Chapter 4
,Data Handling Class 7 Worksheet Maths Chapter 4
,Semester Notes
;


Worksheet Question & Answers : Data Handling Free PDF Download
Importance of Worksheet Question & Answers : Data Handling
Worksheet Question & Answers : Data Handling Notes
Worksheet Question & Answers : Data Handling Class 7 Questions
Study Worksheet Question & Answers : Data Handling on the App
|
© EduRev
|
Education Revolution
|


|


