Deviation of Real Gas from Ideal Gas Behaviour

Ideal and Real Gas
An ideal gas is composed of randomly moving minute particles, which undergo elastic collisions. Real gases are the ones which do not follow the ideal relations of gas law. The deviation of real gas from ideal gas behaviour occurs due to the assumption that if pressure increases the volume decreases. The volume will approach a smaller number but will not be zero because the molecules will occupy some space that cannot be compressed further.
Deviation from Ideal Behaviour
The experimental observation of gases correctly corresponds to its theoretical model. The difficulty arises when we test the extent to which the relationship, pV = nRT, the ideal gas equation, is followed to depict the actual pressure-volume-temperature relation of gases. To check on this point, let us plot pV versus V graph. At constant temperature, the pV relation will be constant. The pV versus p graph will be a straight line parallel to x-axis.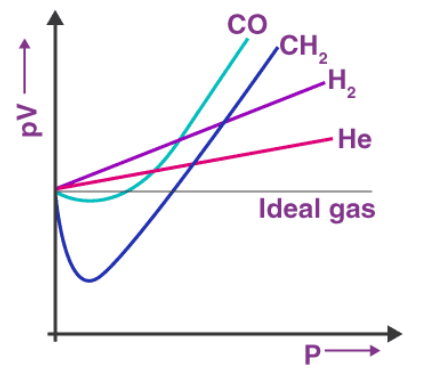 The above figure shows the graph constructed from actual data for some gases at 273 K.
Looking at the graph, it is seen that at constant temperature the pV vs p plot is not a straight line for real gases. There is a significant deviation from the ideal behaviour. In the case of hydrogen and helium, if the value of p increases then pV also increases. In other cases for example methane and carbon dioxide, initially there is a negative deviation from the ideal behaviour, the increase in pressure decreases the value of pV and reaches a minimum value. After it reaches the minimum point, pV value starts increasing and crosses the line for the ideal gas and then shows positive deviation continuously.
So it can be said that the real gases do not follow the ideal gas equation at all temperatures and pressure.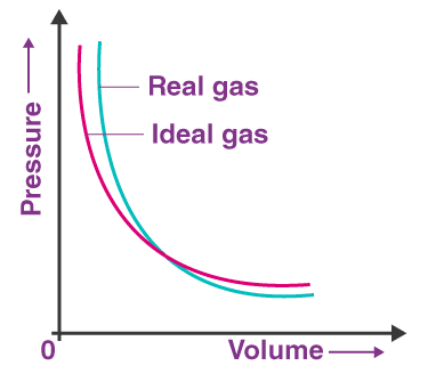 The deviation of real gas from ideal gas behaviour is also seen when the pressure versus volume graph is plotted. The graph of pressure versus volume should coincide with the experimental data that is the real gas, and the theoretical data that is calculated according to Boyle's law.
It has been observed, that at high pressure, the measured volume of the gas is more than the calculated volume. But at low pressure, the calculated and the measured volumes approach each other. So, it can be stated that the real gases do not follow Charles's law, Boyle's law, Avagadro law perfectly under all conditions of temperature and pressure.