K-Maps (Karnaugh Maps) | Digital Logic - Computer Science Engineering (CSE) PDF Download
K-Map (Karnaugh Map)
Karnaugh Map or K-map is introduced by a telecom engineer, Maurice Karnaugh at Bell labs in 1953, as a refined technique of ‘Edward Veitch’s Veitch diagram’ and it is a method to simplify or reduce the complexities of a Boolean expression.
- Karnaugh map method or K-map method is the pictorial representation of the Boolean equations and Boolean manipulations are used to reduce the complexity in solving them. These can be considered as a special or extended version of the ‘Truth table’.
- Karnaugh map can be explained as “An array containing 2k cells in a grid like format, where k is the number of variables in the Boolean expression that is to be reduced or optimized”. As it is evaluated from the truth table method, each cell in the K-map will represent a single row of the truth table and a cell is represented by a square.
- The cells in the k-map are arranged in such a way that there are conjunctions, which differs in a single variable, are assigned in adjacent rows. The K-map method supports the elimination of potential race conditions and permits the rapid identification.
- By using Karnaugh map technique, we can reduce the Boolean expression containing any number of variables, such as 2-variable Boolean expression, 3-variable Boolean expression, 4-variable Boolean expression and even 7-variable Boolean expressions, which are complex to solve by using regular Boolean theorems and laws.
Minimization with Karnaugh Maps and advantages of K-map
- K-maps are used to convert the truth table of a Boolean equation into minimized SOP form.
- Easy and simple basic rules for the simplification.
- The K-map method is faster and more efficient than other simplification techniques of Boolean algebra.
- All rows in the K-map are represented by using a square shaped cells, in which each square in that will represent a minterm.
- It is easy to convert a truth table to k-map and k-map to Sum of Products form equation.
There are 2 forms in converting a Boolean equation into K-map:
- Un-optimized form
It involves in converting the number of 1’s into equal number of product terms (min terms) in an SOP equation. - Optimized form
It involves in reducing the number of min terms in the SOP equation.
Grouping of K-map variables
- There are some rules to follow while we are grouping the variables in K-maps. They are
- The square that contains ‘1’ should be taken in simplifying, at least once.
- The square that contains ‘1’ can be considered as many times as the grouping is possible with it.
- Group shouldn’t include any zeros (0).
- A group should be the as large as possible.
- Groups can be horizontal or vertical. Grouping of variables in diagonal manner is not allowed.
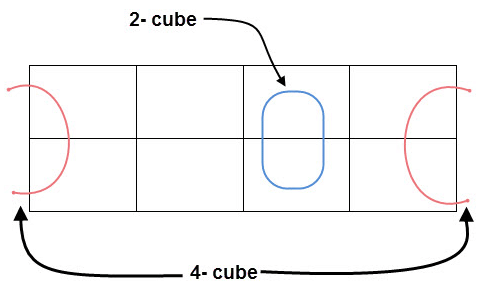
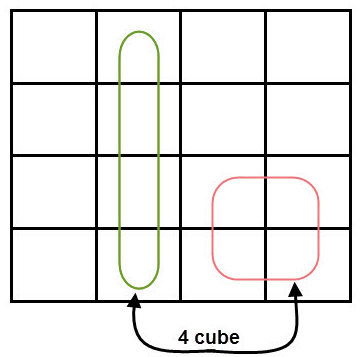
- If the square containing ‘1’ has no possibility to be placed in a group, then it should be added to the final expression.
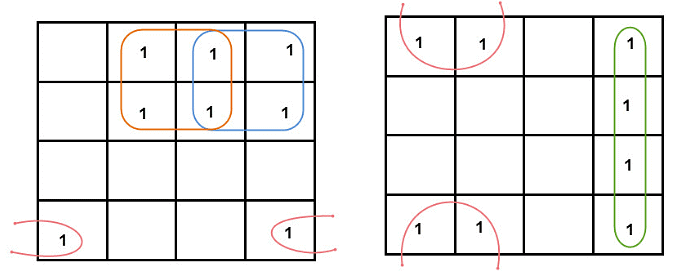
- Groups can overlap.
- The number of squares in a group must be equal to powers of 2, such as 1, 2, 4, 8 etc.
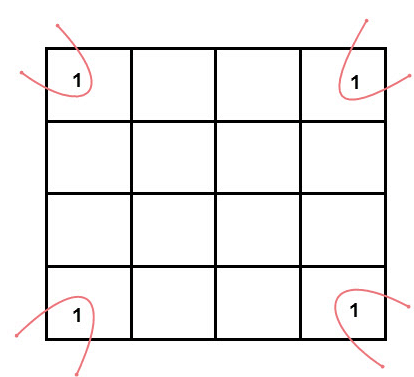
- Groups can wrap around. As the K-map is considered as spherical or folded, the squares at the corners (which are at the end of the column or row) should be considered as they adjacent squares.
- The grouping of K-map variables can be done in many ways, so the obtained simplified equation need not to be unique always.
- The Boolean equation must be in must be in canonical form, in order to draw a K-map.
Variable K-maps
There are 4 cells (22) in the 2-variable k-map. It will look like (see below image)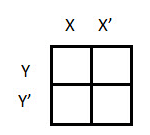 The possible min terms with 2 variables (A and B) are A.B, A.B’, A’.B and A’.B’. The conjunctions of the variables (A, B) and (A’, B) are represented in the cells of the top row and (A, B’) and (A’, B’) in cells of the bottom row. The following table shows the positions of all the possible outputs of 2-variable Boolean function on a K-map.
A general representation of a 2 variable K-map plot is shown below.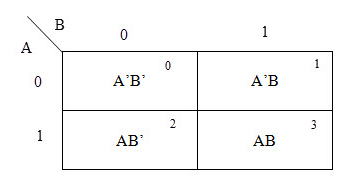 When we are simplifying a Boolean equation using Karnaugh map, we represent the each cell of K-map containing the conjunction term with 1. After that, we group the adjacent cells with possible sizes as 2 or 4. In case of larger k-maps, we can group the variables in larger sizes like 8 or 16.
The groups of variables should be in rectangular shape, that means the groups must be formed by combining adjacent cells either vertically or horizontally. Diagonal shaped or L-shaped groups are not allowed. The following example demonstrates a K-map simplification of a 2-variable Boolean equation.
Example 1: Simplify the given 2-variable Boolean equation by using K-map.
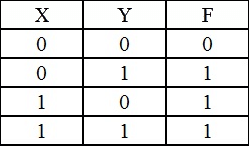
F = X Y’ + X’ Y + X’Y’
First, let’s construct the truth table for the given equation,
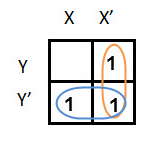
We put 1 at the output terms given in equation.
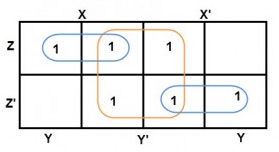
In this K-map, we can create 2 groups by following the rules for grouping, one is by combining (X’, Y) and (X’, Y’) terms and the other is by combining (X, Y’) and (X’, Y’) terms. Here the lower right cell is used in both groups.
After grouping the variables, the next step is determining the minimized expression.
By reducing each group, we obtain a conjunction of the minimized expression such as by taking out the common terms from two groups, i.e. X’ and Y’. So the reduced equation will be X’ +Y’.
Variable K-maps
For a 3-variable Boolean function, there is a possibility of 8 output min terms. The general representation of all the min terms using 3-variables is shown below.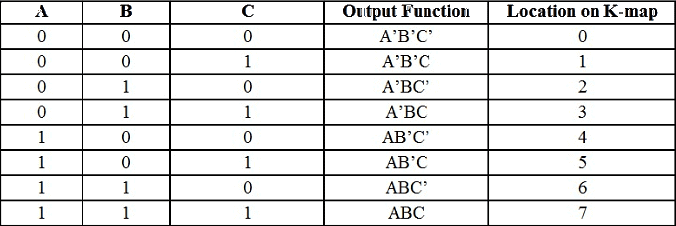
A typical plot of a 3-variable K-map is shown below. It can be observed that the positions of columns 10 and 11 are interchanged so that there is only change in one variable across adjacent cells. This modification will allow in minimizing the logic.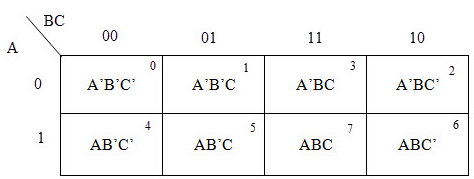
Up to 8 cells can be grouped in case of a 3-variable K-map with other possibilities being 1,2 and 4.
Example 2: Simplify the given 2-variable Boolean equation by using K-map.
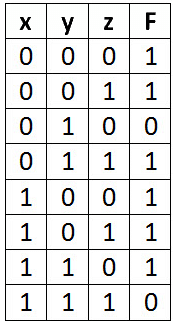
F = X’ Y Z + X’ Y’ Z + X Y Z’ + X’ Y’ Z’ + X Y Z + X Y’ Z’
First, let’s construct the truth table for the given equation,
We put 1 at the output terms given in equation.
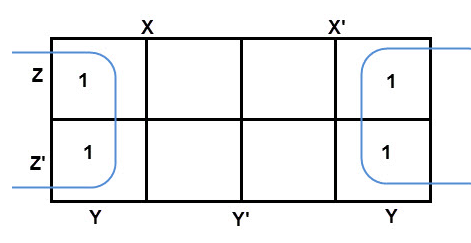
There are 8 cells (23) in the 3-variable k-map. It will look like (see below image).
The largest group size will be 8 but we can also form the groups of size 4 and size 2, by possibility. In the 3 variable Karnaugh map, we consider the left most column of the k-map as the adjacent column of rightmost column. So the size 4 group is formed as shown below.And in both the terms, we have ‘Y’ in common. So the group of size 4 is reduced as the conjunction Y. To consume every cell which has 1 in it, we group the rest of cells to form size 2 group, as shown below.
The 2 size group has no common variables, so they are written with their variables and its conjugates. So the reduced equation will be X Z’ + Y’ + X’ Z. In this equation, no further minimization is possible.
Variable K-maps
There are 16 possible min terms in case of a 4-variable Boolean function. The general representation of minterms using 4 variables is shown below.
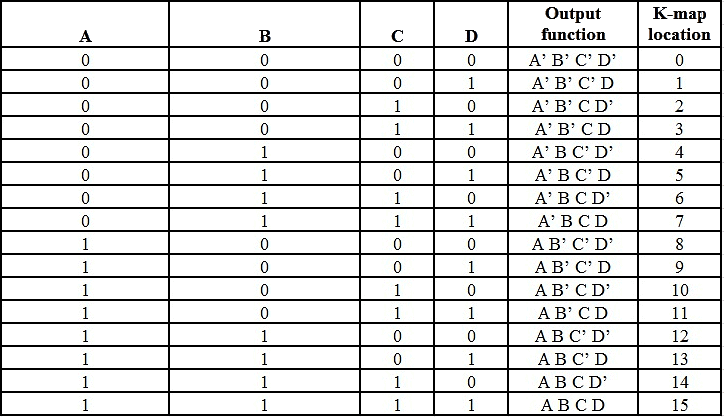
A typical 4-variable K-map plot is shown below. It can be observed that both the columns and rows of 10 and 11 are interchanged.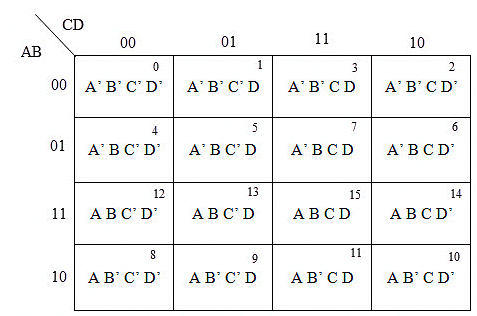
The possible number of cells that can be grouped together are 1, 2, 4, 8 and 16.
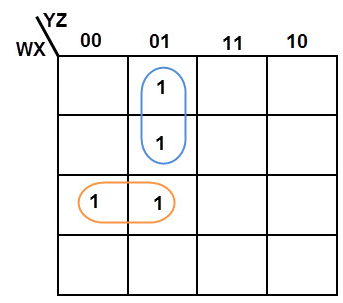
Example 3: Simplify the given 4-variable Boolean equation by using k-map. F (W, X, Y, Z) = (1, 5, 12, 13)
F (W, X, Y, Z) = (1, 5, 12, 13)
By preparing k-map, we can minimize the given Boolean equation as
F = W Y’ Z + W ‘Y’ Z
Variable K-maps
A 5-variable Boolean function can have a maximum of 32 minterms. All the possible minterms are represented below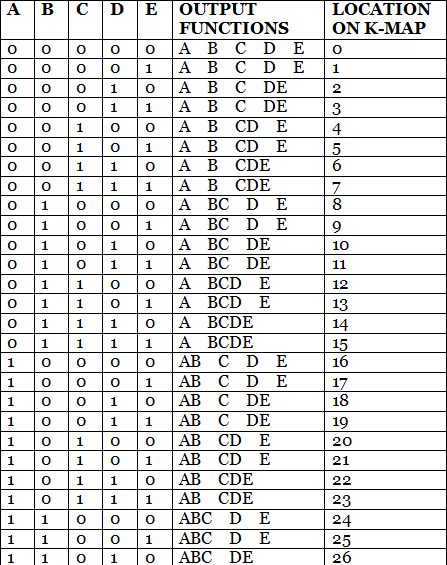
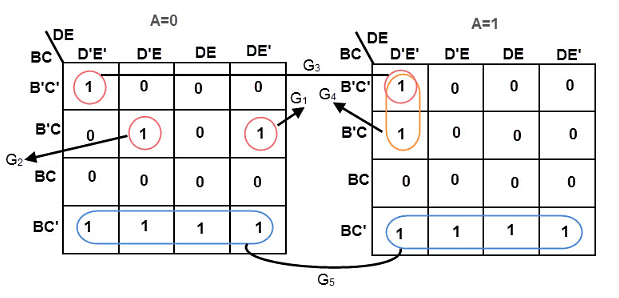
 In 5-variable K-map, we have 32 cells as shown below. It is represented by F (A, B, C, D, E). It is divided into two grids of 16 cells with one variable (A) being 0 in one grid and 1 in other grid.
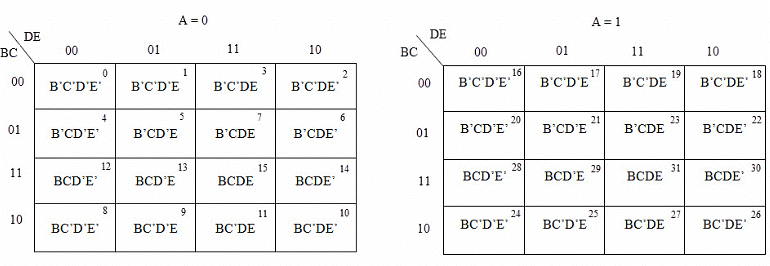 Example 4: Simplify the given 5-variable Boolean equation by using k-map.
f (A, B, C, D, E) = ∑ m (0, 5, 6, 8, 9, 10, 11, 16, 20, 42, 25, 26, 27)
K-map with “Don’t care” conditions
The “Don’t care” conditions are used to replace the empty cell to form a possible grouping of variables. They can be used as either 0 or 1, based on the adjacent variables in the group. The cells that contain “don’t care” conditions are represented by an asterisk (*) symbol among the normal 0’s and 1’s.
In grouping of variables, we can also ignore the “don’t cares”. “Don’t care” conditions are very useful in grouping the variables of large size.
Minimizing an Expression with Don’t Cares
We can minimize the Boolean expression by finding the relative functions of the ‘don’t care’ conditions, by assigning them 0 or 1. If n is the number of don’t cares in a Boolean equation, the number of functions obtained will be 2n.
Implementation of BCD to Gray code Converter using K-map
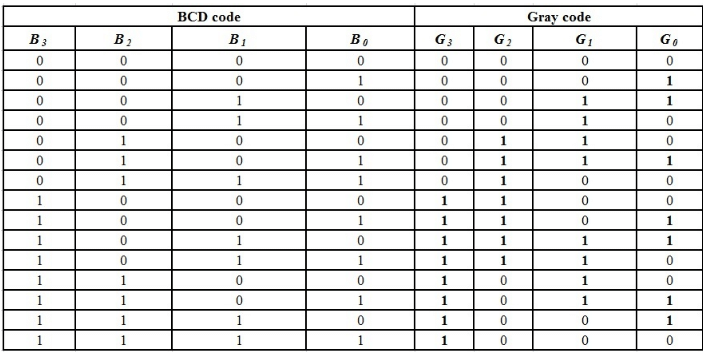
A Gray code is a number series in which two successive numbers differ by one bit. This code acquired its name by the scientist “Frank Gray”. He owned the patent for using the Gray code in shaft registers, in the year of 1953.
We can convert the binary coded decimal (BCD) code to Gray code by using k-map simplification.
Table for BCD code and Gray code
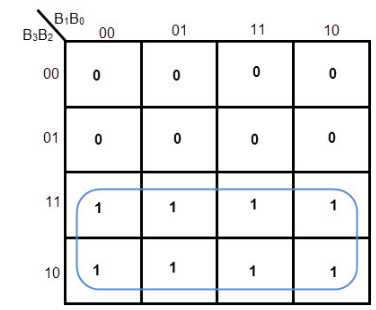
K-MAP FOR G2
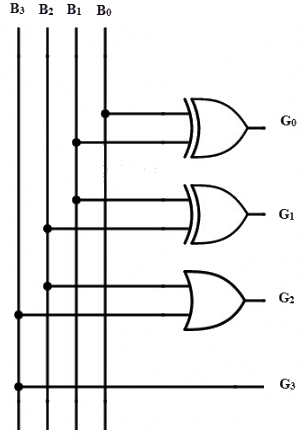
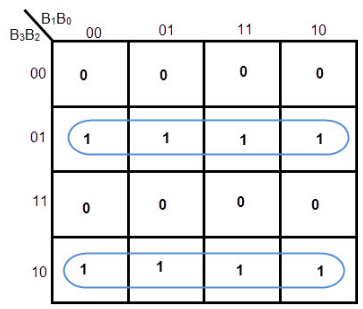 Equation for G2= B3’ B2 + B3 B2’= B3 XOR B2
K-MAP FOR G1
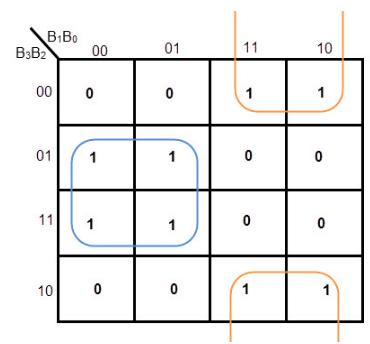 Equation for G1= B1’ B2 + B1 B2’= B1 XOR B2
K-MAP FOR G0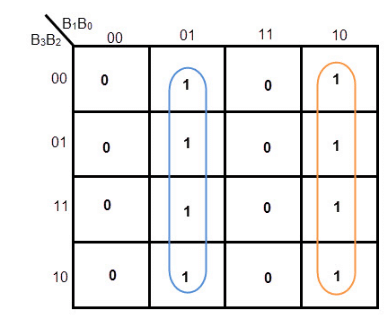 Equation for G0= B1’ B0 + B1 B0’= B1 XOR B0
The the implementation of BCD to Gray conversion using logic gates is shown below. Two EX-OR gates and an OR gate are used.
|
50 docs|15 tests
|

