Introduction to Flowcharts


Flowcharts are visual representations of data or algorithms that aid in understanding code visually. They provide a step-by-step solution to a problem or process, making them a popular choice among beginner-level programmers for understanding computer science algorithms and troubleshooting issues.
A flowchart is made up of boxes that depict the process flow sequentially. It's simple to interpret and understand the process since it is a visual representation. Professionals follow certain rules to draw flowcharts, and this method is widely accepted globally.
Flowchart Importance
A flowchart is a valuable tool in many ways, as outlined below:
- It is a visual aid that enhances the program's clarity and ease of understanding.
- By employing a flowchart, complex programs can be presented in a straightforward and simple manner.
- It provides team members with a deeper understanding of the process, enabling them to gather data, identify issues, create software, and so on.
- A flowchart serves as the first step in designing a new process or incorporating new features.
- Communicating with others becomes more accessible by creating and sharing flowcharts.
When to use flowchart
Flowcharts can be effectively used in the following scenarios:
- Project Design: Flowcharts are a fundamental step in designing projects graphically, which makes them a crucial tool for programmers.
- Identifying Non-essential Logic: Flowcharts are used to differentiate essential logic from non-essential parts of a process, which is helpful to programmers.
- Communication: Due to the universal rules and procedures for creating a flowchart, it serves as a communication channel to improve collaboration and understanding among team members.
- Process Optimization: Flowcharts facilitate process optimization by providing a visual representation of the process, which helps to improve the efficiency of code.
Types of Flowcharts
Flowcharts are classified into three types as follows:
- Process flowchart: This type of flowchart shows the various steps or activities involved in making a product. It provides a clear pathway for analyzing the product to be built. Process flowcharts are frequently used in process engineering to represent the relationships between major and minor components in the product. It is also used in business product modelling to help employees understand the project requirements and gain insight into the project.
- Data flowchart: This flowchart is used to analyze data, specifically the structural details related to the project. It helps in understanding the data inflow and outflow from the system. Data flowcharts are often used to manage data or analyze information flowing to and from the system.
- Business Process Modelling Diagram: This flowchart represents the business process analytically and simplifies the concepts required to understand business activities and the flow of information. It graphically models the business process, paving the way for process improvement.
Types of Symbols used to make a flowchart
There are different types of boxes that are used to make flowcharts. All the different kinds of boxes are connected to one another by arrow lines. Arrow lines are used to display the flow of control. Let's learn about each box in detail.
1. Terminal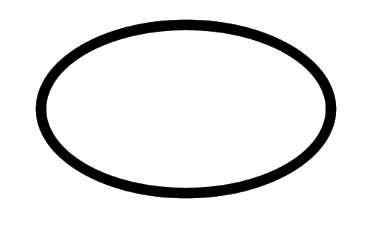
This box is of an oval shape, which is used to indicate the start or end of the program. Every flowchart diagram has this oval shape that depicts the start of an algorithm and another oval shape that depicts the end of an algorithm.
For example: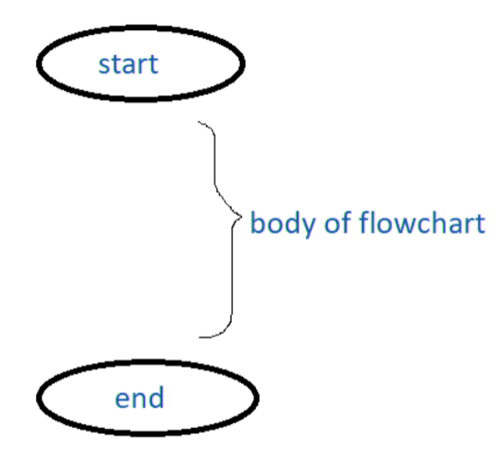
2. Data or Input/Output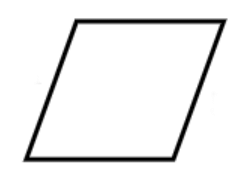
This is a parallelogram-shaped box inside which the inputs or outputs are written. This basically depicts the information that is entering the system or algorithm and the information that is leaving the system or algorithm.
For example: If the user wants to input something and display it, the flowchart for this would be: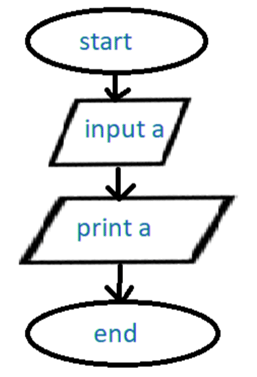
3. Process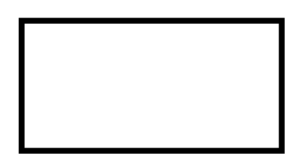
This is a rectangular box inside which a programmer writes the main course of action of the algorithm or the main logic of the program. This is the crux of the flowchart, as the main processing codes are written inside this box.
For example: If the programmer wants to add 1 to the input given by the user, he/she would make the following flowchart: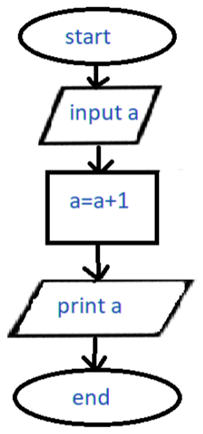
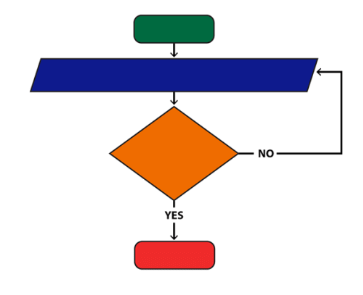
4. Decision
This is a rhombus-shaped box; control statements like if, or conditions like a > 0, etc., are written inside this box. There are 2 paths from this one, which is "yes", and the other one is "no". Like every decision has either yes or no as an option, similarly, this box has these as options.
For example: If the user wants to add 1 to an even number and subtract 1 if the number is odd, the flowchart would be: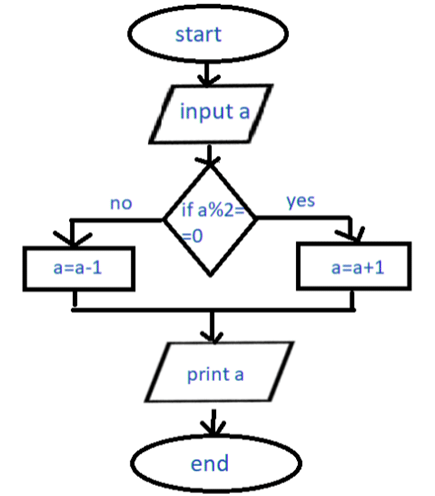
5. Flow Arrow
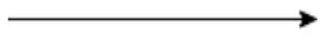
This arrow line represents the flow of the algorithm or process. It represents the direction of the process flow. in all the previous examples, we included arrows in every step to display the flow of the program. Arrow increases the readability of the program.
6. On-Page Reference

This circular figure is used to depict that the flowchart is in continuation with the further steps. This figure comes into use when the space is less and the flowchart is long. Any numerical symbol is present inside this circle, and that same numerical symbol will be depicted before the continuation to make the user understand the continuation. Below is a simple example depicting the use of On-Page Reference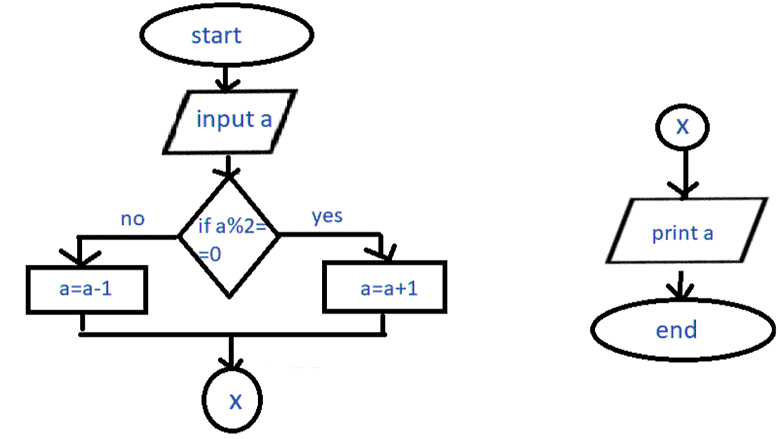
Advantages of Flowchart
- It is the most efficient way of communicating the logic of the system.
- It acts like a guide for the blueprint during program design.
- It also helps in the debugging process.
- Using a flowchart, we can easily analyze the programs.
- Flowcharts are good for documentation.
Disadvantages of Flowchart
- Flowcharts are difficult to draw for large and complex programs.
- It does not contain the proper amount of details.
- Flowcharts are very difficult to reproduce.
- Flowcharts are very difficult to modify.
FAQs on Introduction to Flowcharts
| 1. When should a flowchart be used? |  |
| 2. What are the types of flowcharts? | |
| 3. What types of boxes are commonly used to make a flowchart? | |
| 4. What are the advantages of using a flowchart? | |
| 5. What are the disadvantages of using a flowchart? | |