Flowcharts: Practice Problems | Basics of Python - Software Development PDF Download
Flow Chart
A flowchart is a graphical representation that visually displays the flow of data through a processing system. By looking at a flowchart, one can understand the operations performed and the order in which they are performed in a system.
Algorithms consist of a sequence of steps for solving problems, and a flowchart can be used to represent an algorithm. The flowchart describes the operations required to solve a given problem and the sequence in which they are performed. A flowchart can be thought of as a blueprint for a problem-solving design.
Flowchart Symbols
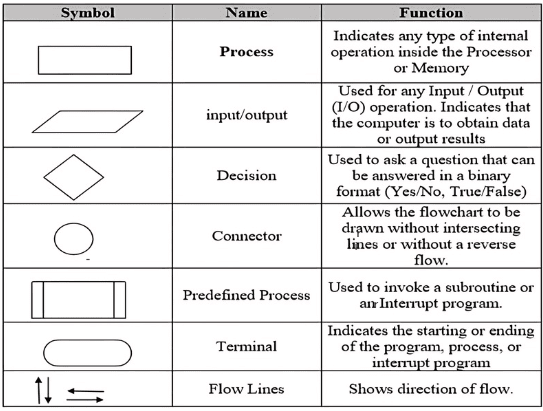
There are 6 basic symbols commonly used in flowcharting of assembly language Programs:
- Terminal,
- Process,
- input/output,
- Decision,
- Connector and
- Predefined Process.
Solved Problems
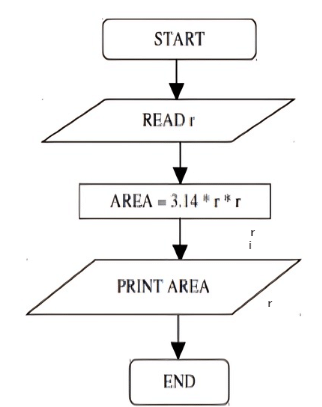
Problem 1: Flowchart to calculate the area of a circle.
Problem 2: Convert temperature from Fahrenheit to Celsius.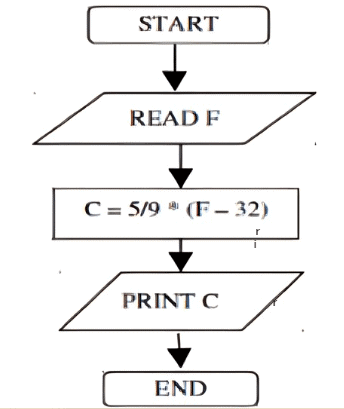
Problem 3: Flowchart to find the greatest of 2 numbers.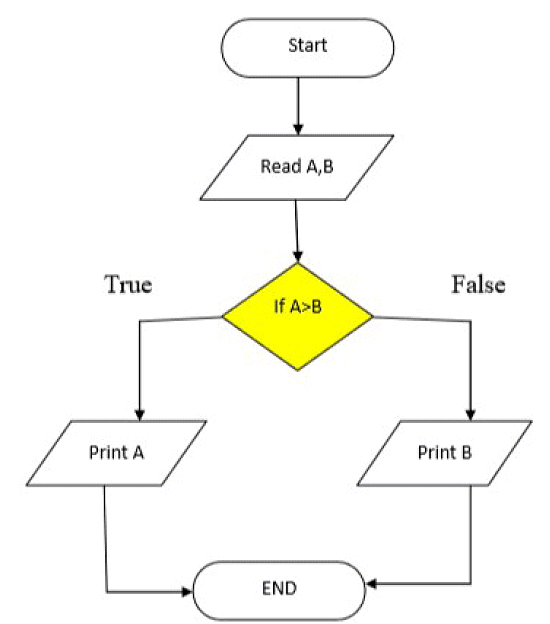 Problem 4: Flowchart to print the Even numbers between 9 and 100.
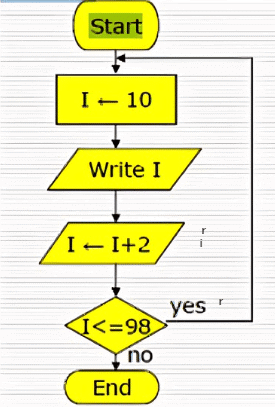
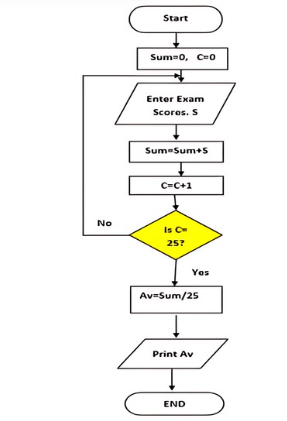
Problem 5: Flowchart for printing odd numbers less than a given number. It should also calculate their sum and count.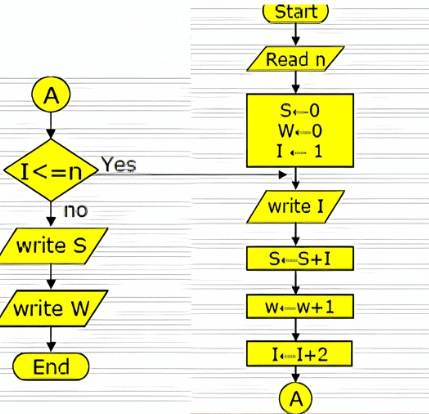 Problem 6: Flowchart for calculating the average from 25 exam scores.
|
53 videos|65 docs|18 tests
|
FAQs on Flowcharts: Practice Problems - Basics of Python - Software Development
| 1. What is a flowchart and why is it important in software development? |  |
| 2. What are some common symbols used in flowcharts? |  |
| 3. How can flowcharts improve communication among team members during software development? |  |
| 4. What are the steps to create a flowchart for a software development process? |  |
| 5. Are there any software tools that can help create flowcharts for software development? |  |


