Class 8 Maths Chapter 13 HOTS Questions - Introduction to Graphs
Q1: The following line graph shows the yearly sales figures for a manufacturing company.
(a) What were the sales in (i) 2002 (ii) 2006?
(b) What were the sales in (i) 2003 (ii) 2005?
(c) Compute the difference between sales in 2002 and 2006.
(d) In which year was there the greatest difference between the sales as compared to its previous year?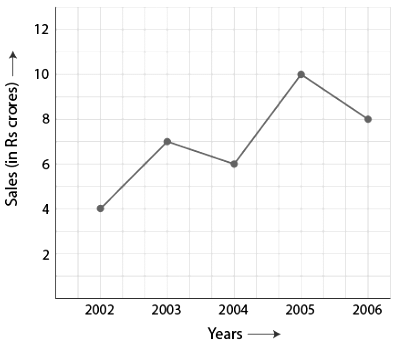
Ans: (a) The sales in (i) 2002 were Rs. 4 crores and (ii) 2006 was Rs. 8 crores
(b) The sales in (i) 2003 was Rs. 7 crores and (ii) 2005 was Rs.10 crores.
(c) The difference of sales in 2002 and 2006 = Rs. 8 crores – Rs. 4 crores = Rs. 4 crores
(d) In the year 2005, there was the greatest difference between the sales and compared to its previous year, which is (Rs. 10 crores – Rs. 6 crores) = Rs. 4 crores.
Q.2: Use the tables below to draw linear graphs:
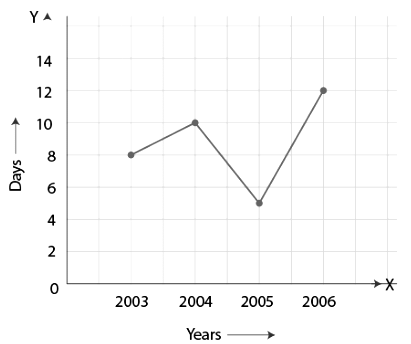
(a) The number of days a hillside city received snow in different years.
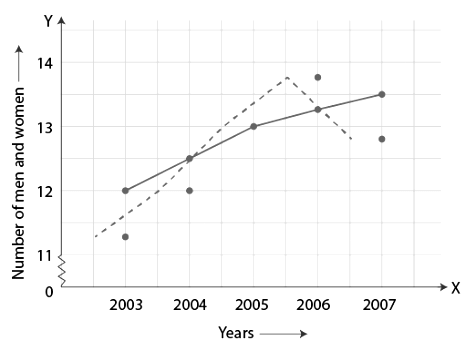
(b) Population (in thousands) of men and women in a village in different years.

Ans: (a) Consider “Years” along the x-axis and “Days” along the y-axis. Using the given information, the linear graph will look like:
(b) Consider “Years” along the x-axis and “No. of Men and No. of Women” along the y-axis (2 graphs). Using the given information, the linear graph will look like:
Q.3: Plot the point (4, 3) on a graph sheet. Is it the same as the point (3, 4)?
Ans: Locate the x, y axes, (they are actually number lines!). Start at O (0, 0). Move 4 units to the right; then move 3 units up, you reach the point (4, 3). From Fig 15.13, you can see that the points (3, 4) and (4, 3) are two different points.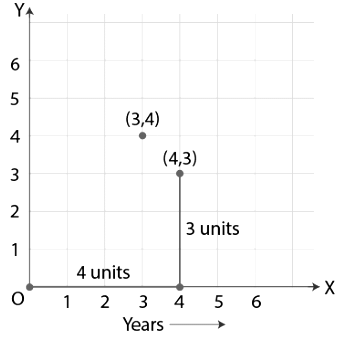
Q.4: Plot the following points on a graph sheet. Verify if they lie on a line:
(a) A(4,0), B(4, 2),C(4,6), D(4, 2.5)
(b) P(1, 1), Q(2, 2), R(3,3), S(4, 4)
(c) K(2, 3), L(5, 3), M(5,5), N(2, 5)
Ans: Plot all the points on the graph.
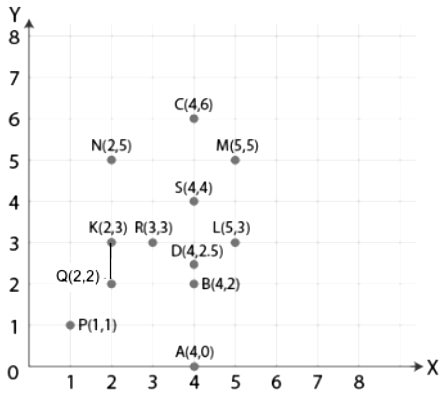
(a) All points A, B, C and D lie on a vertical line.
(b) P, Q, R and S points also make a line. It verifies that these points lie on a line.
(c) Points K, L, M and N do not lie in a straight line
Q.5: Draw the line passing through (2,3) and (3,2). Find the coordinates of the points at which this line meets the x-axis and y-axis.
Ans: Graph for the Line passes through points (2, 3) and (3, 2) is: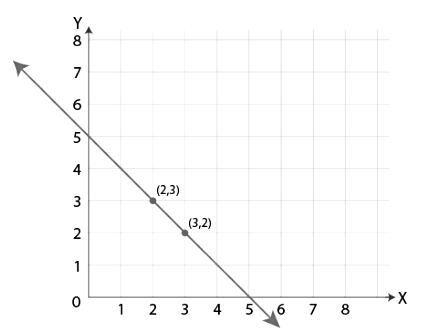
The coordinates of the points at which this line meets the x-axis at (5, 0) and Y axis at (0, 5).
Q.6: Draw the graphs for the following table of values, with suitable scales on the axes.
Interest on deposits for a year.
(i) Does the graph pass through the origin?
(ii) Use the graph to find the interest on Rs 2500 for a year.
(iii) To get an interest of Rs. 280 per year, how much money should be deposited?
Ans: Represent “Deposit” on y-axis and “simple interest” on x-axis.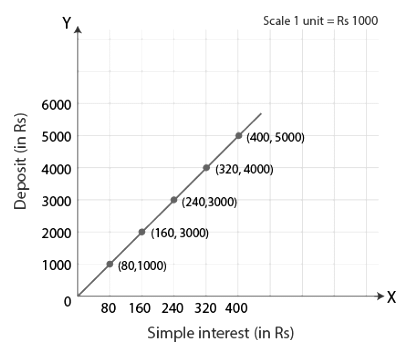
(i) Yes, the graph passes through the origin.
(ii) Interest on Rs. 2500 is Rs. 200 for a year.
(iii) Rs. 3500 should be deposited for the interest of Rs. 280
|
81 videos|413 docs|31 tests
|


