Worksheet: Smart Charts - 2 | Worksheets with solutions for Class 3 PDF Download

Q1: Krishna collected the data on chocolates that need to be donated to an orphanage from his class and represented them in tabular form.
Data of chocolates: Five star-25, Dairy milk-16, Ferrero Rocher-37, Hershey-48, Toblerone -56.
Q2: The below board shows the number of students in each class. It also shows the number of students present and absent.
Attendance Board of 21-Mar-2022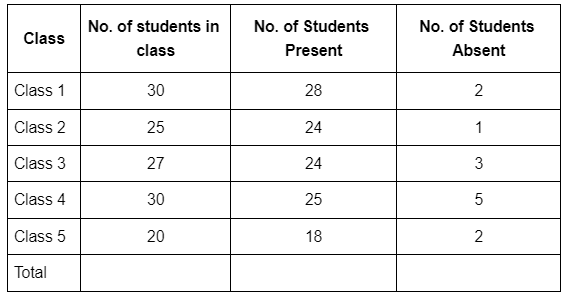
Q3: Kanika bought 10 chocolates, 8 packets of biscuits, 3 bottles of juice, 4 packets of fruit cake and 12 toffees and represented the data using tally marks.
Q4: Doctor Ranjan suggested Krish's grandmother eat as many apples as she can because she is weak for at least for 6months. Dr Ranjan also suggested Krish note the no. of apples eaten by her grandmother every month for around 6 months to track her data.
Q5: Surya conducted a Survey on how many people consider the below fruits as their favourite fruit: Bananas, Apples, Mangoes, Grapes and Oranges. In the survey, he got the data as mango -20, apple -60, grapes-80, bananas-100 and oranges-45. Represent the above data in both vertical and horizontal bar graphs.
Q6: The given pie chart represents the data of students who want to visit different places. Observe the given pie charts and calculate what percentages of students want to visit museums?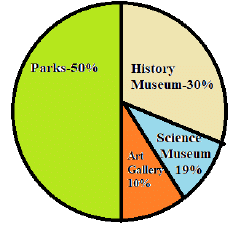
Q7: Given the following table shows the most liked breakfast for children.
Answer the following questions on its basis:
(i) Which is the most liked breakfast?
(ii) Which is the least liked breakfast?
(iii) How many children liked both dosa and Idli?
(iv) How many children liked only Bread and Jam?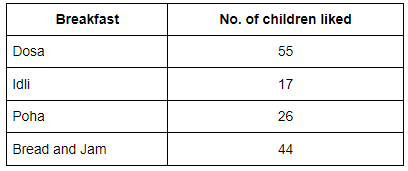
You can access the solutions to this worksheet here.
FAQs on Worksheet: Smart Charts - 2 - Worksheets with solutions for Class 3
| 1. What are smart charts? |  |
| 2. How are smart charts different from traditional charts? | |
| 3. What are the benefits of using smart charts? | |
| 4. How can smart charts be used in business? | |
| 5. Are smart charts accessible to users with limited technical skills? | |


Important questions
,Exam
,Objective type Questions
,practice quizzes
,Summary
,Free
,Worksheet: Smart Charts - 2 | Worksheets with solutions for Class 3
,Worksheet: Smart Charts - 2 | Worksheets with solutions for Class 3
,mock tests for examination
,Viva Questions
,video lectures
,Extra Questions
,study material
,shortcuts and tricks
,Worksheet: Smart Charts - 2 | Worksheets with solutions for Class 3
,Sample Paper
,Previous Year Questions with Solutions
,Semester Notes
,MCQs
,past year papers
,ppt
;


Worksheet: Smart Charts - 2 Free PDF Download
Importance of Worksheet: Smart Charts - 2
Worksheet: Smart Charts - 2 Notes
Worksheet: Smart Charts - 2 Class 3 Questions
Study Worksheet: Smart Charts - 2 on the App
|
© EduRev
|
Education Revolution
|


|


