Tests of significance, Chi-Square Test & Z-Test | Botany Optional for UPSC PDF Download
| Table of contents |

|
| Introduction |

|
| Chi-Square Test Definition |

|
| What Is a Z-Test? |

|
| Key Takeaways |

|
| What's the Difference Between a T-Test and Z-Test? |

|
Introduction
Statistical testing is a critical component of the scientific method, aiding researchers in making informed decisions about the relationships and phenomena they investigate. This article delves into the fundamental concepts of tests of significance, including null and alternative hypotheses, as well as the importance of statistical and practical significance. Additionally, it outlines the process of significance testing in statistics.
What is a Test of Significance?
A test of significance is a formal procedure for comparing observed data with a claim or hypothesis being evaluated. This comparison helps researchers assess the validity of their assertions about population parameters, such as the population proportion (p) or population mean (µ), based on sample data collected from experiments or observational studies.
Null Hypothesis (H0)
The foundation of any significance test is the null hypothesis (H0). This hypothesis represents a proposed theory that has not been proven, either because it is believed to be true or serves as the basis for further investigation. For instance, in a clinical trial for a new drug, the null hypothesis could assert that the new drug is no better, on average, than the current medication. This is symbolized as H0: there is no difference between the two drugs on average.
Alternative Hypothesis (Ha)
In contrast to the null hypothesis, the alternative hypothesis (Ha) is a statement that defines the objective of a statistical hypothesis test. In the clinical drug trial example, the alternative hypothesis could state that the new drug has a different average effect compared to the current drug (Ha: the two drugs have different effects on average). Alternatively, it could claim that the new drug is better on average (Ha: the new drug is better than the present drug on average).
Concluding Significance Tests
Once a significance test is conducted, the final conclusion is usually framed in terms of the null hypothesis. Researchers either "reject the H0 in favor of Ha" or "do not reject the H0." It is crucial to note that conclusions should never state "reject Ha" or "accept Ha."
Understanding Significance in Statistical Testing
- Two critical questions arise when exploring relationships between variables:
- What is the probability of the observed connection existing?
- If it does exist, how strong is this relationship?
- These questions are addressed through two essential tools: tests for statistical significance and measures of association. Tests for statistical significance assess the likelihood that an apparent relationship is merely due to chance.
Tests for Statistical Significance
- Tests for statistical significance quantify the probability that the expected relationship between two variables is merely a random occurrence. They evaluate the probability of making an error by assuming the existence of a relationship. While no certainty can be reached, statistical tests estimate the likelihood of being wrong.
- Statistical significance signifies a substantial chance of correctly identifying a relationship between variables. However, it does not equate to practical significance, where the real-world implications of a finding must be considered.
Test of Significance in Statistics
- In statistical testing, statistical significance represents the probability of research results occurring by chance. Researchers must ensure the quality and accuracy of their experiments, as the significance level can be misleading if not properly interpreted. A common criterion is a 5% probability (or less), indicating that 95% of results are not accidental.
Process of Significance Testing in Test of Significance
The process of significance testing involves several key steps:
- Stating a Hypothesis for Research: Researchers formulate hypotheses to investigate relationships or effects.
- Stating a Null Hypothesis: The null hypothesis is declared as the baseline assumption, representing no effect or relationship.
- Selecting a Probability of Error Level: Researchers choose a significance level, typically 5%, to determine the threshold for statistical significance.
- Selecting and Computing a Statistical Significance Test: Researchers select an appropriate statistical test to evaluate their hypotheses and compute test statistics.
- Interpreting the Results: Finally, researchers interpret the test results to determine whether they can reject the null hypothesis in favor of the alternative hypothesis or if they lack sufficient evidence to do so.
Chi-Square Test Definition
- The Chi-Square test is a statistical procedure designed to assess the disparity between observed and expected data. Beyond this, it aids in determining the correlation between categorical variables within a dataset. Essentially, it helps us discern whether differences between these categorical variables are mere chance occurrences or indicative of a genuine relationship.
- A Chi-Square test is employed when examining the distribution of a categorical variable. Categorical variables, such as animal types or countries, fall into two categories: nominal and ordinal. These variables lack a normal distribution due to their limited number of specific values.
- To illustrate, consider a meal delivery company in India seeking to explore the connection between gender, geography, and people's food preferences.
The Chi-Square test assesses the difference between two categorical variables:- By chance: When variations are statistically insignificant.
- Due to a relationship: When variations are statistically significant.
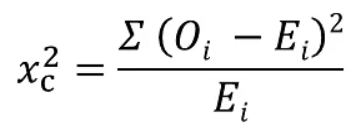
Formula for Chi-Square Test
The Chi-Square test relies on a formula to calculate the test statistic:
Where,
c = Degrees of freedom
O = Observed Value
E = Expected Value
Degrees of freedom in a statistical calculation signify the number of variables subject to variation. Calculating degrees of freedom is crucial to ensure the statistical validity of Chi-Square tests. These tests are commonly used to compare observed data with data that would be expected if a particular hypothesis held true. Observed values are the data gathered, while expected values are frequencies anticipated based on the null hypothesis.
Fundamentals of Hypothesis Testing
Hypothesis testing is a fundamental technique for interpreting population characteristics based on sample data. It helps determine which sample data best supports mutually exclusive population claims.
Two key components of hypothesis testing are:
- Null Hypothesis (H0): This hypothesis assumes that the event under consideration will not occur. It plays a critical role in the study's outcome only if it is rejected. It is denoted as H-naught.
- Alternate Hypothesis (H1 or Ha): The Alternate Hypothesis represents the logical opposite of the null hypothesis. Acceptance of the alternative hypothesis follows the rejection of the null hypothesis. It is denoted as H1.
Categorical Variables: Nominal and Ordinal
Categorical variables belong to a category of variables that can be classified into discrete categories, typically represented by names or labels. These variables, often called qualitative variables, capture the quality or characteristics of a variable.
Categorical variables are divided into two categories:
- Nominal Variable: Categories have no inherent ordering. For instance, gender or blood groups are nominal variables.
- Ordinal Variable: Categories can be ordered or sorted. For instance, customer satisfaction (Excellent, Very Good, Good, Average, Bad) is an ordinal variable.
The Applications of the Chi-Square Test
The Chi-Square test finds widespread use in various fields, including but not limited to:
- Testing Distribution Fit: It assesses whether data follows a known theoretical probability distribution, such as the Normal or Poisson distribution.
- Model Assessment: The Chi-Square test evaluates the goodness of fit of a trained regression model on training, validation, and test datasets.
- Hypothesis Testing: It is most commonly employed for hypothesis testing, where hypotheses are assumptions that can be tested later. The Chi-Square test measures the degree of inconsistency between expected and actual results based on the sample size and the number of variables in the relationship.
Types of Chi-Square Tests
There are two primary types of Chi-Square tests:
- Chi-Square Test of Independence: This test determines whether two sets of variables are related to each other. It is used when counts of values for two nominal or categorical variables are available. A relatively large sample size and independence of observations are prerequisites for this test.
- Chi-Square Goodness-of-Fit Test: In this test, a variable's adherence to a given distribution is examined. It is applied when value counts for categorical variables are known. This test helps decide if data values fit a proposed distribution or if they represent a representative sample of the entire population.
Who Utilizes Chi-Square Analysis?
- Researchers extensively employ Chi-Square analysis when studying survey response data, especially in fields like demography, consumer and marketing research, political science, and economics.
- For instance, consider a scenario where you want to determine if gender influences political party preference. By polling 440 voters in a simple random sample and observing their preferences, you can perform a Chi-Square test of independence to assess the association between gender and political party preference.
Example: Chi-Square Test of Independence
To determine the association between gender and political party preference:
Step 1: Define the Hypothesis
- H0 (Null Hypothesis): There is no link between gender and political party preference.
- H1 (Alternate Hypothesis): There is a link between gender and political party preference.
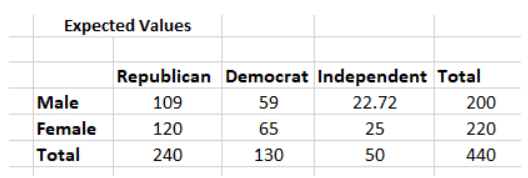
Step 2: Calculate the Expected Values
- Calculate the expected frequency for each cell, e.g., the expected value for Male Republicans.
 For example, the expected value for Male Republicans is:
 Similarly, you can calculate the expected value for each of the cells.
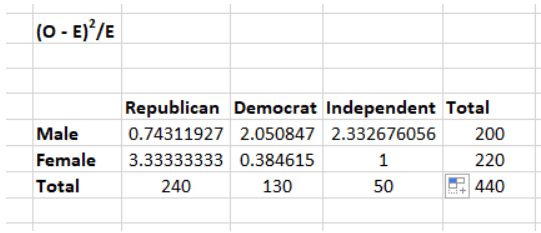
Step 3: Calculate (O-E)2 / E for Each Cell in the Table
- Calculate this for each cell to obtain the Chi-Square statistic.

- Now you will calculate the (O - E)2 / E for each cell in the table.
Where
O = Observed Value
E = Expected Value
Step 4: Calculate the Test Statistic X2
X2 is the sum of all the values in the last table
= 0.743 + 2.05 + 2.33 + 3.33 + 0.384 + 1
= 9.837
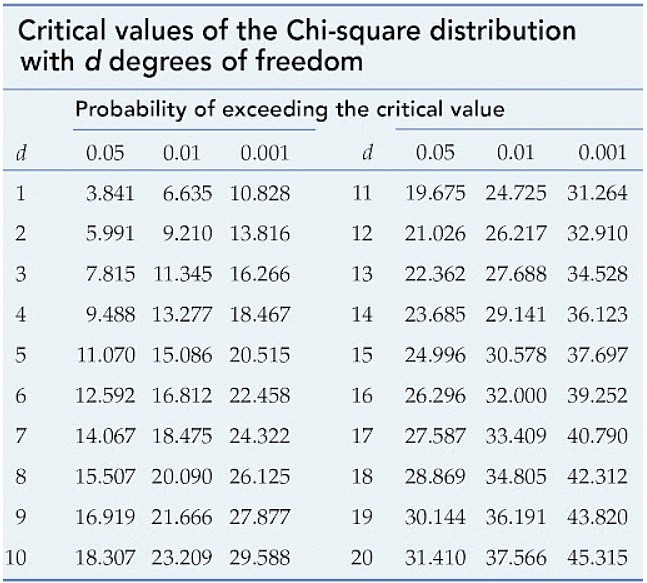
Before you can conclude, you must first determine the critical statistic, which requires determining our degrees of freedom. The degrees of freedom in this case are equal to the table's number of columns minus one multiplied by the table's number of rows minus one, or (r-1) (c-1). We have (3-1)(2-1) = 2.
Finally, you compare our obtained statistic to the critical statistic found in the chi-square table. As you can see, for an alpha level of 0.05 and two degrees of freedom, the critical statistic is 5.991, which is less than our obtained statistic of 9.83. You can reject our null hypothesis because the critical statistic is higher than your obtained statistic.
This means you have sufficient evidence to say that there is an association between gender and political party preference.
Chi-Square Distribution
- The Chi-Square distribution (χ²) is a continuous probability distribution crucial in hypothesis testing. It closely resembles the standard normal distribution, making it valuable for various statistical tests. The distribution's shape depends on the degrees of freedom (k).
- When k is relatively small, the distribution curve appears skewed, with a low probability of χ² being close to 0 or far from 0.
- As k increases, the Chi-Square distribution approximates a normal distribution.
Chi-Square P-Values
P-values denote the probability and are essential for Chi-Square tests. To find the p-value, you can either compare the test statistic (χ²) to a critical value from the Chi-Square distribution table or directly calculate it.
Limitations of the Chi-Square Test
Despite its utility, the Chi-Square test has limitations:
- Sample Size Sensitivity: The Chi-Square test is highly sensitive to sample size, potentially detecting insignificant relationships as statistically significant with large samples.
- Assumption Violations: It assumes that categories have equal proportions, which may not always hold true.
Utilizing SPSS for Chi-Square Testing
- When exploring associations between two categorical variables, you can perform Chi-Square tests using software like SPSS. SPSS provides the necessary tools to compute the Chi-Square test statistic and associated p-values.
- To utilize SPSS for Chi-Square testing, use the "chisq" option in the "statistics" subcommand of the "crosstabs" command. Ensure that each cell in the contingency table contains an adequate sample size for reliable results.
Conclusion
In conclusion, the Chi-Square test is a powerful statistical tool with a broad range of applications, from testing distribution fit to assessing associations between categorical variables. Researchers across diverse fields utilize this test to gain insights from data. Understanding its fundamentals and applications can be instrumental in making informed decisions in data analysis and hypothesis testing.
What Is a Z-Test?
A Z-test is a statistical test employed to determine whether two population means differ significantly when certain conditions are met. Specifically, it is used when the variances of the populations are known, and the sample size is sufficiently large. The test statistic in a Z-test is assumed to follow a normal distribution. However, to perform an accurate Z-test, one must have knowledge of nuisance parameters such as the standard deviation.
Key Takeaways
Here are some key takeaways regarding the Z-test:
- Hypothesis Testing: The Z-test is a hypothesis test in which the test statistic, known as the Z-statistic or Z-score, follows a normal distribution.
- Sample Size Matters: Z-tests are best suited for scenarios with sample sizes greater than 30. This is because, under the Central Limit Theorem, as the sample size increases, the samples tend to approximate a normal distribution.
- Known Standard Deviation: Z-tests assume that the standard deviation of the population is known, distinguishing them from t-tests, which assume the standard deviation is unknown.
Understanding Z-Tests
Performing a Z-test involves several steps:
- Formulate Hypotheses: Define the null hypothesis (H0) and the alternative hypothesis (Ha), along with selecting a significance level (alpha).
- Calculate the Z-Score: Compute the Z-statistic using the provided data.
- Interpret Results: Compare the calculated Z-score with critical values to determine whether to accept or reject the null hypothesis.
Examples of Z-Tests
Various types of tests can be conducted using the Z-test framework. These include:
- One-Sample Location Test
- Two-Sample Location Test
- Paired Difference Test
- Maximum Likelihood Estimate
Comparing Z-Tests and T-Tests
While Z-tests and t-tests are closely related, they have key differences. T-tests are better suited for smaller sample sizes (typically less than 30) and assume that the standard deviation is unknown, whereas Z-tests require a known standard deviation and are appropriate for larger sample sizes.
One-Sample Z-Test Example
Let's illustrate a one-sample Z-test with an example:
Suppose an investor wants to test whether the average daily return of a stock is greater than 3%. A random sample of 50 returns yields an average of 2%, with a known standard deviation of 2.5%. The null hypothesis is that the mean return is equal to 3%, while the alternative hypothesis is that it is greater or less than 3%.
With an alpha level of 0.05% for a two-tailed test, the critical values are ±1.96. Calculating the Z-score:
(0.02 - 0.01) ÷ (0.025 ÷ √ 50) = 2.83
Since the calculated Z-score (2.83) exceeds the critical value (1.96), the investor rejects the null hypothesis and concludes that the average daily return is indeed greater than 3%.
What's the Difference Between a T-Test and Z-Test?
Z-tests are closely related to t-tests, but t-tests are best performed when the data consists of a small sample size, i.e., less than 30. Also, t-tests assume the standard deviation is unknown, while z-tests assume it is known.
When to Use a Z-Test
Use a Z-test when the population standard deviation is known, and the sample size is 30 or more. For cases where the population standard deviation remains unknown, opt for a t-test.
What Is a Z-Score?
A Z-score, also known as a Z-statistic, quantifies how many standard deviations a data point is from the mean of a dataset. It serves as a crucial indicator of a value's relationship to the mean.
Central Limit Theorem (CLT)
The Central Limit Theorem (CLT) asserts that the distribution of a sample approaches a normal distribution as the sample size increases, regardless of the population distribution shape. Sample sizes equal to or greater than 30 are deemed sufficient for the CLT to accurately predict population characteristics—a fundamental assumption for Z-tests.
The Bottom Line
In conclusion, a Z-test is a valuable tool for hypothesis testing in statistics. It helps determine whether two means are significantly different, provided certain conditions are met. Remember that it is suitable when the population standard deviation is known, and the sample size is sufficiently large. In cases where the standard deviation is unknown or for smaller sample sizes, consider employing a t-test.
Statistical analysis is a powerful tool for decision-making in various fields, and understanding the nuances of tests like the Z-test is essential for drawing meaningful conclusions from data.
|
179 videos|143 docs
|
FAQs on Tests of significance, Chi-Square Test & Z-Test - Botany Optional for UPSC
| 1. What is the Chi-Square Test? |  |
| 2. What is a Z-Test? |  |
| 3. What is the difference between a T-Test and Z-Test? |  |
| 4. What are some key takeaways from the article? |  |
| 5. What are some frequently asked questions (FAQs) related to the topic? |  |


