Financial Statement Analysis - 1 | Management Optional Notes for UPSC PDF Download
Introduction
- Periodically, all financial transactions recorded in the books of accounts are summarized and presented through two key financial statements: the Balance Sheet, also known as the position statement, and the Profit and Loss Account, alternatively referred to as the Income Statement. The Balance Sheet provides a snapshot of a firm's assets, liabilities, and capital on the last day of the accounting period, while the Profit and Loss Account reveals the operational results for that specific period. These statements offer insights into the business's management efficiency and future prospects.
- However, to draw meaningful conclusions, it is essential to analyze and interpret the data presented in these financial statements. This unit will explore the nature and purpose of financial statements, the concept of financial analysis, and various analysis techniques. Additionally, we will discuss how financial ratios can be calculated and interpreted to assess an organization's financial stability and profitability.
Nature of Financial Statement
- The critical financial documents for any business organization are the Balance Sheet and Profit and Loss Account. These are periodic reports that depict the financial position and operational outcomes of the entire business over an accounting period, typically one year. These statements present the impact of all business transactions on the financial status and progress of the enterprise.
- The Balance Sheet provides a concise overview of assets, liabilities, and capital, accompanied by detailed schedules outlining various types of assets and liabilities. It highlights the difference between the total value of assets and liabilities as of the Balance Sheet date, incorporating the initial capital, additions, accumulated reserves, and surplus.
- The Profit and Loss Account, or income statement, offers a systematic classification of income and expenditure, serving as a performance report for operations during the year. It reveals the outcome in terms of profit or loss for the period, providing insights into the business's progress between two balance sheet dates. The net profit or loss is considered a measure of management skill and ability.
- The income statement comprises two parts: the first delineates the results of operations for the period, while the second includes items reflecting the distribution of profits for the current and previous years. This section specifies the proposed dividend for shareholders, additions to reserves, and the amount to be carried forward.
Uses and Limitations of Financial Statements
Uses
Financial statements serve various essential purposes, proving invaluable to decision-makers such as management, investors, creditors, and government authorities. Here, we'll delve into the specific uses for these stakeholders:
- Management: The Board of Directors and executives can comprehensively assess the efficiency of operations and the financial state of the business through the information in the financial statements. Management can gauge the firm's ability to meet short-term and long-term liabilities, assess the reasonableness of the proportion of long-term borrowing in the total capital, evaluate the adequacy of profits for dividend payments, and address other crucial matters. Financial indicators provided by the statements assist management in diagnosing unfavorable conditions and implementing corrective measures.
- Investors and Shareholders: Investors and shareholders focus on the financial stability, earning capacity, and future growth of the firm. The statements provide insights into changes over time regarding earnings and financial position, allowing investors and shareholders to form opinions about the business's investment prospects.
- Creditors and Financiers: Short-term creditors use financial statements to determine the firm's ability to pay current liabilities promptly and the value of stocks and other assets acceptable as security for granted credits. Long-term creditors and financiers are more concerned with the firm's ability to repay the principal amount as and when due. Periodic statements' financial data enables the projection of fund generation and cash flows, providing assurance to creditors and financiers about the safety of investments in debentures and loans.
- Government Authorities: Financial statements form the foundation for the taxation of income and wealth by the government. Beyond this, annual statements indicate the growth of earnings and assets, helping identify whether the business tends towards monopolistic practices. This information aids government authorities in determining the necessity for regulating prices and preventing monopolistic practices in the industry.
Limitations
While financial statements are crucial for providing a periodic report on business progress and management, it's important to recognize their limitations:
- Periodic Nature of Statements: The Profit and Loss Account reveal profit or loss for a specific period, offering no insight into the earning capacity over time. Similarly, the Balance Sheet reflects the financial position at a specific point, lacking information about potential changes in the future. Contingent liabilities, dependent on future events, are estimated and shown in the Balance Sheet, and revenue expenditure might be deferred. These factors make it challenging to precisely determine the actual earning capacity or financial state of affairs.
- Statements are not Realistic: Financial statements adhere to accounting concepts and conventions, making the depicted financial position less realistic. Fixed assets, for example, are presented based on their value to the business, considering acquisition cost less depreciation, rather than their estimated resale price. Additionally, the Profit and Loss Account includes probable losses but not probable income, following the accounting convention of conservation.
- Lack of Objectivity Due to Personal Judgement: Many values assigned in financial statements rely on the personal judgement of accountants, lacking objectivity and verifiability. Estimations of the life of fixed assets, depreciation methods, and valuation of inventories (stock) are examples where personal judgement plays a role, often influenced by management's discretion and judgement.
- Only Financial Matters are Reported: Financial statements communicate information solely in monetary terms, excluding non-monetary aspects of business operations. Factors like employee skill development, management reputation, public image, and other qualitative aspects are not reflected in financial statements. Despite their relevance, these factors are crucial for investors when forming opinions about the future prospects of the firm.
Financial Analysis and its Techniques
Financial analysis is the process of evaluating the strengths and weaknesses of a business enterprise using information derived from the Balance Sheet and Profit and Loss Account. It entails a systematic effort to understand the significance of data related to specific items or groups of items presented in financial statements. The primary goal of financial analysis is to gain insights into the profitability of business operations and the financial position to assess whether progress is satisfactory or if there is improvement. This may involve comparing income, expenses, and profits of the current year with those of previous years, or evaluating changes in expenses relative to income, profits in relation to capital invested, short-term liabilities in relation to short-term assets, and other relevant comparisons.
Techniques of Financial Analysis
There are three main techniques for financial analysis based on data from annual statements:
1. Comparative Statements:
- This technique involves preparing Comparative Balance Sheets and Comparative Income Statements to highlight changes in various assets, liabilities, income, and expenditures.
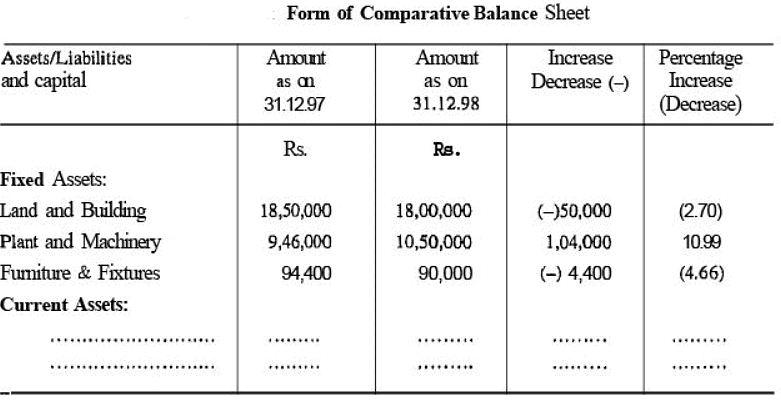
- In a Comparative Balance Sheet, figures for assets and liabilities are presented at the beginning and end of the year, along with the extent of increases or decreases between the two dates.
- Changes may be expressed as percentages to provide a clearer understanding.
- A sample format for a Comparative Balance Sheet is illustrated in Figure below

In a Comparative Balance Sheet, the data can extend beyond two years, allowing for a comparison of figures over successive years to observe trends in increases or decreases. When comparing, percentage changes are more valuable than absolute changes as they provide a better understanding of the relative changes in various items. For example, in a scenario where there is an absolute decrease in both land and buildings and furniture and fixtures, the percentage decrease in land and buildings might be relatively lower.
The Comparative Income Statement follows a similar principle to the Comparative Balance Sheet, presented in a vertical form. It includes columns to display income and expenditure for two or more years, along with the increase or decrease in amounts and percentage changes. These percentages reflect the changes occurring over successive periods, aiding in the detection of unusual changes and determination of their causes.
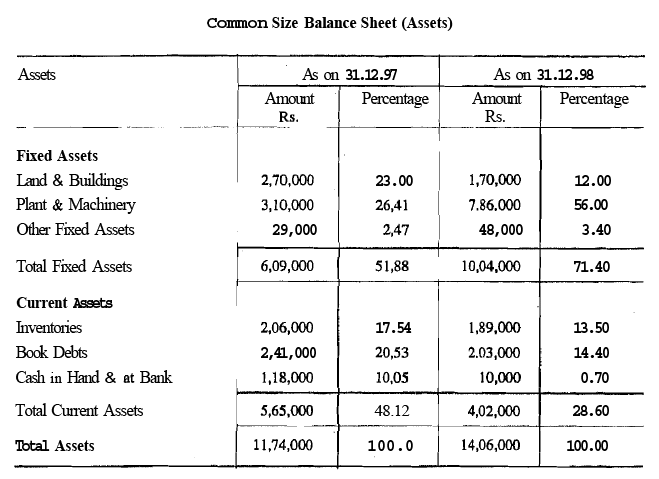
2. Common Size Statements: In this analytical technique, each item in the financial statements is expressed as a ratio or percentage of the aggregate. A Common Size Balance Sheet, for instance, shows the percentage of each asset to the total assets, and the percentage of each liability to the total liabilities. Essentially, it illustrates the relationship of each component to the total. Comparative Common Size Balance Sheets can be prepared for multiple years, offering a comprehensive view of the changes over time.

In the Common Size Income Statement, expenditure items are presented as percentages of net sales, revealing the relationship of each item to net sales. When prepared for successive periods, this statement illustrates changes in the respective percentages over time. By expressing expenses as a percentage of net sales, it provides valuable insights into the distribution and impact of costs in relation to revenue.
3. Ratio Analysis: Ratio analysis involves expressing one number in terms of another, providing a measure of the relationship between two magnitudes. Instead of relying on absolute numbers or changes, financial ratios are used as indicators of financial position and operational progress in terms of profitability and more. Ratio analysis is widely utilized as a key technique for financial analysis. Further insights into the nature and usefulness of ratio analysis will be discussed in subsequent sections.
Meaning of Ratio Analysis
- A ratio is a measure of the relationship between two numbers or values, expressed as the quotient of one number divided by another. This ratio indicates the value of one item per unit of the value of another, or the value of one item being a certain number of times or a fraction of the other value. For example, if the sales to stock ratio (stock turnover) is 3, it means that the sales value is three times the value of the stock in hand.
- A percentage is a specific type of ratio in which one value is expressed per 100 of another value. The quotient, when multiplied by 100, provides the percentage figure. For instance, if the ratio of gross profit to sales is 20%, it implies that for every 100 rupees worth of sales, the gross profit earned is Rs. 20, or for every rupee of sale, it is 20 paise.
- Analysis involves the identification of specific items from a set of figures, systematically classifying and grouping them to present in a convenient and easily understandable form for interpretation. Financial statements data, for example, can be grouped as fixed assets, investments, current assets, quick assets, proprietors' funds, long-term debt, current liabilities, fixed expenses, variable expenses, etc., highlighting interrelationships and facilitating interpretation.
- The mathematical expression of the relationship between two accounting figures is known as a 'financial ratio' or 'accounting ratio'. Ratio analysis is the process of computing, determining, and explaining the relationship between component items of financial statements in terms of ratios. It employs accounting ratios rather than absolute figures as indicators of the financial position and performance of a firm.
 |
Download the notes
Financial Statement Analysis - 1
|
Download as PDF |
Objectives of Ratio Analysis
Financial statements contain a wealth of data that requires analysis to gain insights into various aspects of business operations and financial position. Ratio analysis serves as an invaluable tool for this purpose.
The objectives of ratio analysis include:
- Assessing the Financial Condition: Determining whether the financial condition of the business unit is fundamentally sound.
- Evaluating Capital Structure: Examining whether the capital structure of the business unit is appropriate.
- Analyzing Profitability: Assessing whether the profitability of the business unit is satisfactory.
- Examining Credit Policy: Evaluating the soundness of the credit policy of the business unit concerning sales and purchases.
- Assessing Creditworthiness: Determining whether the business unit is creditworthy.
Ratio analysis is applicable to all types of business organizations, including sole proprietorships, partnerships, companies, and cooperative societies. By examining various ratios derived from financial data, stakeholders can make informed decisions about the financial health, efficiency, and prospects of the business.
Classification of Ratios
Ratios play a crucial role in financial analysis, and given the multitude of ratios available, they can be classified based on various criteria.
Here are different classifications of ratios:
- On the basis of their nature:
- Financial Ratios: These ratios involve financial or non-operational items. Examples include current ratio, quick ratio, and debt-equity ratio.
- Operating Ratios: These ratios explain relationships between operational items of the enterprise, such as turnover ratios, earning ratios, and expenses ratios.
- On the basis of their importance:
- Primary Ratios: These are considered crucial, such as operating profit to operating capital employed.
- Secondary Ratios: Examples include the ratio of direct materials cost to the value of production and the ratio of output to factory employees.
- On the basis of the source of data:
- Balance Sheet Ratios: These indicate short-term or long-term financial positions and include ratios like current ratio, quick ratio, proprietary ratio, and debt-equity ratio.
- Profit and Loss Account Ratios: These reflect the relationships within the Profit and Loss Account, indicating profitability and efficiency. Examples are gross profit ratio, net profit ratio, operating ratio, and stock turnover ratio.
- Combined or Composite Ratios: These consider relationships in both Profit and Loss Account and Balance Sheet, indicating operational efficiency. Examples include net profit to total assets ratio, net profit to equity capital ratio, and debtors turnover ratio.
- On the basis of their function:
- Functional Ratios: Classified based on the purpose or function served, these include:
- Liquidity Ratios: Assess the ability of the firm to meet short-term obligations.
- Solvency Ratios: Indicate the firm’s ability to meet long-term liabilities.
- Turnover Ratios: Indicate the efficiency with which funds have been employed in business operations.
- Profitability Ratios: Indicate the profit-earning capacity of the business.
- Functional Ratios: Classified based on the purpose or function served, these include:
In practical analysis, a combination of these classifications is often used to select and apply the most relevant ratios based on the specific nature, objectives, and questions to be answered in the financial analysis process.
Ratios to Assess Financial Soundness
- The financial stability of a company is typically assessed in terms of liquidity and solvency. Liquidity refers to the firm's ability to meet its short-term obligations within one year. While a company may choose to hold excess current assets to fulfill current liabilities, maintaining an optimal balance is crucial.
- Holding excessive liquidity can be unwise as idle current assets do not generate earnings, but inadequate liquidity poses the risk of failing to meet current liabilities, risking the confidence of short-term creditors. Ratios used to assess short-term liquidity are known as "liquidity ratios," which are of interest to entities like bankers and raw material suppliers.
- On the other hand, solvency ratios, also known as capital structure or leverage ratios, evaluate the company's long-term solvency. These ratios gauge the firm's ability to regularly pay interest and repay principal amounts, identifying the composition of borrowed and owner's capital in financing assets. Maintaining an appropriate mix of borrowed and owner's capital is crucial, considering their different implications.
- Debt implies a contractual obligation to pay interest regardless of profit or loss, with non-compliance risking legal consequences and potential bankruptcy. The rate of return on borrowed capital affects shareholder returns, magnifying returns if it exceeds the interest rate and reducing returns if it falls below. Additionally, owner's funds act as a margin of safety for creditors, and a diminished equity base reduces borrowing capacity, posing risks for investors. Solvency ratios are particularly relevant for long-term creditors, financial institutions, and debenture holders.
- Leverage ratios, derived from Balance Sheet information, assess the company's financial structure. Some leverage ratios use income statements to measure whether operating profits adequately cover fixed charges.
Liquidity Ratios
As mentioned earlier, liquidity ratios play a crucial role in evaluating the firm's capacity to meet its current obligations.
The key ratios in this category include:
- Current Ratio
- Quick Ratio
1. Current Ratio:
- This ratio establishes the relationship between current assets and current liabilities, often referred to as Working Capital. Working capital represents the difference between current assets and current liabilities. The primary purpose of the current ratio, also known as the working capital ratio, is to determine the extent of current assets available against each rupee of current liability.
- To calculate the current ratio, one must obtain the values of current assets and current liabilities. Current assets encompass cash in hand, cash at the bank, and all other assets convertible into cash in the ordinary course of business, such as bills receivable, sundry debtors (considering only good debts), short-term investments, and stock. Current liabilities include all payment obligations due within a year, such as sundry creditors, bills payable, income received in advance, outstanding expenses, bank overdraft, short-term borrowings, provisions for taxation, dividends payable, and long-term liabilities to be settled within one year.
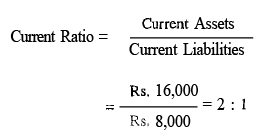
- The formula used to compute the current ratio is as follows:

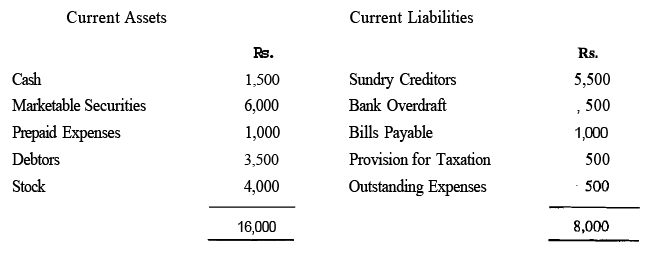
Illustration 1: The following are the assets and liabilities of Z Ltd. as on December 31, 1998. Calculate the Current Ratio.
 Ans: In order to calculate the current ratio, we have to ascertain the sums of current assets and current liabilities.

The current ratio reveals the ability of the firm to meet all the obligations maturing within a year (current obligations). Conventionally it is said that the current ratio should be 2 : 1. It means that for every one rupee of current liability the firm must have tow rupees worth of current assets. The reason for this conventional norm is that, all the current assets cannot be converted into cash immediately. For example, some of the sundry debtors may take longer time to realise, stock may not be saleable for cash immediately. The logic behind the prescription of 2 : 1 norm is that even in the worst situation where the asset values fall by fifty per cent, the firm will be able to meet its current obligations. This will act as a margin of safety to the creditors.
The ratio is a crude measure of liquidity. It places greater reliance on quantity of current assets, rather than their quality. For instance, if the firm's current assets include a large amount of non-paying debtors or non-moving stocks, then the firm’s ability to meet its current liabilities is not assured. Therefore, it is desirable that the nature of current assets being held should be carefully examined.
2. Quick Ratio
This ratio is also called liquid ratio or acid test ratio. It establishes the relationship between quick assets and current liabilities. Quick assets are those which can be converted into cash without any loss or delay. All the current assets, excepting stock and prepaid expenses, are considered to be 'quick assets'. The reason for excluding stock from quick assets is that, in most cases, stock cannot be sold immediately for cash. Likewise, prepaid expenses cannot be converted into cash. Sometimes, a firm having a high current ratio may find it difficult to pay the short-term creditors due to the presence cf a large amount of stock in current assets. In such a case, the current ratio may be misleading. To overcome the drawback, the quick ratio is calculated to assess the liquidity of a film in its real sense. The purpose of this ratio is to find out the extent of quick assets available for a rupee of current liability.
The following formula is used to calculate this ratio:
Illustration 2: Taking the' particulars of Illustration 1 calculate Quick Ratio.
Ans: In order to calculate quick ratio, we have to asqertain the amount of quick assets and current liabilities

Generally, a quick ratio of 1 : 1 is considered to be satisfactory, because it takes into account only liquid assets whose realisable value is almost certain. A firm with 1 : 1 quick ratio is expected to be able discharge all its current obligations. The higher the ratio, the greater would be the capacity of the firm to meet its current commitments and vice-versa. But, a higher ratio may be an indication of utilisation of only liquid assels due to inerficiency of management. On the contrary, a lower ratio may threaten the liquidity position of the business.


