IGCSE Class 10 > Class 10 Notes > Mathematics for GCSE/ > Distance-Time & Speed-Time Graphs
Distance-Time & Speed-Time Graphs

Distance-Time Graphs
How does a distance-time graph work?
- Distance-time graphs illustrate the distance from a fixed point at various time intervals.
- The vertical axis represents distance, while the horizontal axis signifies time.
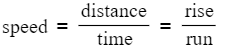
- The gradient of the graph corresponds to the speed of the object.
- A positive gradient indicates the object is moving away from the starting point.
- A horizontal line denotes that the object is stationary.
- A negative gradient suggests the object is moving towards the starting point.
- A straight line on the graph indicates a constant speed.
- If the graph is curved, you can draw a tangent at a specific point to estimate the speed at that moment.
- Example: Consider a car traveling from point A to point B. The distance-time graph would show the distance covered by the car at different times during the journey.
Speed-Time Graphs
What is a speed-time graph?
- Speed-time graphs provide information about speed at different times, with speed on the vertical axis and time on the horizontal axis.
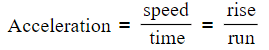
- The gradient of the graph represents acceleration, calculated
- If the graph is a curve, you can estimate the acceleration at a point by drawing the tangent at that point and finding its gradient.
- A positive gradient indicates positive acceleration, meaning the object is speeding up.
- A horizontal line on a speed-time graph signifies constant speed, indicating no acceleration.
- A negative gradient indicates negative acceleration or deceleration, meaning the object is slowing down.
- The distance covered can be determined by finding the area under the graph.
MULTIPLE CHOICE QUESTIONTry yourself: What does a positive gradient on a distance-time graph indicate?
The document Distance-Time & Speed-Time Graphs is a part of the Class 10 Course Mathematics for GCSE/IGCSE.
All you need of Class 10 at this link: Class 10
FAQs on Distance-Time & Speed-Time Graphs
| 1. What is a distance-time graph? |  |
Ans. A distance-time graph is a visual representation of an object's distance traveled over a period of time. The horizontal axis represents time, while the vertical axis represents distance.
| 2. How can you interpret a distance-time graph? | |
Ans. The slope of a distance-time graph represents the speed of the object. A steeper slope indicates a faster speed, while a horizontal line indicates the object is not moving.
| 3. What is a speed-time graph? | |
Ans. A speed-time graph is a visual representation of an object's speed over a period of time. The horizontal axis represents time, while the vertical axis represents speed.
| 4. How are distance-time and speed-time graphs related? | |
Ans. The slope of a distance-time graph is equal to the speed of the object, which means that the speed-time graph can be derived from the distance-time graph by finding the slope at each point.
| 5. How can you calculate the distance traveled from a speed-time graph? | |
Ans. The area under a speed-time graph represents the distance traveled by the object. By calculating the area under the curve, you can determine the total distance traveled.
About this Document

4.81/5 Rating

Apr 19, 2026 Last updated
Related Exams
Document Description: Distance-Time & Speed-Time Graphs for Class 10 2026 is part of Mathematics for GCSE/IGCSE preparation. The notes and questions for Distance-Time & Speed-Time Graphs have been prepared according to the Class 10 exam syllabus. Information about Distance-Time & Speed-Time Graphs covers topics like and Distance-Time & Speed-Time Graphs Example, for Class 10 2026 Exam. Find important definitions, questions, notes, meanings, examples, exercises and tests below for Distance-Time & Speed-Time Graphs.
Introduction of Distance-Time & Speed-Time Graphs in English is available as part of our Mathematics for GCSE/IGCSE for Class 10 & Distance-Time & Speed-Time Graphs in Hindi for Mathematics for GCSE/IGCSE course. Download more important topics related with notes, lectures and mock test series for Class 10 Exam by signing up for free. Class 10: Distance-Time & Speed-Time Graphs
Description
Distance of Mathematics covers all the important topics, helping you prepare for the Class 10 exam on EduRev. Start for free!
Information about Distance-Time & Speed-Time Graphs
In this doc you can find the meaning of Distance-Time & Speed-Time Graphs defined & explained in the simplest way possible. Besides explaining types of Distance-Time & Speed-Time Graphs theory, EduRev gives you an ample number of questions to practice Distance-Time & Speed-Time Graphs tests, examples and also practice Class 10 tests


Related Searches
Previous Year Questions with Solutions, Extra Questions, study material, Viva Questions, practice quizzes, Distance-Time & Speed-Time Graphs, Objective type Questions, Free, video lectures, Exam, mock tests for examination, Semester Notes, pdf , Summary, Sample Paper, Distance-Time & Speed-Time Graphs, MCQs, shortcuts and tricks, past year papers, Distance-Time & Speed-Time Graphs, Important questions, ppt;