Introduction to Industrial Engineering

Introduction
Industrial engineering focuses on the integration and efficient use of various resources to enable effective production operations. This involves ensuring that the inputs to the production-operation system-such as people, materials, equipment, and information-are utilized correctly to form a cohesive unit that meets production or operation goals.
- Industrial engineering addresses not only the system of materials, equipment, and processes but also the people who interact with this system, both internally and externally. For example, within the system, workers and operators are involved in activities like work studies and time and motion studies. Externally, customers are considered to understand demand and gather feedback.
- Industrial engineering is applicable not only to manufacturing but also extends to service sectors.
Break Even Analysis (BEA)
Cost-volume-profit analysis examines the interaction of a firm's sales volume, selling price, cost structure, and profitability. It is a powerful tool for making managerial decisions, such as determining the minimum number of units needed to produce a profit and the number of units required to achieve a specific profit target, as well as for making other investment decisions.
Target profit analysis focuses on estimating the level of sales required to achieve a specific target profit, whereas break-even analysis is a special case of target profit analysis where the target profit is zero. In break-even analysis, costs are divided into variable and fixed components.
Assumptions of Break-even Analysis:
- The selling price remains constant.
- Costs are linear and categorized into variable and fixed.
- Inventories do not change.
- In multi-product companies, the sales mix remains constant.
Cost Components:
(a) Fixed Cost: These costs remain constant regardless of the production volume. Examples include machine costs, building rent, salaries of watchmen and higher officials, advertisement costs, insurance, and interest.
(b) Variable Cost (V = vx): These costs increase directly and proportionally with the production volume. They include direct materials, direct labor, and running costs.
(c) Total Cost: This represents the total expenditure made to produce a certain number of units, and it is the sum of fixed and variable costs.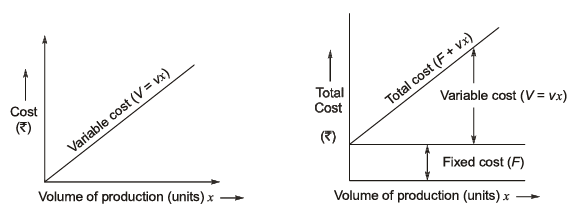
It comprises of variable and fixed cost elements.
Notations:
F = Fixed cost in rupees; x = Number of units produced to earn profit 'P'.
v = Variable cost/unit (₹/unit); V= Total variable cost in ₹ (v × x)
s = Selling price/unit (₹/unit); S = Total sale or revenue in ₹ (s × x)
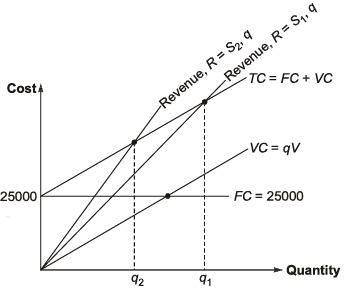
Break-Even Chart
A break-even chart illustrates the sales volume level at which total costs equal total sales. The break-even point is the production volume where total sales equal total costs, meaning the organization neither makes a profit nor incurs a loss. This point is also referred to as the "no profit, no loss" point.
Total sale = Total cost + profit
Total sale = S = sx
Total cost = F + V = F + vx
Profit = P
S = F + vx + P
or sx = F + vx + P
(s-v)x = F + P
Number of units produced for profit 'P '.
At BEP, Profit, P = 0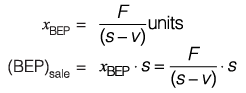
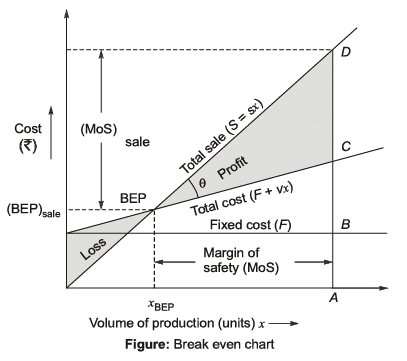
Note: The break-even point is least affected by "volume of production". It depends on the total cost, selling cost, and variable cost.
Solved Example
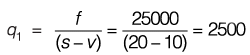
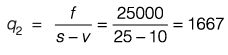
Example 1: The cost of producing between 1500 units and 2500 units of a product consists of Rs. 25,000 fixed cost and Rs. 10 per unit variable cost. With the selling price at Rs. 20 per unit, what is the break-even point? Suppose the price per unit was increased to Rs. 25. Illustrate with a neat sketch how does this affect the break-even point.
Sol:
Given: Fixed cost, f= 25000; Variable cost,
v = 10 per unit, Selling price, s = 20
At break-even points,
Total cost = Total revenue
f + vq1 = sg1
⇒ 
Now price becomes, s = 25
∴ 
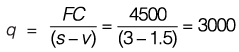
Example 2: Following is information regarding a manufacturing enterprise: Total fixed costs = Rs. 4,500; Total variable costs = Rs. 7,500; Total sales = Rs. 15,000; Units sold = 5,000 Find out:
(i) Break-even point in units
(ii) Margin of safety
(iii) Profit
(iv) Volume of sales to earn a profit of Rs 6,000
Sol: Given: Total fixed cost, f = 4500,
Total variable cost, v = 7500,
Total sales, s = 15000,
Units sold = 5000
∴ Selling price of one unit, s = 15000/5000 = 3
Variable cost of one unit, v = 75000/5000 = 1.5
(i) Break-even points,
⇒ 
(ii) Margin safety = Budgeted sale - Breakeven sales
Sales = 15000-(3000x3) = 6000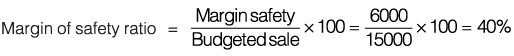
FAQs on Introduction to Industrial Engineering
| 1. What is Break Even Analysis (BEA)? |  |
| 2. How is a Break Even Chart useful in Industrial Engineering? | |
| 3. Can Mechanical Engineers benefit from Break Even Analysis? | |
| 4. What are the key components of a Break Even Analysis? | |
| 5. How does Break Even Analysis help in decision-making for Mechanical Engineers? | |


