Time: 1 hour
M.M. 30
Attempt all questions.
Question numbers 1 to 5 carry 1 mark each.
Question numbers 6 to 8 carry 2 marks each.
Question numbers 9 to 11 carry 3 marks each.
Question number 12 & 13 carry 5 marks each
Q1: What is the arithmetic mean of the numbers 4, 8, and 12? (1 Mark)
(i) 6
(ii) 8
(iii) 10
(iv) 12
Ans: b)
The arithmetic mean is calculated as (4 + 8 + 12)/3 = 8.
Q2: The following bar graph represents the number of students in five different classes:
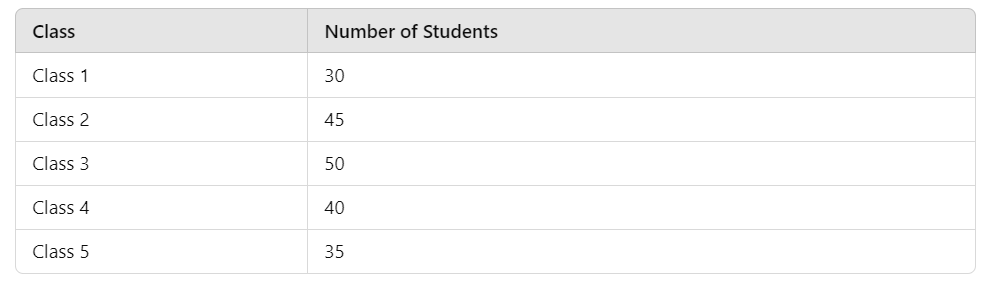 Which class has the highest number of students, and how many more students does it have than the class with the least number of students?
a) Class 1, 20 more students
b) Class 3, 20 more students
c) Class 3, 10 more students
d) Class 2, 15 more students
Ans: b)
Class 3 has 50 students (the highest), and Class 1 has 30 students (the least). The difference is 50 - 30 = 20 students.
Q3: If the range of data is 25 and the smallest value is 12, what is the largest value? (1 Mark)
(i) 25
(ii) 37
(iii) 12
(iv) 50
Ans: b)
Range = Largest value - Smallest value; so Largest value = Range + Smallest value = 25 + 12 = 37.
Q4: True or False: The mode is always one of the numbers in the data. (1 Mark)
Ans: True
Mode is the number that appears most frequently in a set of data.
Q5: What is the mode of the data set 3, 5, 6, 7, 3, 8, 9, 3? (1 Mark)
(i) 3
(ii) 5
(iii) 6
(iv) 7
Ans: a) 3
The number 3 occurs most frequently in the data set.
Q6: Define the following terms: (i) Observations (ii) Data (iii) Frequency of an observation (iv) Frequency distribution (2 Marks)
Ans:
(i) Observation is the activity of paying close attention to someone or something in order to get information in numerical form.
(ii) Data: The collection of observations is known as data.
(iii) Frequency of an observation: The number of times an observation occurs in a given data is called the frequency of an observation.
(iv) Frequency distribution: It is a method of presenting raw data in a form that can be easily understood.
Q7: The heights (in cm) of 5 students are: 150, 160, 145, 155, and 165. What is the range of their heights? (2 Marks)
Ans: Range = 165 - 145 = 20 cm
Range is the difference between the largest and smallest values.
Q8: Find the median of the following data set: 12, 14, 16, 18, 20, 22, 24. (2 Marks)
Ans: The median is the middle number, which is 18.
Arrange the data in order, and the middle value is 18.
Q9: The ages (in years) of 11 players in a football team are as follows: 22, 28, 19, 30, 25, 22, 24, 28, 22, 30, 19
Find the mean, mode, and median of this data. Are the three measures of central tendency the same? (3 Marks)
Ans: .
Sum = 22 + 28 + 19 + 30 + 25 + 22 + 24 + 28 + 22 + 30 + 19 = 269
Number of values (n) = 11
Mean = Sum / n = 269 / 11 ≈ 24.45 years
The mode is the value that appears most frequently in the data set.
In this case, the number 22 appears 3 times, which is more frequent than any other value.
Mode = 22
Median
The median is the middle value when the data set is arranged in ascending order.
Arranging the ages in ascending order:19, 19, 22, 22, 22, 24, 25, 28, 28, 30, 30
Since there are 11 values, the middle value (6th position) is 24.
Median = 24
No, the mean (24.45), mode (22), and median (24) are not the same in this case. They are different measures of central tendency that give different insights into the data set.
Mean gives the average age of the players.
Mode shows the most frequent age among the players.
Median represents the middle age when arranged in order.
Q10: Following is the choice of sweets of 30 students of class VI: Ladoo, Barfi, Ladoo, Jalebi, Ladoo, Rasgulla, Jalebi, Ladoo, Barfi, Rasgulla, Ladoo, Jalebi, Jalebi, Rasgulla, Ladoo, Rasgulla, Jalebi, Ladoo, Rasgulla, Ladoo, Rasgulla, Jalebi, Ladoo, Rasgulla, Ladoo, Ladoo, Barfi, Rasgulla. Rasgulla, Ladoo. (3 Marks)
(i) Arrange the names of sweets in a table using tally marks.
(ii) Which sweet is preferred by most of the students?
Ans:
| Sweets | Tally Marks | Frequency |
| Ladoo |   || || | 12 |
| Barfi | ||| | 3 |
| Jalebi |  | | | 6 |
| Rasgulla |  |||| |||| | 9 |
(ii) Ladoo is preferred by most of the students, 12 students.
Q11: The bar graph below shows the number of cars sold by a dealership during five consecutive years.(3 Marks)
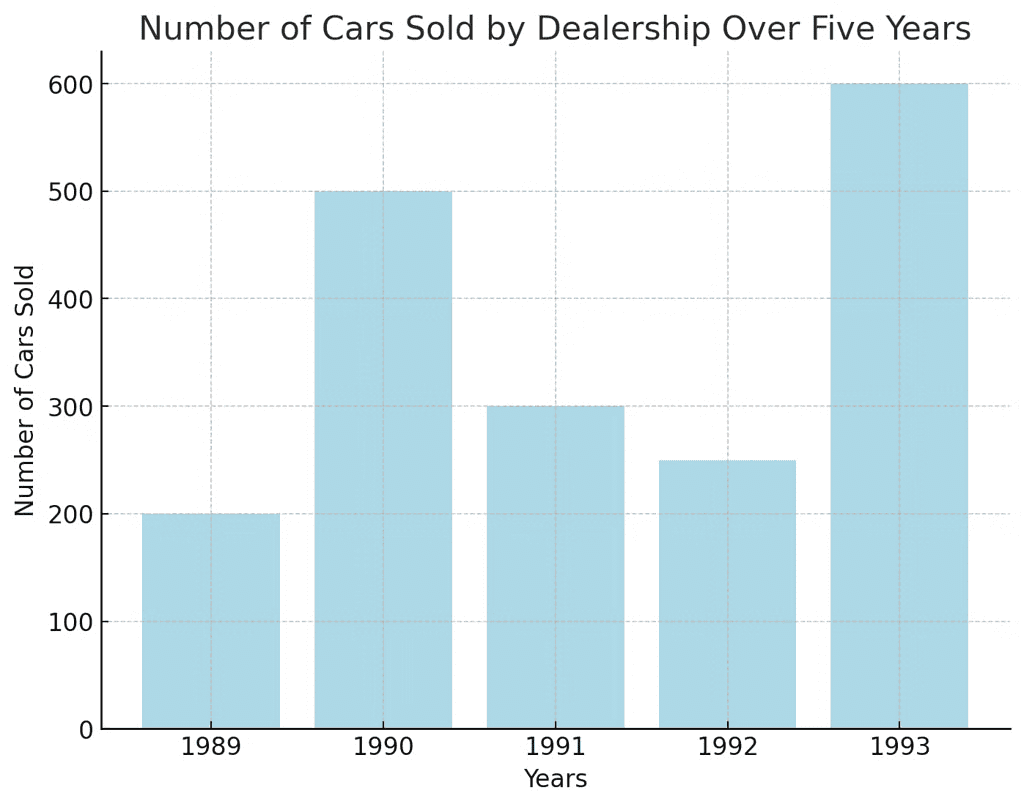
(i) How many cars were sold in 1989, 1990, and 1992?
(ii) In which year were around 450 cars sold? About 250 cars sold?
(iii) In which years were fewer than 300 cars sold?
(iv) Explain how you would estimate the number of cars sold in 1989 based on the graph.
Ans:
(i) Based on the graph:
- In 1989, around 200 cars were sold.
- In 1990, around 500 cars were sold.
- In 1992, around 250 cars were sold.
(ii)About 450 cars were sold in 1991.
About 250 cars were sold in 1992.
(iii) Fewer than 300 cars were sold in 1989 and 1992.
(iv) Estimating the number of cars sold in 1989:
Looking at the bar corresponding to 1989, the top of the bar reaches the 200 mark on the y-axis. Since the scale indicates that 1 unit = 100 cars, we can estimate that approximately 200 cars were sold in 1989.
Q12: The weights of new born babies (in kg) in a hospital on a particular day are as follows: (5 Marks)
2.3, 2.2, 2.1, 2.7, 2.6, 3.0, 2.5, 2.9, 2.8, 3.1, 2.5, 2.8, 2.7, 2.9, 2.4
(i) Rearrange the weights in descending order.
(ii) Determine the highest weight.
(iii) Determine the lowest weight.
(iv) Determine the range.
(v) How many babies were born on that day?
(vi) How many babies weigh below 2.5 kg?
(vii) How many babies weigh more than 2.8?
(viii) How many babies weigh 2.8 kg?
Ans:
(i) Weights in descending order:
3.1, 3.0, 2.9, 2.9, 2.8, 2.8, 2.7, 2.7, 2.6, 2.5, 2.5, 2.4, 2.3, 2.2, 2.1
(ii) Highest weight: 3.1 Kg.
(iii) Lowest weight: 2.1 Kg.
(iv) Range = Maximum observation – Minimum observation
= (3.1-2.1) kg
= 1.0 Kg.
(v) A total of 15 babies were born on that day.
(vi) 4 babies weigh below 2.5 kg.
(vii) 4 babies weigh more than 2.8 kg.
(viii) 2 babies weigh 2.8 kg.
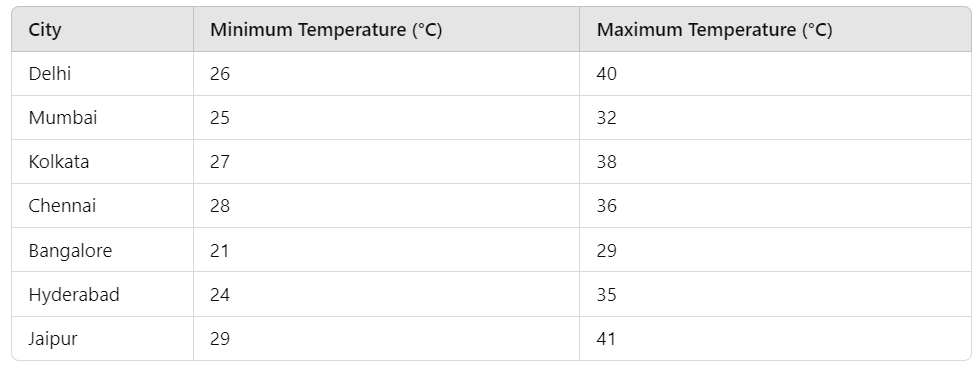
Q13: The following table provides the minimum and maximum temperatures of various cities on a specific date: (5 Marks)
 Answer the following questions
(i) Which city has the largest difference in the minimum and maximum temperature on the given date?
(ii) Which is the hottest city and which is the coldest city?
(iii) Name two cities where the maximum temperature of one was less than the minimum temperature of the other.
(iv) Name the city which has the least difference between its minimum and maximum temperature.
Ans:
Let’s plot the double bar graph for the given data.
Double Bar Graph: Minimum and Maximum Temperatures of Various Cities
Let me generate the double bar graph for you.
Minimum and Maximum Temperatures of Various Cities
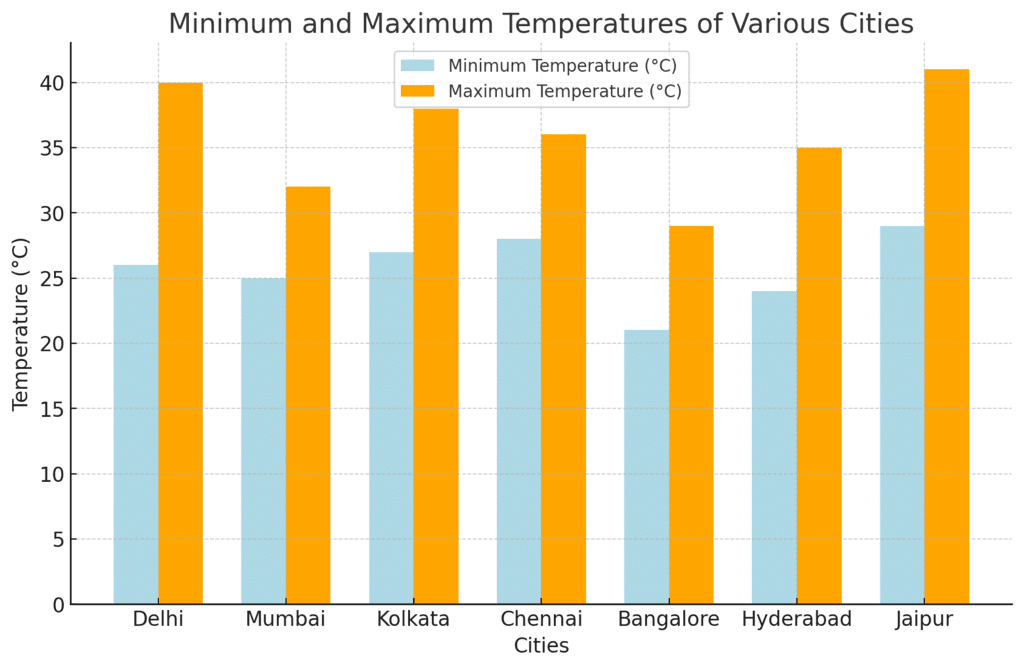
Here is the double bar graph representing the minimum and maximum temperatures of various cities.
(i) City with the largest temperature difference:
By observing the graph, we can conclude that Jaipur has the largest difference between its minimum (29°C) and maximum temperature (41°C), which is 12°C.
(ii) Hottest and Coldest City:
- Hottest City: Jaipur (Maximum temperature of 41°C).
- Coldest City: Bangalore (Minimum temperature of 21°C).
(iii) Two cities where the maximum temperature of one is less than the minimum temperature of the other:
- Bangalore (Maximum temperature of 29°C) and Jaipur (Minimum temperature of 29°C).
- Bangalore (Maximum temperature of 29°C) and Delhi (Minimum temperature of 26°C).
(iv) City with the least difference between minimum and maximum temperature:
Mumbai has the least difference, with a minimum of 25°C and a maximum of 32°C, a difference of only 7°C.


