Unit Test (Solutions): Data Handling | Mathematics (Maths) Class 8 PDF Download

Time: 1 hour
M.M.: 30
Attempt all questions.
Question numbers 1 to 5 carry 1 mark each.
Question numbers 6 to 8 carry 2 marks each.
Question numbers 9 to 11 carry 3 marks each.
Question numbers 12 & 13 carry 5 marks each.
Q1: In the class interval 5-10, find the (1 Mark)
(i) lower limit
(ii) upper limit
(iii) class mark
(iv) class size
Ans:
(i) lower limit = 5
(ii) upper limit = 10
(iii) Class mark = 5+ (iv) Class size = 10 – 5 = 5
Q2: A group of 20 students recorded their heights (in cm). The data received were as given below. What is the range?
150, 120, 112, 160, 155, 151, 158, 142, 148, 149, 161, 165, 140, 157, 156, 146, 148, 153, 138, 135 (1 Mark)
Ans:
The minimum height =112 cm
Maximum height = 165 cm
Range = Maximum height – Minimum height = 165 cm – 112 cm = 53 cm
Q3: The monthly salary of an average person is Rs. 15,000. The central angle of the given sector representing his expenses on food and house rent on a pie chart is 60°. The amount he spends on his food and house rent is (1 Mark)
(i) Rs. 5000
(ii) Rs. 2500
(iii) Rs. 6000
(iv) Rs. 9000
Ans: (ii)
The part of the monthly salary spent on food and house rent = 60°/360°
The amount he spends on his food and house rent is = (60°/360°) × 15000= Rs. 2500
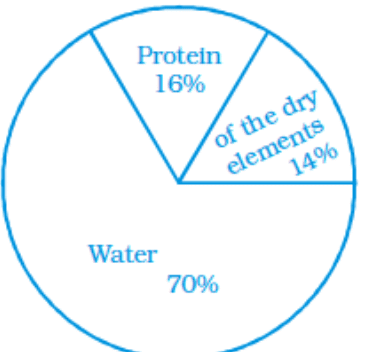
Q4: The pie chart given below shows the distribution of constituentsin the human body. The central angle of the given sector showing thedistribution of protein and other constituents is (1 Mark)
(i) 108°
(ii) 54°
(iii) 30°
(iv) 216°
Ans:(i)
The pie chart given above shows us the distribution of constituents
in the human body = 16% + 14% = 30%
= (30/100) × 360v
= 108°
Q 5: What is the central angle of the given sector (in the above pie chart) representing skin and bones together? (1 Mark)
(i) 36° (ii) 60° (iii) 90° (iv) 96°
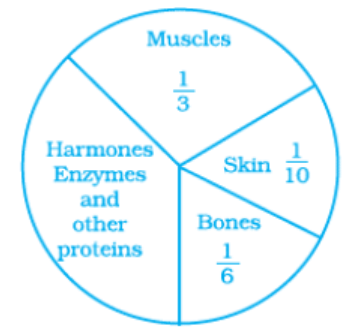 Ans: (iv)
Distribution of protein in the skin = 1/10
Distribution of protein in the bones = 1/6
The central angle of the sector represents skin and bones,
= 1/10 + 1/6
= (3 + 5)/30
= 8/30 × 360°
= 96°
Q6: If you have a spinning wheel with 3 green sectors, 1 blue sector and 1 red sector, what is the probability of getting a green sector? What is the probability of getting a non-blue sector? (2 Marks)
Ans: A total of five sectors are present. Out of the five sectors, three sectors are green.
Therefore, the probability of getting a green sector = ⅗
Out of the five sectors, one sector is blue.
Hence, Number of Non-blue sectors = 5 – 1 = 4 sectors
Therefore, the probability of getting a non-blue sector will be equal to 4/5.
Q7: When a die is thrown, list the outcomes of an event of getting: (2 Marks)
(i) (a) a prime number (b) not a prime number
(ii) (a) a number greater than 5 (b) a number not greater than 5.
Ans:
(i) (a) Outcomes of the event to get a prime number are 2, 3 and 5. (b) Outcomes of an event of not getting a prime number are 1, 4 and 6.
(ii) (a) Outcomes of the event of getting a number greater than 5 are 6. (b) Outcomes of the event of not getting a number greater than 5 are 1, 2, 3, 4 and 5.
Q8: Numbers 1 to 10 are written on ten separate slips (one number on one slip), kept in a box and mixed well. One slip is chosen from the box without looking into it. What is the probability of: (2 Marks)
(i) getting a number 6?
(ii) getting a number less than 6?
(iii)getting a number greater than 6?
(iv)getting a 1-digit number?
Ans:
(i) The outcome of getting a number 6 from ten separate slips is one.
Therefore, the probability of getting a number 6 = 1/10
(ii) Numbers which are less than 6 are 1, 2, 3, 4 and 5. So total there are five numbers. Thus, there are 5 outcomes.
Therefore, the probability of getting a number less than 6 = 5/10 = ½
(iii) The number is greater than 6 out of ten that are 7, 8, 9, 10. So there are 4 possible outcomes.
Therefore, the probability of getting a number greater than 6 = 4/10 = ⅖
(iv) One digit numbers out of 1 to 10 are 1, 2, 3, 4, 5, 6, 7, 8, 9.
Therefore, the probability of getting a 1-digit number = 9/10
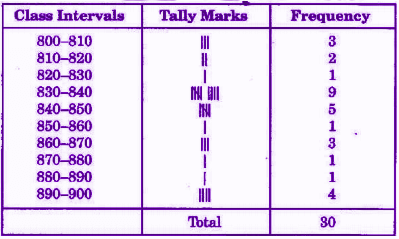
Q9: The weekly wages (in Rs.) of 30 workers in a factory are: 830, 835, 890, 810, 835, 836, 869, 845, 898, 890, 820, 860, 832, 833, 855, 845, 804, 808, 812, 840, 885, 835, 835, 836, 878, 840, 868, 890, 806, 840.Using tally marks, make a frequency table with intervals as 800 – 810, 810 – 820 and so on. (3 Marks)
Ans: The frequency table with intervals as 800 – 810, 810 – 820 and so on, using tally marks is given below:
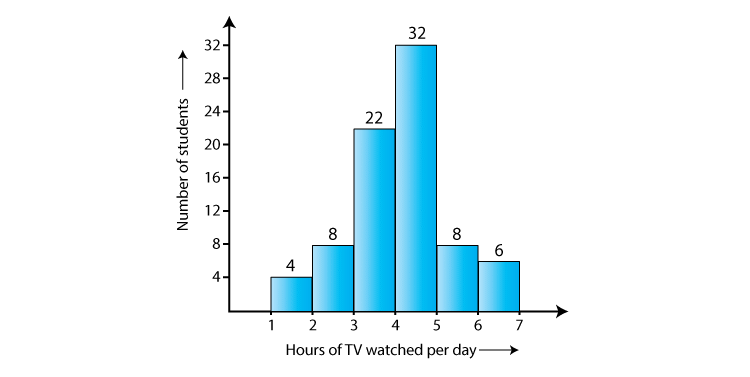
Q10: The number of hours for which students of a particular class watched television during holidays is shown through the given graph. Answer the following: (3 Marks)
(i) For how many hours did the maximum number of students watch T.V.?
(ii) How many students watched TV for less than 4 hours?
(iii) How many students spent more than 5 hours watching TV?
Ans:
(i) 32 students watched T.V for 4-5 hours.
Therefore, the maximum number of students who watched T.V. for 4 – 5 hours.
(ii) The number of students who watched T.V. less than 4 hours = 22 + 8 + 4 = 34
(iii) The number of students who spent more than 5 hours watching TV = 8 + 6 = 14
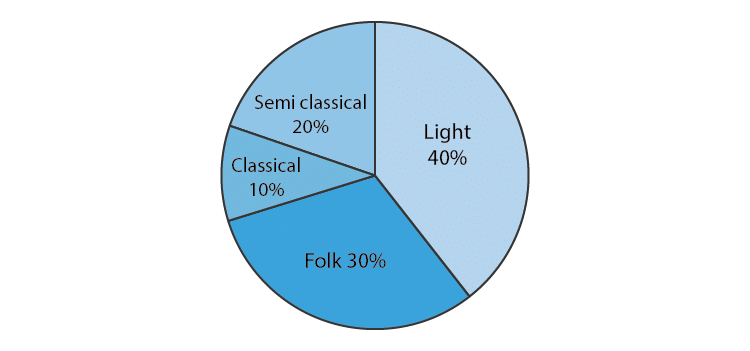
Q11: A survey was made to find the type of music that a certain group of young people liked in a city. The adjoining pie chart shows the findings of this survey. From this pie chart, answer the following: (3 Marks)
(i) If 20 people liked classical music, how many young people were surveyed?
(ii) Which type of music is liked by the maximum number of people?
(iii) If a cassette company were to make 1000 CD’s, how many of each type would they make?
Ans:
(i) 10% represents 20 people.
⟹100% represents = (100 x 20)/10 = 200
Therefore, 200 people were surveyed.
(ii) Since 40% of the total people surveyed liked light music and no other form of song liked more than that, we can conclude that the maximum number of people likes light music.
(iii) CD’s of classical music = (10 x 1000)/100 = 100
CD’s of semi-classical music = (20 x 1000)/100 = 200
CD’s of light music = (40 x 1000)/100 = 400
CD’s of folk music = (30 x 1000)/100 = 300
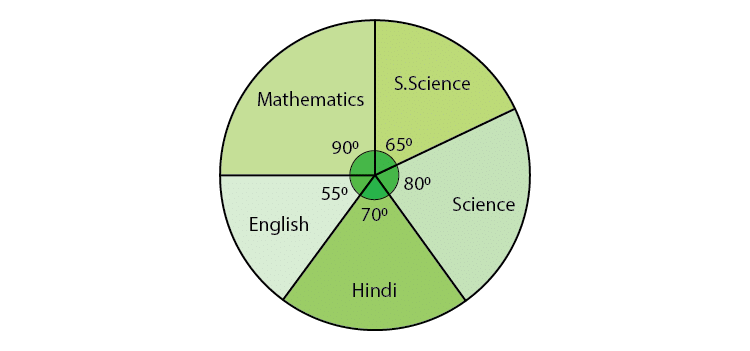
Q12: The adjoining pie chart gives the marks scored in an examination by a student in Hindi, English, Mathematics, Social Science and Science. If the total marks obtained by the students were 540, answer the following questions.(5 Marks)
(i) In which subject did the student score 105 marks?
(ii) How many more marks were obtained by the student in Mathematics than in Hindi?
(iii) Examine whether the sum of the marks obtained in Social Science and Mathematics is more than that in Science and Hindi.
Ans:
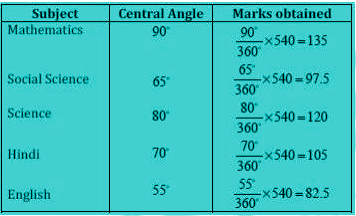
(i) The student scored 105 marks in Hindi.
(ii) Marks obtained in Mathematics = 135 Marks obtained in Hindi = 105
Difference = 135 – 105 = 30
Thus, 30 more marks were obtained by the student in Mathematics than in Hindi.
(iii) The total marks obtained in Social Science and Mathematics = 97.5 + 135 = 232.5
The total marks obtained in Science and Hindi = 120 + 105 = 225
Therefore, the sum of the marks in Social Science and Mathematics is more than that in Science and Hindi.
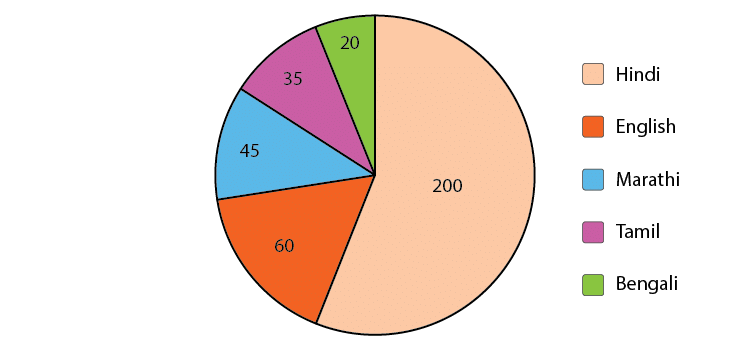
Q13: The number of students in a hostel, speaking different languages is given below. Display the data in a pie chart. (5 Marks)
| Language | Hindi | English | Marathi | Tamil | Bengali | Total |
| No. of students | 40 | 12 | 9 | 7 | 4 | 72 |
Ans:
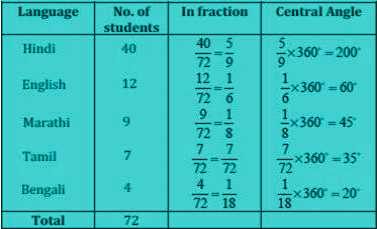
The pie-chart for the above data will be:
|
81 videos|423 docs|31 tests
|
FAQs on Unit Test (Solutions): Data Handling - Mathematics (Maths) Class 8
| 1. What are some common data handling hobbies that can improve my analytical skills? |  |
| 2. How can I start a hobby related to data handling without prior experience? | |
| 3. What tools and software are popular for data handling hobbies? | |
| 4. Can data handling hobbies lead to career opportunities? | |
| 5. What resources are available for learning data handling techniques? | |


Previous Year Questions with Solutions
,Free
,Exam
,Objective type Questions
,practice quizzes
,Unit Test (Solutions): Data Handling | Mathematics (Maths) Class 8
,mock tests for examination
,shortcuts and tricks
,ppt
,past year papers
,MCQs
,Sample Paper
,Extra Questions
,Semester Notes
,video lectures
,study material
,Viva Questions
,Unit Test (Solutions): Data Handling | Mathematics (Maths) Class 8
,Unit Test (Solutions): Data Handling | Mathematics (Maths) Class 8
,Summary
,Important questions
;


Unit Test (Solutions): Data Handling Free PDF Download
Importance of Unit Test (Solutions): Data Handling
Unit Test (Solutions): Data Handling Notes
Unit Test (Solutions): Data Handling Class 8 Questions
Study Unit Test (Solutions): Data Handling on the App
|
© EduRev
|
Education Revolution
|


|


within 7 days!