Data Acquisition Chapter Notes | Artificial Intelligence (AI) for Class 9 PDF Download
| Table of contents |
|
| Understanding Data Acquisition in the AI Project Cycle |
|
| Data Features |
|
| Understanding System Maps |
|
| Understanding the Water Cycle |
|

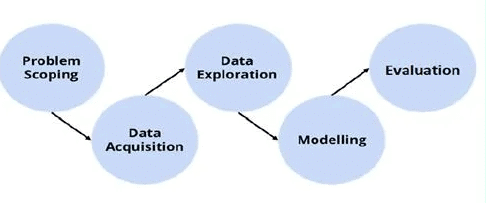
Understanding Data Acquisition in the AI Project Cycle
Data Acquisition is the second crucial element in the AI Project Cycle. This stage involves gathering the necessary data for the project. But first, let's clarify what we mean by "data." Data refers to information, facts, and statistics collected together for reference or analysis. To enable an AI project to make predictions, it must first be trained using relevant data.
For instance, consider an AI system designed to predict an employee's salary based on their previous salary history. To train this system, you would input data on the employee's past salaries. This training data is essential for the machine to learn and make accurate predictions. Once trained, the system can then predict the employee's next salary, using this training data as a foundation.
The data used for training and testing an AI model is critical for its success. The training data needs to be both relevant and authentic. Going back to the salary prediction example, if the training data consisted of the employee's expenses instead of their past salaries, the machine would struggle to make accurate predictions. Similarly, if the training data were incorrect or not genuine, the predictions would be flawed.
Therefore, for any AI project to be effective, the training data must be relevant to the problem at hand and sourced from reliable, authentic references. This ensures that the AI system learns correctly and can make accurate predictions when deployed.
Data Features
Data features are the specific types of data that you need to collect to address your problem statement. In the example of predicting salary increments, data features could include salary amount, increment percentage, increment period, and bonus.
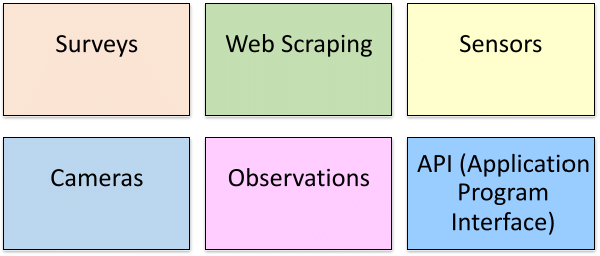
Acquiring Data from Reliable Sources
Once you have identified the data features, the next step is to determine where to collect this data from. There are various ways to acquire data, but it is crucial to ensure that the data comes from reliable and authentic sources. Some methods of data acquisition include:- Government Open Data Portals: Websites like data.gov.in and india.gov.in offer a wealth of open-sourced data collected and published by the government. This data is generally reliable and can be used for various projects.
- Research Publications and Journals: Academic papers and research articles often contain valuable data and insights that can be used for analysis. Platforms like Google Scholar can help you find such publications.
- Surveys and Questionnaires: If the required data is not available publicly, conducting surveys or distributing questionnaires can be an effective way to gather information directly from individuals.
- Data Aggregation Websites: Some websites specialize in aggregating data from various sources and making it available for public use. Ensure that these websites have a good reputation for data accuracy.
- Open-Source Data Repositories: Platforms like Kaggle, UCI Machine Learning Repository, and GitHub often host datasets contributed by users. These datasets can be useful for specific projects, but verify their credibility before use.
- Government Reports and Publications: Reports published by government agencies, such as the Census Bureau or statistical offices, can provide reliable data on various topics.
- Publicly Available Company Data: Financial reports, press releases, and other publicly available information from companies can be a source of data, especially for business-related projects.
- Social Media and Online Platforms: Data from social media platforms or online forums can be valuable, but ensure that you comply with privacy policies and regulations when collecting such data.
Caution: Avoid using data from random websites on the internet, as the accuracy and authenticity of such data cannot be guaranteed. Always respect data ownership and privacy regulations while collecting data.
Understanding System Maps
System maps are powerful tools used to comprehend complex issues involving multiple interrelated factors. In any system, every element is connected, and a system map aims to visually represent these connections using arrows.
Key Features of System Maps
- Interconnectedness: Every element in a system is linked to others, and these relationships are depicted through arrows in the map.
- Identification of Loops: Loops in a system map are crucial as they illustrate specific chains of causes and effects. A system comprises several such chains, each playing a vital role in understanding the overall dynamics.
- Time Delays: The length of arrows in a system map indicates the time required for a change to occur, known as a time delay. Longer arrows signify longer delays in the impact of one element on another.
- Changing System Outcomes: To alter the outcome of a system, change makers have two options: modifying the elements within the system or altering the relationships between these elements. Typically, changing the relationships is more effective in bringing about significant changes.
- Nature of Relationships: The use of ‘+’ and ‘-’ signs in a system map indicates the nature of the relationship between elements. A ‘+’ sign signifies a positive relationship, while a ‘-’ sign indicates a negative relationship.
Application of System Maps
System maps provide a clear depiction of the components and boundaries of a system, along with the elements of the surrounding environment at a specific moment in time. By using system maps, one can easily define and understand the relationships among different elements within a system.
Example: Salary Prediction System
To illustrate this concept, let's consider a salary prediction system as an example. In this system, the goal is to predict future salaries based on various data features. The data features, such as current salary increments, play a crucial role in determining the system's outcome. For instance, if a person receives a 200% salary increment in a month, this significant change in their current salary will directly impact the prediction of their future salary. The system would predict a higher future salary based on the substantial present increment.
Understanding the Water Cycle
The Water Cycle is a fundamental concept that describes how water continuously moves and changes form in nature. It involves various elements that play a role in this cycle.
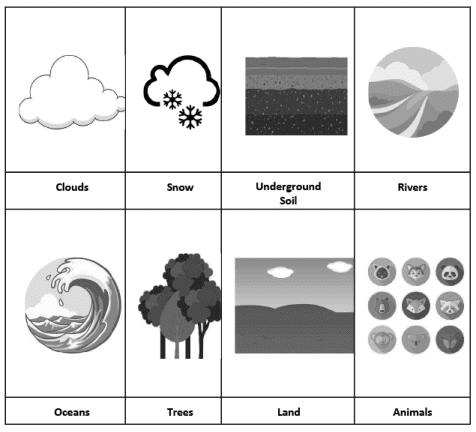
Key Elements of the Water Cycle
- Clouds: Formed by the condensation of water vapor, clouds are a crucial part of the water cycle. They hold freshwater that eventually falls back to the earth as precipitation.
- Snow: Snow is a form of precipitation that occurs when temperatures are low. It contributes to the water cycle by adding freshwater to the land when it melts.
- Underground Water: Water that seeps into the ground replenishes aquifers and contributes to the water cycle. This underground water can eventually resurface through springs or be taken up by plants.
- Soil: Soil plays a vital role in the water cycle by absorbing water, which is then used by plants or evaporates back into the atmosphere.
- Rivers: Rivers are a major pathway for water, transporting it from one place to another. They are fed by rainfall, melting snow, and underground water.
- Oceans: Covering a significant portion of the Earth, oceans are the largest source of water vapor. Water from the ocean evaporates, contributing to the formation of clouds.
- Trees: Trees contribute to the water cycle through a process called transpiration, where they release water vapor into the atmosphere. This water vapor eventually contributes to cloud formation.
- Land: Different types of land (forests, deserts, mountains) affect how water is absorbed and released into the atmosphere.
- Animals: Animals also play a role in the water cycle through respiration and excretion, releasing water back into the environment.
Building a System Map for the Water Cycle
A System Map visually represents the cause-and-effect relationships between the elements of the water cycle. Each element is placed in a circle, and arrows show how they are connected.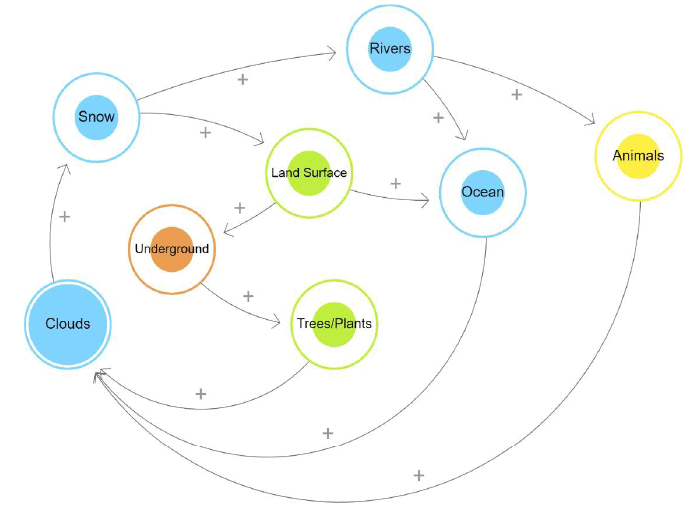
Relationship Indicators
- Positive Relationship (+): Indicates that if one element increases, the other does too. For example, if the temperature increases, evaporation from oceans increases, leading to more cloud formation.
- Negative Relationship (−): Indicates that if one element increases, the other decreases. For example, if soil moisture increases, the need for irrigation decreases.
|
32 videos|57 docs
|
FAQs on Data Acquisition Chapter Notes - Artificial Intelligence (AI) for Class 9
| 1. What is data acquisition in the context of AI projects? |  |
| 2. What are data features and why are they important? | |
| 3. How can system maps be used in data acquisition? | |
| 4. What is the significance of understanding the water cycle in data acquisition? | |
| 5. What challenges might one face during data acquisition in AI projects? | |


Semester Notes
,Sample Paper
,Viva Questions
,Data Acquisition Chapter Notes | Artificial Intelligence (AI) for Class 9
,Extra Questions
,shortcuts and tricks
,Exam
,Important questions
,Data Acquisition Chapter Notes | Artificial Intelligence (AI) for Class 9
,Objective type Questions
,Free
,Data Acquisition Chapter Notes | Artificial Intelligence (AI) for Class 9
,Summary
,MCQs
,Previous Year Questions with Solutions
,practice quizzes
,study material
,past year papers
,video lectures
,ppt
,mock tests for examination
,


Chapter Notes: Data Acquisition Free PDF Download
Importance of Chapter Notes: Data Acquisition
Chapter Notes: Data Acquisition
Chapter Notes: Data Acquisition Class 9 Questions
Study Chapter Notes: Data Acquisition on the App
|
© EduRev
|
Education Revolution
|


|


within 7 days!