
Best Study Material for CUET Commerce Exam
CUET Commerce Exam > CUET Commerce Notes > General Test Preparation for CUET UG > Concept & Solved Questions: Venn Diagram
Concept & Solved Questions: Venn Diagram | General Test Preparation for CUET UG - CUET Commerce PDF Download
| Table of contents |
|
| What is a Venn Diagram? |
|
| Formulas |
|
| Venn Diagram in case of two elements |
|
| Venn Diagram in case of three elements |
|
| Solved Examples: |
|
| Key Learnings |
|
What is a Venn Diagram?
Venn diagram, also known as an Euler-Venn diagram, is a simple representation of sets by diagrams. The usual depiction makes use of a rectangle as the universal set and circles for the sets under consideration.Venn diagrams are essential tools for the CUET UG exam's Logical Reasoning section. They simplify complex problems and are applicable across various topics like set theory and probability.
Formulas
Let's take a look at some basic formulas for Venn diagrams of two and three elements
n ( A ∪ B) = n (A) + n (B) - n (A ∩ B)
n ( A ∪ B) = n (A) + n (B) - n (A ∩ B)
n (A ∪ B ∪ C) = n(A) + n (B) + n (C) - n (A ∩ B) - n (B ∩ C) - n (C ∩ A) + n (A ∩ B ∩ C)
where n(A) = number of elements in set A.
Venn Diagram in case of two elements

Where;
X = number of elements that belong to set A only
Y = number of elements that belong to set B only
Z = number of elements that belong to sets A and B both (AB)
W = number of elements that belong to none of the sets A or B
From the above figure, it is clear that
n(A) = x + z ;
n (B) = y + z ;
n(A ∩ B) = z ;
n (A ∪ B) = x + y + z.
Total number of elements = x + y + z + w
Venn Diagram in case of three elements

Where,
W = number of elements that belong to none of the sets A, B or C
Tip: Always start filling values in the Venn diagram from the innermost value.
 |
Download the notes
Concept & Solved Questions: Venn Diagram
|
Download as PDF |
Download as PDF
Solved Examples:
Example 1: In a college, 200 students are randomly selected. 140 like tea, 120 like coffee, and 80 like both tea and coffee.
Q1. How many students like only tea?
Q2. How many students like only coffee?
Q3. How many students like neither tea nor coffee?
Q4. How many students like only one of tea or coffee?
Q5. How many students like at least one of the beverages?
Solution: The given information may be represented by the following Venn diagram, where T = tea and C = coffee.
 • Number of students who like only tea = 60
• Number of students who like only coffee = 40
• Number of students who like neither tea nor coffee = 20
• Number of students who like only one of tea or coffee = 60 + 40 = 100
• Number of students who like at least one of tea or coffee = n (only Tea) + n (only coffee) + n (both Tea & coffee) = 60 + 40 + 80 = 180
Example 2: In a survey of 500 students at a college, it was found that 49% liked watching football, 53% liked watching hockey, and 62% liked watching basketball. Also, 27% liked watching football and hockey both, 29% liked watching basketball and hockey both, and 28% liked watching football and basketball both. 5% liked watching none of these games.
Q1. How many students like watching all three games?
Q2. Find the ratio of the number of students who like watching only football to those who like watching only hockey.
Q3. Find the number of students who like watching only one of the three given games.
Q4. Find the number of students who like watching at least two of the given games.
Solution:
n(F) = percentage of students who like watching football = 49%
n(H) = percentage of students who like watching hockey = 53%
n(B) = percentage of students who like watching basketball = 62%
n ( F ∩ H) = 27% ; n (B ∩ H) = 29% ; n (F ∩ B) = 28%
Since 5% like watching none of the given games, so n (F ∪ H ∪ B) = 95%.
Now applying the basic formula,
95% = 49% + 53% + 62% -27% - 29% - 28% + n (F ∩ H ∩ B)
Solving, you get n (F ∩ H ∩ B) = 15%.
Now, make the Venn diagram as per the information given.
Note: All values in the given Venn diagram are in percentage.
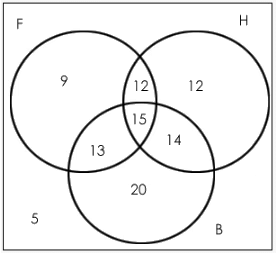
Number of students who like watching all three games = 15% of 500 = 75.
Ratio of the number of students who like only football to those who like only hockey = (9% of 500)/(12% of 500) = 9/12 = 3:4.
The number of students who like watching only one of the three given games = (9% + 12% + 20%) of 500 = 205
The number of students who like watching at least two of the given games = (number of students who like watching only two of the games) + (number of students who like watching all three games) = (12 + 13 + 14 + 15)%, i.e., 54% of 500 = 270.
Since 5% like watching none of the given games, so n (F ∪ H ∪ B) = 95%.
Now applying the basic formula,
95% = 49% + 53% + 62% -27% - 29% - 28% + n (F ∩ H ∩ B)
Solving, you get n (F ∩ H ∩ B) = 15%.
Now, make the Venn diagram as per the information given.
Note: All values in the given Venn diagram are in percentage.
Number of students who like watching all three games = 15% of 500 = 75.
Ratio of the number of students who like only football to those who like only hockey = (9% of 500)/(12% of 500) = 9/12 = 3:4.
The number of students who like watching only one of the three given games = (9% + 12% + 20%) of 500 = 205
The number of students who like watching at least two of the given games = (number of students who like watching only two of the games) + (number of students who like watching all three games) = (12 + 13 + 14 + 15)%, i.e., 54% of 500 = 270.
Example 3:
Directions for the question: Read the information given below and answer the question that follows.
Applicants for the doctoral programmes of Ambi Institute of Engineering (AIE) and Bambi Institute of Engineering (BIE) have to appear for a Common Entrance Test (CET). The test has three sections: Physics (P), Chemistry (C), and Maths (M). Among those appearing for CET, those at or above the 80th percentile in at least two sections and at or above the 90th percentile overall, are selected for Advanced Entrance Test (AET) conducted by AIE. AET is used by AIE for final selection. For the 200 candidates who are at or above the 90th percentile overall based on CET, the following are known about their performance in CET:
1. No one is below the 80th percentile in all 3 sections.
2. 150 are at or above the 80th percentile in exactly two sections.
3. The number of candidates at or above the 80th percentile in P is the same as the number of candidates at or above the 80th percentile only in C. The same is the number of candidates at or above the 80th percentile only in M.
4. Number of candidates below 80th percentile in P: Number of candidates below 80th percentile in C: Number of candidates below 80th percentile in M = 4:2:1.
BIE uses a different process for selection. If any candidate is appearing in the AET by AIE, BIE considers their AET score for final selection provided the candidate is at or above the 80th percentile in P. Any other candidate at or above the 80th percentile in P in CET, but who is not eligible for the AET, is required to appear in a separate test to be conducted by BIE for being considered for final selection. Altogether, there are 400 candidates this year who are at or above the 80th percentile in P.
 Question 1: What best can be concluded about the number of candidates sitting for the separate test for BIE who were at or above the 90th percentile overall in CET?
Answer: The number of candidates sitting for a separate test for BIE who were at or above the 90th percentile in CET (a) is either 3 or 10.
Question 2: If the number of candidates who are at or above the 90th percentile overall and also at or above the 80th percentile in all three sections in CET is actually a multiple of 5, what is the number of candidates who are at or above the 90th percentile overall and at or above the 80th percentile in both P and M in CET?
Answer: From the given condition, g is a multiple of 5. Hence, g = 20. The number of candidates at or above 90th percentile overall and at or above 80th percentile in both P and M = e + g = 60.
Question 3: If the number of candidates who are at or above the 90th percentile overall and also at or above the 80th percentile in all three sections in CET is actually a multiple of 5, then how many candidates were shortlisted for the AET for AIE?
Answer: In this case, g = 20. Number of candidates shortlisted for AET = d + e + f + g = 10 + 40 + 100 + 20 = 170
Question 4: If the number of candidates who are at or above the 90th percentile overall and also are at or above the 80th percentile in P in CET, is more than 100, how many candidates had to sit for the separate test for BIE?
Answer: From the given condition, the number of candidates at or above 90th percentile overall and at or above 80th percentile in P in CET = 104. The number of candidates who have to sit for a separate test = 296 + 3 = 299.
Another type of question asked from this topic is based on maxima and minima. We have discussed this type in the other article.
It is given that 200 candidates scored above the 90th percentile overall in CET. Let the following Venn diagram represent the number of persons who scored above 80 percentile in CET in each of the three sections:
From 1, h = 0.
From 2, d + e + f = 150
From 3, a = b = c
Since there are a total of 200 candidates, 3a + g = 200 – 150 = 50
From 4, (2a + f) : (2a + e) : (2a + d) = 4 : 2 : 1
Therefore, 6a + (d + e + f) is divisible by 4 + 2 + 1 = 7.
Since d + e + f = 150, 6a + 150 is divisible by 7, i.e., 6a + 3 is divisible by 7. Hence, a = 3, 10, 17,...
Further, since 3a + g = 50, a must be less than 17. Therefore, only two cases are possible for the value of a, i.e., 3 or 10.
We can calculate the values of the other variables for the two cases.
a = 3 or 10
d = 18 or 10
e = 42 or 40
f = 90 or 100
g = 41 or 20
Among the candidates who are at or above 90th percentile, the candidates who are at or above 80th percentile in at least two sections are selected for AET. Hence, the candidates represented by d, e, f, and g are selected for AET. BIE will consider the candidates who are appearing for AET and are at or above the 80th percentile in P. Hence, BIE will consider the candidates represented by d, e, and g, which can be 104 or 80. BIE will conduct a separate test for the other students who are at or above the 80th percentile in P. Given that there are a total of 400 candidates at or above 80th percentile in P, and since there are 104 or 80 candidates at or above 80th percentile in P and are at or above 90th percentile overall, there must be 296 or 320 candidates at or above 80th percentile in P who scored less than 90th percentile overall.
 |
Take a Practice Test
Test yourself on topics from CUET Commerce exam
|
Practice Now |
Practice Now
Key Learnings
• It is important to carefully list the conditions given in the question in the form of a Venn diagram.
• While solving such questions, avoid taking many variables.
• Try solving the questions using the Venn diagram approach and not with the help of formulae.
The document Concept & Solved Questions: Venn Diagram | General Test Preparation for CUET UG - CUET Commerce is a part of the CUET Commerce Course General Test Preparation for CUET UG.
All you need of CUET Commerce at this link: CUET Commerce
|
164 videos|603 docs|945 tests
|


FAQs on Concept & Solved Questions: Venn Diagram - General Test Preparation for CUET UG - CUET Commerce
| 1. What is a Venn Diagram used for? |  |
| 2. How do you construct a Venn Diagram for two elements? | |
Ans. To construct a Venn Diagram for two elements, draw two overlapping circles. Label each circle with the name of the corresponding set. The overlapping area represents the elements common to both sets, while the non-overlapping parts represent the unique elements of each set.
| 3. Can you explain how to create a Venn Diagram for three elements? | |
Ans. To create a Venn Diagram for three elements, draw three overlapping circles. Each circle represents one set. The areas where the circles overlap represent the intersections of the sets. There will be regions indicating unique elements for each set and various combinations of intersections (e.g., elements common to two sets or all three).
| 4. What are some common applications of Venn Diagrams? | |
Ans. Venn Diagrams are commonly used in mathematics, statistics, logic, and education. They help in comparing and contrasting different groups, visualizing set operations, and solving problems related to probability and logic.
| 5. How can Venn Diagrams help in problem-solving? | |
Ans. Venn Diagrams help in problem-solving by providing a clear visual representation of the relationships between sets. They allow individuals to quickly identify commonalities and differences, which can simplify complex problems and lead to more effective solutions.
Related Exams
About this Document

4.82/5
Rating

Apr 10, 2025
Last updated
Document Description: Concept & Solved Questions: Venn Diagram for CUET Commerce 2025 is part of General Test Preparation for CUET UG preparation.
The notes and questions for Concept & Solved Questions: Venn Diagram have been prepared according to the CUET Commerce exam syllabus. Information about Concept & Solved Questions: Venn Diagram covers topics
like What is a Venn Diagram? , Formulas, Venn Diagram in case of two elements, Venn Diagram in case of three elements, Solved Examples:, Key Learnings and Concept & Solved Questions: Venn Diagram Example, for CUET Commerce 2025 Exam. Find important definitions, questions, notes, meanings, examples, exercises and tests below for Concept & Solved Questions: Venn Diagram.
Introduction of Concept & Solved Questions: Venn Diagram in English is available as part of our General Test Preparation for CUET UG
for CUET Commerce & Concept & Solved Questions: Venn Diagram in Hindi for General Test Preparation for CUET UG course.
Download more important topics related with notes, lectures and mock test series for CUET Commerce
Exam by signing up for free. CUET Commerce: Concept & Solved Questions: Venn Diagram | General Test Preparation for CUET UG - CUET Commerce
Description
Full syllabus notes, lecture & questions for Concept & Solved Questions: Venn Diagram | General Test Preparation for CUET UG - CUET Commerce - CUET Commerce | Plus excerises question with solution to help you revise complete syllabus for General Test Preparation for CUET UG | Best notes, free PDF download
Information about Concept & Solved Questions: Venn Diagram
In this doc you can find the meaning of Concept & Solved Questions: Venn Diagram defined & explained in the simplest way possible. Besides explaining types of
Concept & Solved Questions: Venn Diagram theory, EduRev gives you an ample number of questions to practice Concept & Solved Questions: Venn Diagram tests, examples and also practice CUET Commerce
tests
|
164 videos|603 docs|945 tests
|
Download as PDF

Related Searches
practice quizzes
,Concept & Solved Questions: Venn Diagram | General Test Preparation for CUET UG - CUET Commerce
,Semester Notes
,MCQs
,Summary
,Concept & Solved Questions: Venn Diagram | General Test Preparation for CUET UG - CUET Commerce
,study material
,Viva Questions
,Previous Year Questions with Solutions
,mock tests for examination
,ppt
,Sample Paper
,Free
,video lectures
,Exam
,Concept & Solved Questions: Venn Diagram | General Test Preparation for CUET UG - CUET Commerce
,Objective type Questions
,Extra Questions
,past year papers
,shortcuts and tricks
,Important questions
;


Additional Information about Concept & Solved Questions: Venn Diagram for CUET Commerce Preparation
Concept & Solved Questions: Venn Diagram Free PDF Download
The Concept & Solved Questions: Venn Diagram is an invaluable resource that delves deep into the core of the CUET Commerce exam.
These study notes are curated by experts and cover all the essential topics and concepts, making your preparation more efficient and effective.
With the help of these notes, you can grasp complex subjects quickly, revise important points easily,
and reinforce your understanding of key concepts. The study notes are presented in a concise and easy-to-understand manner,
allowing you to optimize your learning process. Whether you're looking for best-recommended books, sample papers, study material,
or toppers' notes, this PDF has got you covered. Download the Concept & Solved Questions: Venn Diagram now and kickstart your journey towards success in the CUET Commerce exam.
Importance of Concept & Solved Questions: Venn Diagram
The importance of Concept & Solved Questions: Venn Diagram cannot be overstated, especially for CUET Commerce aspirants.
This document holds the key to success in the CUET Commerce exam.
It offers a detailed understanding of the concept, providing invaluable insights into the topic.
By knowing the concepts well in advance, students can plan their preparation effectively.
Utilize this indispensable guide for a well-rounded preparation and achieve your desired results.
Concept & Solved Questions: Venn Diagram Notes
Concept & Solved Questions: Venn Diagram Notes offer in-depth insights into the specific topic to help you master it with ease.
This comprehensive document covers all aspects related to Concept & Solved Questions: Venn Diagram.
It includes detailed information about the exam syllabus, recommended books, and study materials for a well-rounded preparation.
Practice papers and question papers enable you to assess your progress effectively.
Additionally, the paper analysis provides valuable tips for tackling the exam strategically.
Access to Toppers' notes gives you an edge in understanding complex concepts.
Whether you're a beginner or aiming for advanced proficiency, Concept & Solved Questions: Venn Diagram Notes on EduRev are your ultimate resource for success.
Concept & Solved Questions: Venn Diagram CUET Commerce
The "Concept & Solved Questions: Venn Diagram CUET Commerce Questions" guide is a valuable resource for all aspiring students preparing for the
CUET Commerce exam. It focuses on providing a wide range of practice questions to help students gauge
their understanding of the exam topics. These questions cover the entire syllabus, ensuring comprehensive preparation.
The guide includes previous years' question papers for students to familiarize themselves with the exam's format and difficulty level.
Additionally, it offers subject-specific question banks, allowing students to focus on weak areas and improve their performance.
Study Concept & Solved Questions: Venn Diagram on the App
Students of CUET Commerce can study Concept & Solved Questions: Venn Diagram alongwith tests & analysis from the EduRev app,
which will help them while preparing for their exam. Apart from the Concept & Solved Questions: Venn Diagram,
students can also utilize the EduRev App for other study materials such as previous year question papers, syllabus, important questions, etc.
The EduRev App will make your learning easier as you can access it from anywhere you want.
The content of Concept & Solved Questions: Venn Diagram is prepared as per the latest CUET Commerce syllabus.
|
© EduRev
|
Education Revolution
|


|


Signup on EduRev and stay on top of your study goals
10M+ students crushing their study goals daily