Everyday Mathematics: Data Handling | Mathematics Olympiad for Class 3 PDF Download

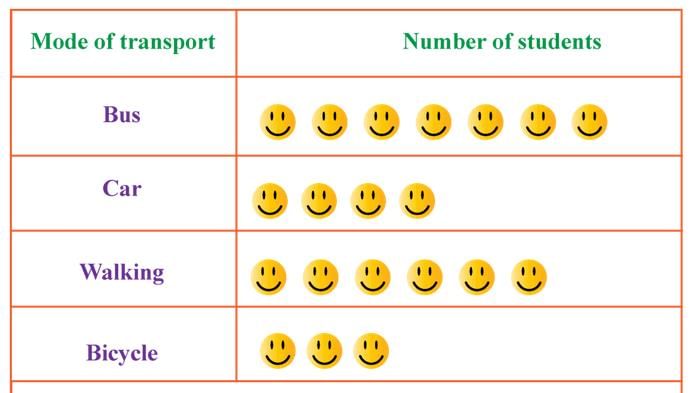
Q1. In a pictograph, each smiley represents 5 children. If there are 4 smileys in a car, how many children are there?
(a) 10
(b) 15
(c) 20
(d) 25
Ans: (c) 20
Each smiley = 5 children. With 4 smileys: 4 × 5 = 20 children.
Q2. A bar graph shows 3 kids like dogs, 5 like cats, and 2 like birds. Who likes the most popular pet?
(a) Kids who like dogs
(b) Kids who like cats
(c) Kids who like birds
(d) All like the same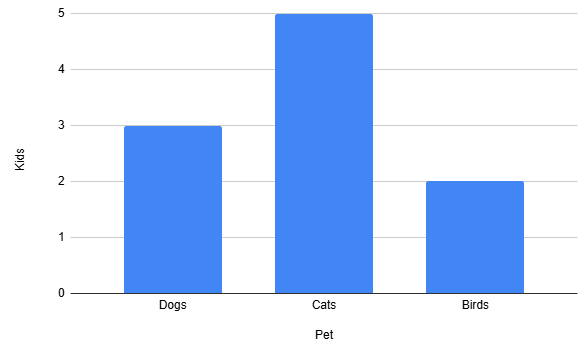
Ans: (b) Kids who like cats
The tallest bar represents the highest number. Here, 5 (cats) is more than 3 (dogs) or 2 (birds).
Q3. A pictograph shows 3 Trees for Apple and 5 trees for Guava. If each tree represents 10 trees, how many trees were there for Peach?
(a) 5
(b) 40
(c) 35
(d) 20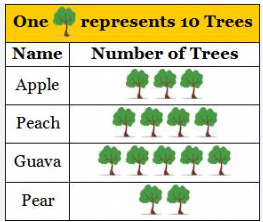
Ans: (b) 40
Each tree = 10
For Peach, there are 4 trees i.e., 4 ×10 = 40 trees.
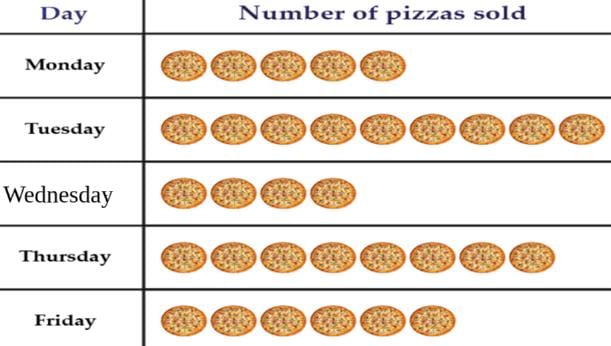
Q4. Jake recorded the number of pizzas sold for five days. Which day sold the fewest pizzas?
(a) Friday
(b) Wednesday
(c) Tuesday
(d) Monday
 Ans: (b) Wednesday
In the pictograph, each pizza picture represents the number of pizzas sold on each day. To find which day had the fewest pizzas sold, we count the pizza pictures for each day:
- Monday → 5 pizzas
- Tuesday → 6 pizzas
- Wednesday → 4 pizzas
- Thursday → 4 pizzas
- Friday → 5 pizzas
Since Wednesday has the least number of pizzas (only ), the correct answer is Wednesday.
Q5. A bar graph shows toys sold: 4 dolls, 6 cars, and 5 balls. How many more cars than dolls were sold?
(a) 1
(b) 2
(c) 3
(d) 4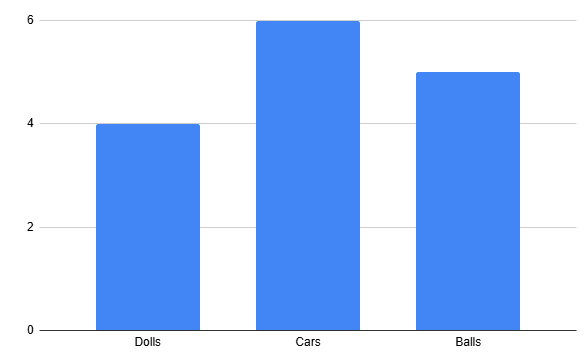
Ans: (b) 2
- Cars: 6
- Dolls: 4
- Difference: 6 - 4 = 2
Q6. In a pictograph, if one smiley face means 2 cookies, what does 3 smiley faces mean?
(a) 2 cookies
(b) 4 cookies
(c) 6 cookies
(d) 8 cookies
Ans: (c) 6 cookies
Each smiley face represents 2 cookies. For 3 smiley faces: 3 × 2 = 6 cookies, similar to the apple pictograph (1 apple = 10) in the notes.
Q7. A bar graph shows how many books you read. What does the tallest bar mean?
(a) Fewest books
(b) Most books
(c) Shortest books
(d) Longest books
Ans: (b) Most books
In a bar graph, the taller the bar, the bigger the number it represents.
Q8. A pictograph uses 1 star for 5 points. If you see 2 stars, how many points are there?
(a) 5
(b) 10
(c) 15
(d) 20
Ans: (b) 10
Each star = 5 points. With 2 stars: 2 × 5 = 10 points.
Q9. A bar graph shows 4 kids like blue, 6 like red, and 3 like green. Which color is least popular?
(a) Blue
(b) Red
(c) Green
(d) All are equal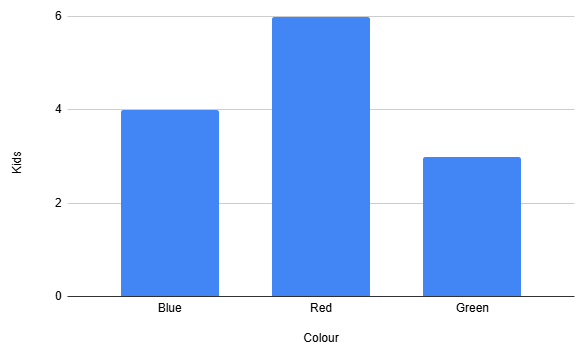 Ans: (c) Green
The shortest bar represents the smallest number. Here, 3 (green) is less than 4 (blue) or 6 (red).
Q10. A bar graph shows fruits eaten: 5 apples, 7 bananas, and 4 oranges. How many more bananas than oranges were eaten?
(a) 1
(b) 2
(c) 3
(d) 4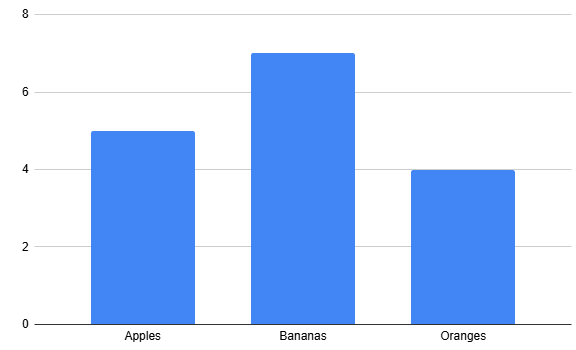 Ans: (c) 3
Bananas: 7, Oranges: 4. Difference: 7 - 4 = 3.
|
36 videos|77 docs|53 tests
|
FAQs on Everyday Mathematics: Data Handling - Mathematics Olympiad for Class 3
| 1. What is data handling in mathematics? |  |
| 2. Why is data handling important for Class 3 students? | |
| 3. What types of graphs do Class 3 students learn to create? | |
| 4. How can teachers make data handling engaging for students? | |
| 5. What are some examples of data handling activities for Class 3? | |


Summary
,Extra Questions
,Exam
,past year papers
,Everyday Mathematics: Data Handling | Mathematics Olympiad for Class 3
,video lectures
,Viva Questions
,ppt
,practice quizzes
,Free
,Everyday Mathematics: Data Handling | Mathematics Olympiad for Class 3
,study material
,Sample Paper
,Previous Year Questions with Solutions
,Objective type Questions
,mock tests for examination
,MCQs
,Everyday Mathematics: Data Handling | Mathematics Olympiad for Class 3
,Important questions
,Semester Notes
,shortcuts and tricks
;


Everyday Mathematics: Data Handling Free PDF Download
Importance of Everyday Mathematics: Data Handling
Everyday Mathematics: Data Handling Notes
Everyday Mathematics: Data Handling Class 3 Questions
Study Everyday Mathematics: Data Handling on the App
|
© EduRev
|
Education Revolution
|


|


within 7 days!