NCERT Solutions: Data Handling

Page No. 203
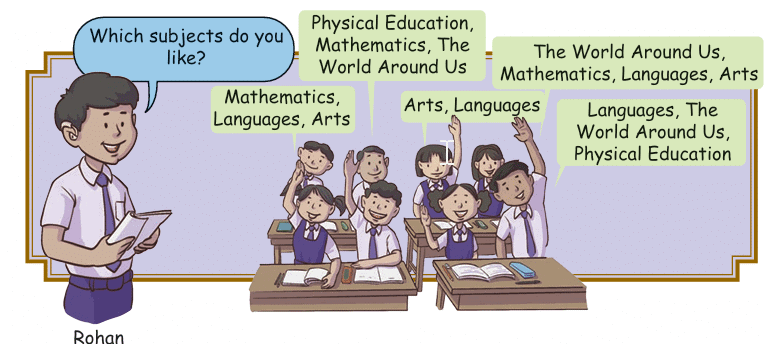
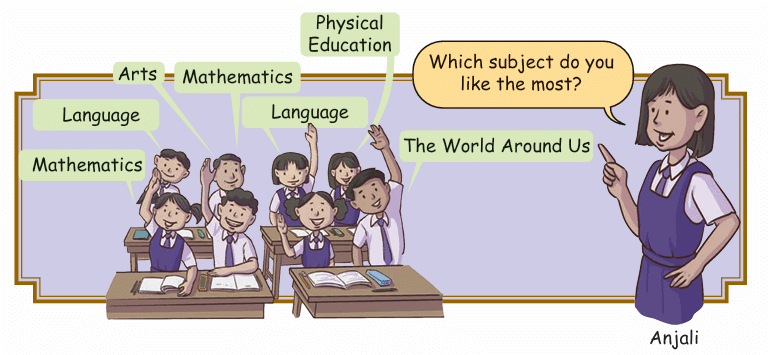
Look at the questions asked by Rohan and Anjali.
Tick the question that is the most appropriate for finding the 'most liked subject'?
Ans: 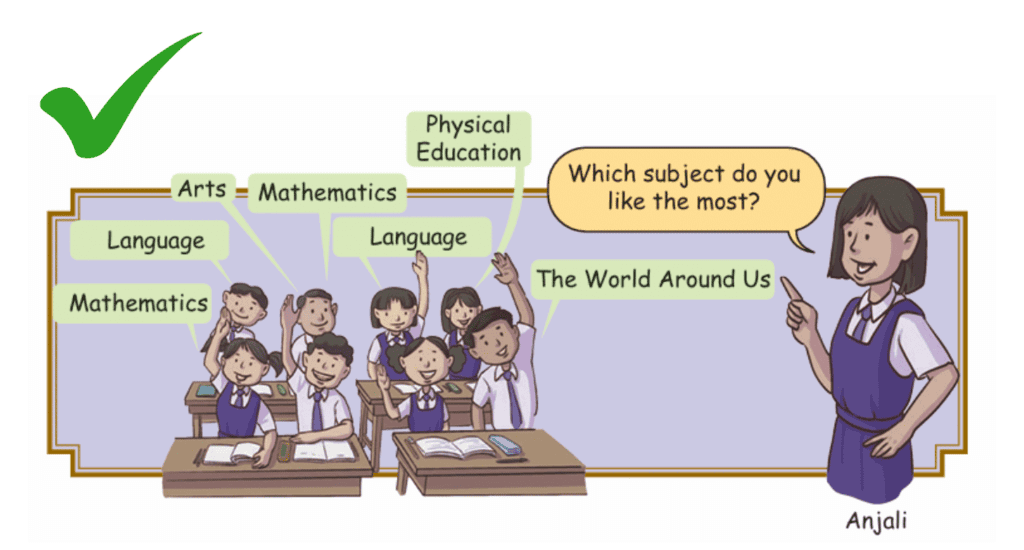
Why do you think so? Discuss with your friends and teacher.
Ans: Anjali's question is the most appropriate because it asks each child to name the single subject they like the most. This makes it easy to count how many children chose each subject and so to decide which subject is the most liked.
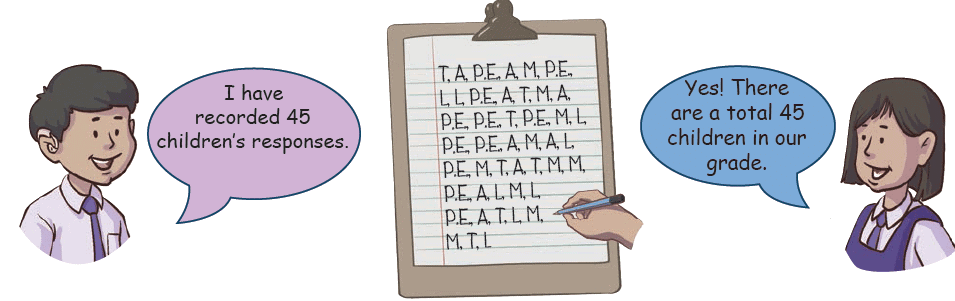
Anjali and Rohan recorded the children's answers (responses) to the above question as follows:
They wrote M for Mathematics, L for Languages, T for The World Around Us, A for Arts and P.E. for Physical Education.
Look at the children's responses above and answer the following questions:
- The number of children who like Mathematics the most is _____________ .
- The number of children who like Language the most is ____________ .
- The number of children who like The World Around Us the most is ___________ .
- The number of children who like Physical Education the most is ___________ .
- The number of children who like Arts the most is _____________ .
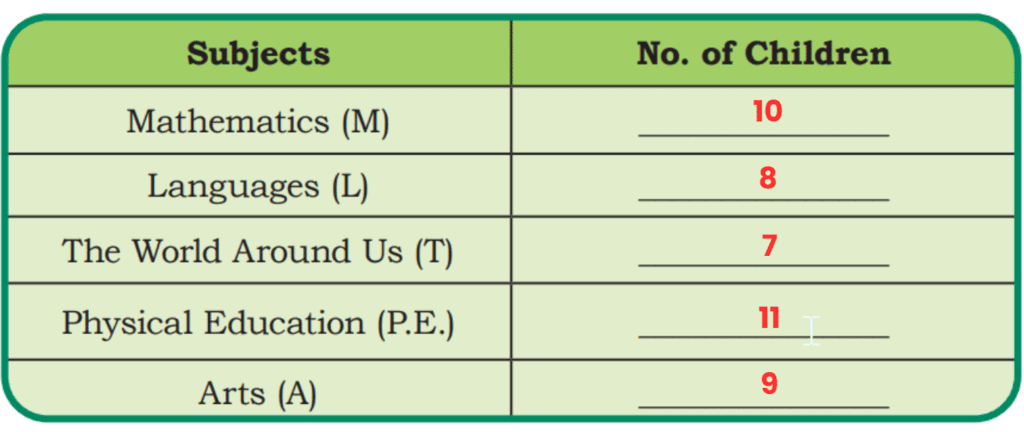
Ans:
- The number of children who like Mathematics the most is 10.
- The number of children who like Language the most is 8.
- The number of children who like The World Around Us the most is 7.
- The number of children who like Physical Education the most is 11.
- The number of children who like Arts the most is 9
We obtained these numbers by counting how many times each letter (M, L, T, A, P.E.) appears in the recorded responses.
Page No. 205
Let's fill in the above information in this table.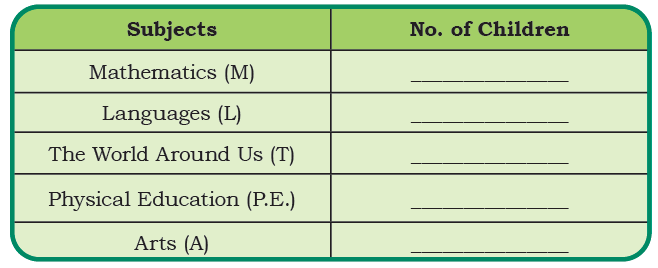
Ans:
Q: Now look at the above table and answer the following questions:
- What is the most common favourite subject among the children? ________________
- What is the least common favourite subject among the children? ________________
Ans:
- The most common favourite subject is Physical Education (P.E.) with 11 children choosing it.
- The least common favourite subject is The World Around Us, with 7 children choosing it.
We decided this by comparing the numbers in the table - 11 is the highest number, and 7 is the lowest.
There are the following two ways to display the information.
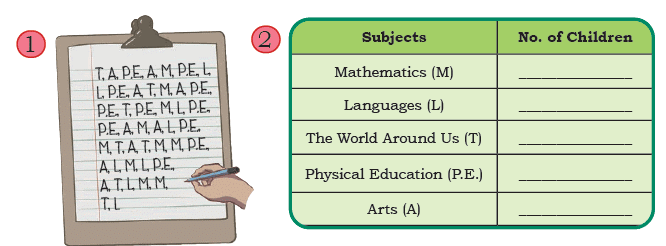
Which way of displaying information is easier to understand and why? ____________
Ans: The table (option 2) is easier to understand because it clearly shows the number of children for each subject in an organised way. It is simple to compare the numbers directly, unlike the list (option 1), which requires counting each response. It also makes it quicker to spot the highest and lowest values.
Page No. 206
Colourful Golas
During school lunch break, children rush to eat gola of their favourite colour.Rohan and Anjali record the golas eaten by different children. They want to eat the one that is most eaten by others.
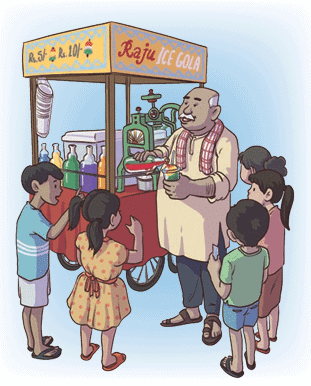
They both start recording the golas eaten by the children.
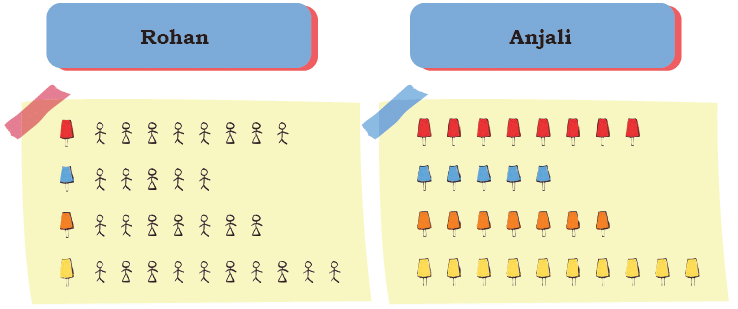
Look at the information given above. Colour the line drawing of the golas appropriately.
Q1: Which colour ice gola do the children eat:
(a) the most
(b) the least
Ans: (a) The most: Yellow colour ice gola
(b) The least: Blue colour ice gola
How do you know?
I counted the golas for each colour. Yellow has the highest count (10), and blue has the lowest count (5).
Q2: Which colour gola would Anjali and Rohan have bought?
Ans: Anjali and Rohan would have bought the yellow colour gola because it is the most popular among the children.
Q3: Which colour golas did boys eat the most?
Ans: Boys ate the most yellow colour golas.
Q4: Which colour golas did girls eat the most?
Ans: Yellow
Q5: Which of the ways of representing data did you use to answer these questions, and why?
Ans: I used the pictures of golas to count how many of each colour were eaten by Rohan and Anjali. This way was easy because I could see and count the golas directly to find the most and least eaten colours. A pictorial display is quick and clear for young children to compare counts.
Page no. 207
Activity - Chess or Cricket
Find out from your classmates how many of them play only chess, only cricket, both or neither.
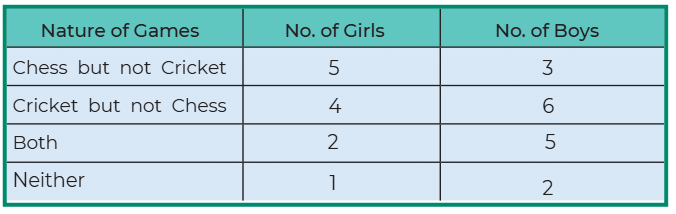
Now, let us organise the above data in the table.
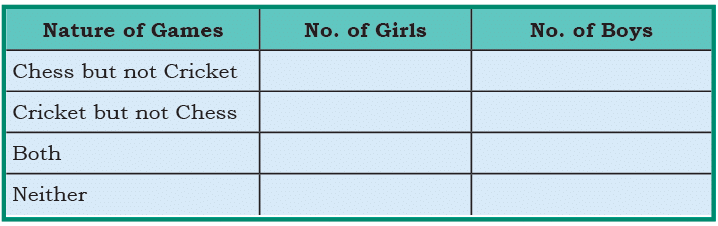
Ans: Example done for students.
Answer these questions based on the data collected from your grade.
Q1: Who plays Chess the most? (Boys/Girls)
Ans: Add the number of children who play:
- Only Chess and
- Both Chess and Cricket
For Girls: 5 (only Chess) + 2 (both) = 7 girls
For Boys: 3 (only Chess) + 5 (both) = 8 boys
So the answer is: Boys
Q2: Who plays Cricket the most? (Boys/Girls)
Ans: Add those who play:
- Only Cricket and
- Both games
For Girls: 4 + 2 = 6 girls
For Boys: 6 + 5 = 11 boys
So the answer is: Boys
Since 11 (boys) is greater than 6 (girls), boys play Cricket the most.
Q3: How many children play both types of games?
Ans: Just add the "Both" row:
- Girls: 2
- Boys: 5
Total: 2 + 5 = 7 children
Page No. 208
Bal Mela
Anjali and Rohan have recorded the number of people who ate fruit chaats and sandwiches in the Bal Mela over three days, using a Pictograph.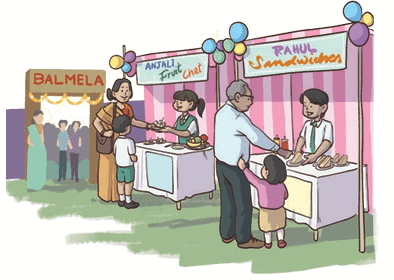
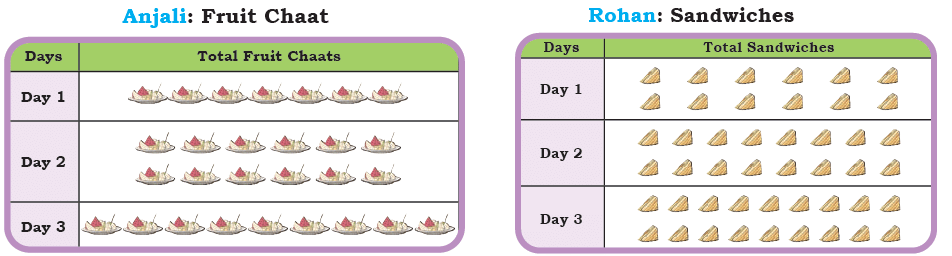
Let us Do
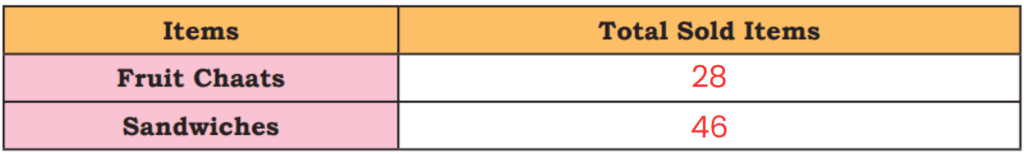
Q1: Complete the table.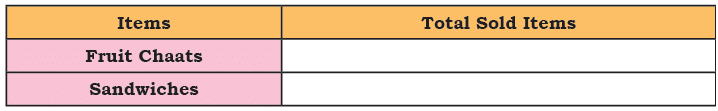
Ans:
Q2: On which day were the most sandwiches sold?
Ans: Day 3
The pictograph shows the largest number of sandwich symbols on Day 3, so more sandwiches were sold on that day than on any other.
Q3: Which item had the highest sales on Day 2?
Ans: Sales of fruit chaats on day 2 = 12
Sales of sandwiches on day 2 = 16
The difference in the sales of both items = 16 - 12 = 4.
Hence, sandwiches had the highest sales on day 2.
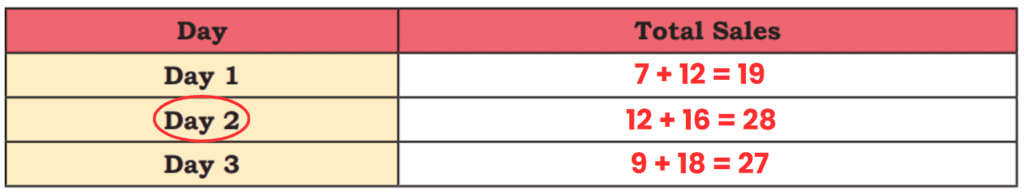
Q4: Complete the table given below. Circle the day that had the highest sales.
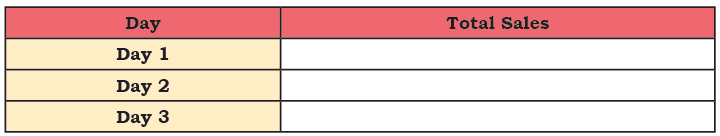
Ans:
FAQs on NCERT Solutions: Data Handling
| 1. What are the key concepts of data handling introduced in Class 4? |  |
| 2. How can I help my child with the data handling exercises from the NCERT textbook? | |
| 3. What activities are included in the NCERT Class 4 data handling chapter? | |
| 4. Why is it important for children to learn data handling at an early age? | |
| 5. Can you explain the difference between a pictograph and a bar graph? | |