Population Distribution, Density, Growth & Composition Class 12 Geography
| Table of contents |

|
| Distribution of Population |

|
| Density of Population |

|
| Growth of Population |

|
| Regional Variation in Population Growth |

|
| Population Composition |

|
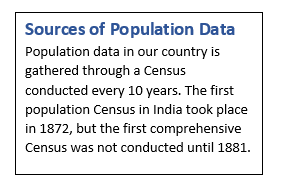
With a population of 1.21 billion as of 2011, India is the world's second most populous country, after China. In fact, India's population exceeds the combined population of North America, South America, and Australia. Population statistics are gathered through a census conducted every 10 years in India.

Distribution of Population
- The distribution of population in India is highly uneven, with Uttar Pradesh having the largest share followed by Maharashtra, Bihar and West Bengal.
- The states of Uttar Pradesh, Maharashtra, Bihar, West Bengal, Andhra Pradesh, Tamil Nadu, Madhya Pradesh, Rajasthan, Karnataka and Gujarat together account for about 76% of the total population of the country. However, some states like Jammu & Kashmir (1.04%), Arunachal Pradesh (0.11%) and Uttarakhand (0.84%) have a very small share of population despite having a large geographical area.
- The uneven distribution of population in India shows how closely related population is to physical, socio-economic, and historical factors. Physically, climate, land features, and water availability play a big role in where people live.
- For example, the North Indian Plains, deltas, and Coastal Plains have more people compared to the interior regions of southern and central India, the Himalayas, and some northeastern and western states.
- However, improvements like irrigation in Rajasthan, access to minerals and energy resources in Jharkhand, and better transport networks in Peninsular India have led to higher populations in areas that used to be sparsely populated.
- The evolution of settled agriculture, development of transport networks, industrialization and urbanization, as well as patterns of human settlement are significant socio-economic and historical factors affecting population distribution.
- In India, regions near river plains and coastal areas tend to have higher population concentrations. Even though these areas have experienced some degradation of natural resources like land and water, their populations remain high due to early agricultural development and settlement.
- Urban areas like Delhi, Mumbai, Kolkata, Bengaluru, Pune, Ahmedabad, Chennai, and Jaipur have high population densities. This is mainly due to industrial development and urbanization, which attract many people from rural areas seeking better opportunities.
Density of Population
The population density is the number of individuals residing in a given unit of land area.
- It is an essential indicator for understanding the spatial distribution of population in relation to land.
- In 2011, India's population density was 382 individuals per square kilometer.
- The density varies widely across states, ranging from 17 individuals per square kilometer in Arunachal Pradesh to 11,297 persons in the National Capital Territory of Delhi.
1. High Densities in Northern States: Bihar (1,102 people/sq km), West Bengal
(1,029 people/sq km), Uttar Pradesh (828 people/sq km)
2. High Densities in Peninsular States: Kerala (859 people/sq km), Tamil Nadu
(555 people/sq km)
3. Moderate Densities: States like Assam, Gujarat, Andhra Pradesh, Haryana, Jharkhand, and Odisha.
4. Low Densities: The Himalayan hill states and northeastern states (excluding Assam) have relatively low densities.
5. High Densities in Union Territories: Most Union Territories (excluding Andaman and Nicobar Islands) have very high population densities. - The population density in hilly, rugged, and desert areas is generally low due to harsh terrain and climate. However, density alone cannot provide a comprehensive measure of the human-land relationship.
- To gain a more accurate understanding of the pressure of population on the total cultivable land, it is necessary to calculate physiological and agricultural densities. These measures are particularly relevant for countries like India with a large agricultural population.
1. Physiological density refers to the total population divided by the net cultivated area.
2. Agricultural density refers to the total agricultural population, including cultivators, agricultural laborers, and their families, divided by the net cultivable area.
Growth of Population
Population growth refers to the change in the number of individuals living in a specific region between two points in time.
- Its rate is expressed in percentage. The growth rate consists of natural and induced components.
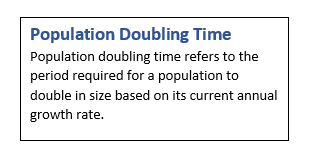
- Assessing the crude birth and death rates helps in analysing natural growth, while induced growth is explained by the volume of inward and outward migration in a particular area. India's population growth rate has been consistently high, with an annual growth rate of 1.64 percent in 2011.

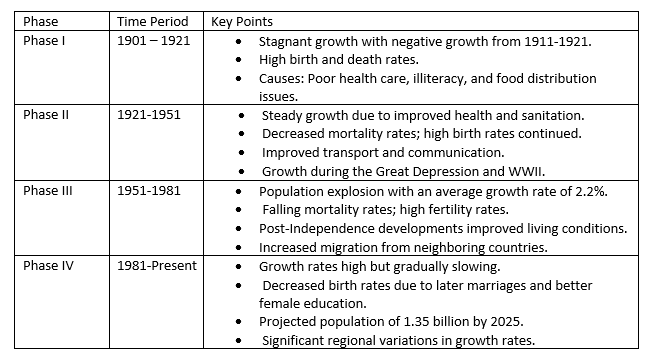
- India has undergone four phases of population growth since 1901 which are as follows:

Regional Variation in Population Growth
- States such as Kerala, Karnataka, Tamil Nadu, AndhraPradesh, Odisha, Puducherry, and Goa have a growth rate below 20 percent over a decade.
- Kerala registered the lowest growth rate (9.4) not only in this group of states but also in the country as a whole.
- The growth rate of a continuous belt of states comprising Gujarat, Maharashtra, Rajasthan, Punjab, Haryana, Uttar Pradesh, Uttarakhand, Madhya Pradesh, Sikkim, Assam, West Bengal, Bihar, Chhattisgarh, and Jharkhand, on average remained 20-25 percent.
- From 2001-2011, almost all states and union territories showed a lower growth rate than the previous decade.
- Adolescent Share: Currently, adolescents (ages 10-19) make up about 20.9% of India's population (as of 2011).
1. Male Adolescents: 52.7%
2. Female Adolescents: 47.3% - Potential and Vulnerability: This age group has a lot of potential but can be vulnerable if not properly supported.
- Challenges Faced:
1. Early Marriage: Lower age at marriage.
2. Illiteracy: Especially among females.
3. School Dropouts: Many adolescents leave school early.
4. Nutrition: Low intake of essential nutrients.
5. Maternal Mortality: High rates among young mothers.
6. Health Issues: Increased rates of HIV and AIDS.
7. Disabilities: Physical and mental health challenges.
8. Substance Abuse: Issues with drug and alcohol use.
9. Juvenile Delinquency: Engagement in crime and other anti-social behaviors. - Government Policies:
(i) The National Youth Policy (NYP-2014), launched in February 2014, aims to empower the youth of India to achieve their full potential and enable the country to find its rightful place in the global community.
(ii) The Government of India formulated the National Policy for Skill Development and Entrepreneurship in 2015, which provides an umbrella framework for all skilling activities in the country and aligns them with common standards while linking skilling with demand centers.
Population Composition
Population composition is a specific area of study in population geography.
It looks at various factors such as age, gender, where people live, their ethnic backgrounds, languages, religions, marital status, education, and jobs.
Rural – Urban Composition
- The proportion of population living in rural or urban areas is a significant indicator of a country's socio-economic status. In India, around 68.8% of people reside in rural areas.
- The distribution of the rural population in India varies widely.
1. Himachal Pradesh and Bihar have a very high percentage of people living in rural areas.
2. In contrast, Goa and Mizoram have just a little over half of their total population living in villages. - Certain Union Territories, such as Dadra and Nagar Haveli, have a lower percentage of rural population, with only 53.38% of residents living in rural areas.
- In northeastern India, Western Rajasthan, and the Rann of Kutch, the rural population is less than 200 people per square kilometer.
- In Kerala and parts of Maharashtra, the rural population reaches about 17,000 people per square kilometer.
- The distribution of rural population depends on both intra and inter-state levels of urbanization and rural-urban migration.
The urban population in India is relatively low at 31.16% but is growing much faster over the years due to economic development and improvements in health and hygiene conditions.
High urban population is observed along major transport links in North Indian plains, as well as in industrial regions like Kolkata and Mumbai.
Low urban population is found in agriculturally stagnant regions of the middle and lower Ganga plains, non-irrigated areas of western Rajasthan, remote hilly regions, desert, and flood-prone areas of Peninsular India.
Linguistic Composition
- During the linguistic survey of India (1903-1928), it was found that India had 179 languages and 544 dialects. In contemporary India, there are approximately 22 scheduled languages and several non-scheduled languages.
- Out of the scheduled languages, Hindi speakers constitute the largest percentage, while speakers of Sanskrit, Bodo and Manipuri languages have the lowest representation (2011).
- The major Indian languages belong to four language families, which have several sub-families and branches. These four language families are Austric, Dravidian, Sino-Tibetan and Indo-European.
Religious Composition
- Religion plays a significant role in shaping the cultural and political aspects of Indian society. The distribution of religious communities in India varies by state.
- Hinduism is the predominant religion in most states except for those situated along the borders with Pakistan, Bangladesh, and Tibet, as well as a few scattered areas within the country.
- Muslims, the largest religious minority, are concentrated in Jammu and Kashmir, certain districts of West Bengal, Kerala, Uttar Pradesh, and the Union Territories of Delhi and Lakshadweep.
- Christians are mostly found in the rural areas of Chotanagpur, Manipur hills, Goa, Kerala, Mizoram, Meghalaya, Nagaland, and other regions.
- Sikhs are concentrated in Punjab, Haryana, and Delhi.
- Jains and Buddhists are the smallest religious groups, and are primarily found in certain areas. Jains are found in urban areas of Rajasthan, Gujarat, and Maharashtra, while Buddhists are found in Maharashtra, Sikkim, Arunachal Pradesh, Ladakh, Tripura, and Lahaul and Spiti in Himachal Pradesh.
- Other religions in India include Zoroastrians, tribal religions, and other indigenous faiths and beliefs, which are mostly concentrated in small pockets scattered throughout the country.
Composition of Working Population
- India's population is categorized into three groups based on their economic status:
(i) main workers
(ii) marginal workers,
(iii) non-workers. - In India, only 39.8% of the population are workers (including main and marginal workers), leaving about 60% as non-workers, as of 2011.
- Work Participation rate:
1. The percentage of people working in different states and Union Territories varies.
For example, it is about 29.1% in Lakshadweep and 51.9% in Himachal Pradesh. States with higher percentages of workers include Himachal Pradesh, Sikkim, Chhattisgarh, Andhra Pradesh, Karnataka, Arunachal Pradesh, Nagaland, Manipur, and Meghalaya. Among Union Territories, Dadra and Nagar Haveli and Daman and Diu have higher participation rates.
2. In India, areas with lower economic development tend to have higher work participation because they need more manual workers for basic economic activities.
3. The majority of workers are in the primary sector (54.6% are cultivators and agricultural laborers).
4. Only 3.8% work in household industries, while 41.6% are in other sectors like trade and services.
5. In all sectors, male workers outnumber female workers.
Promoting Gender Sensitivity through ‘Beti Bachao–Beti Padhao’ Social Campaign
- While society views the division of individuals into male, female, and transgender as natural and biological, social constructs and roles assigned by social institutions reinforce these divisions.
- Biological differences serve as the foundation for social differentiations, discrimination, and exclusion.
- The Indian Government has recognized the negative impact of these discriminations and launched a nationwide campaign called ‘Beti Bachao – Beti Padhao’.
- While the participation of women in the primary sector is relatively high, there has been some improvement in their participation in the secondary and tertiary sectors in recent years.
The work participation rate in different sectors of the country shows significant spatial variation.
- States like Himachal Pradesh and Nagaland have a considerable share of cultivators.
- In contrast, states like Bihar, Andhra Pradesh, Chhattisgarh, Odisha, Jharkhand, West Bengal, and Madhya Pradesh have a higher proportion of agricultural laborers.
- Highly urbanized areas such as Delhi, Chandigarh, and Puducherry have a significant number of workers engaged in other services.
|
50 videos|353 docs|37 tests
|
FAQs on Population Distribution, Density, Growth & Composition Class 12 Geography
| 1. What factors influence the distribution of population across different regions? |  |
| 2. How is population density calculated, and why is it important? |  |
| 3. What are the main causes of population growth? |  |
| 4. How does population growth vary regionally, and what are some examples? |  |
| 5. What is population composition, and what factors are considered in its analysis? |  |


