Measure of Dispersion - Statistics | Mathematics (Maths) for JEE Main & Advanced PDF Download
| Table of contents |

|
| Measure of Dispersion |

|
| Range |

|
| Mean Deviation (MD) |

|
| Standard Deviation (σ) |

|
| Variance: |

|
Measure of Dispersion
The degree to which numerical data tend to spread about an average value is called the dispersion of the data. The four measure of dispersion are
1. Range
2. Mean deviation
3. Standard deviation
4. Variance
Range
The difference between the highest and the lowest element of a data called its range.
i.e., Range = Xmax – Xmin
∴ The coefficient of range = Xmax – Xmin / Xmax + Xmin
It is widely used in statistical series relating to quality control in production.
(i) Inter quartile range = Q3 — Q1
(ii) Semi-inter quartile range (Quartile deviation)
∴ Q D = Q3 — Q1 / 2
and coefficient of quartile deviation = Q3 — Q1 / Q3 + Q1
(iii) QD = 2 / 3 SD
Mean Deviation (MD)
The arithmetic mean of the absolute deviations of the values of the variable from a measure of their Average (mean, median, mode) is called Mean Deviation (MD). It is denoted by δ.
(i) For simple (discrete) distribution
δ = Σ |x – z| / n
where, n = number of terms, z = A or Md or Mo
(ii) For unclassified frequency distribution
δ = Σ f |x – z| / Σ f
(iii) For classified distribution
δ = Σ f |x – z| / Σ f
Here, x is for class mark of the interval.
(iv) MD = 4 / 5 SD
(v) Average (Mean or Median or Mode) = Mean deviation from the average / Average
Note The mean deviation is the least when measured from the median.
Coefficient of Mean Deviation
It is the ratio of MD and the mean from which the deviation is measured. Thus, the coefficient of MD
= δ A / A or δ M d / M d or δ M o / M o
Standard Deviation (σ)
Standard deviation is the square root of the arithmetic mean of the squares of deviations of the terms from their AM and it is denoted by σ.
The square of standard deviation is called the variance and it is denoted by the symbol σ2.
(i) For simple (discrete) distribution
(ii) For frequency distribution
(iii) For classified data
Here, x is class mark of the interval.
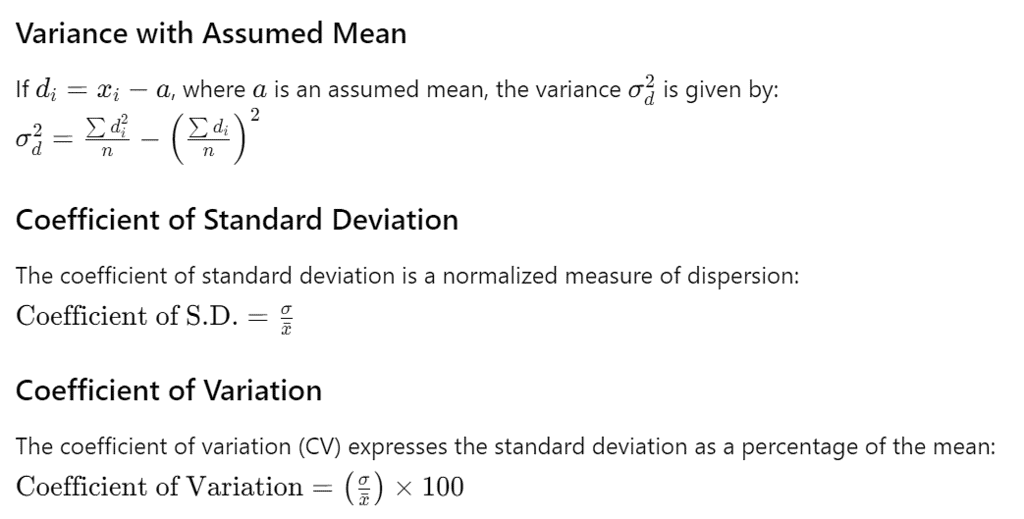
Shortcut Method for SD σ =
where, d = x — A’ and A’ = assumed mean
Standard Deviation of the Combined Series
If n1, n2 are the sizes, X1, X2 are the means and σ1, σ2 are the standard deviation of the series, then the standard deviation of the combined series is
where,
Variance:
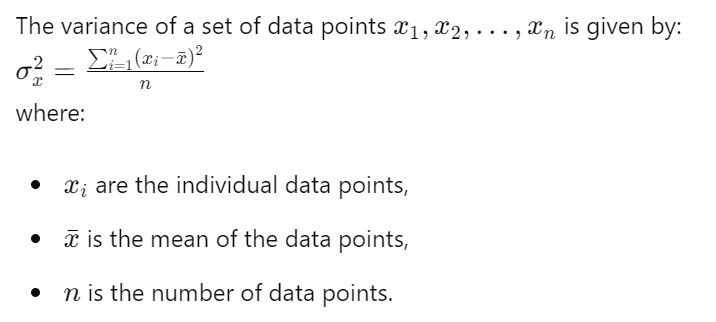
Variance is a statistical measure that represents the dispersion of a set of data points around their mean value. It indicates how spread out the data points are. The variance is denoted by \sigma^2 or var(x). It is calculated as the average of the squared differences between each data point and the mean of the data set.Standard Deviation: The standard deviation is the positive square root of the variance. It provides a measure of the dispersion or spread of a set of data points. It is denoted by or S.D.
Formulas
Variance :
:


Properties of Variance
Addition of a Constant: var(xi+λ) = var(xi) Adding a constant λ to each data point does not change the variance.
Multiplication by a Constant: var(λxi)=λ2var(xi) Multiplying each data point by a constant λ scales the variance by λ2.
Linear Transformation: var(axi+b)=a2var(xi) For a linear transformation where xi is multiplied by a constant a and then added to a constant , the variance is scaled by a2. The addition of the constant b does not affect the variance.
Effects of Average and Dispersion on Change of origin and Scale
| Change of origin | Change of scale | |
| Mean | Dependent | Dependent |
| Median | Not dependent | Dependent |
| Mode | Not dependent | Dependent |
| Standard Deviation | Not dependent | Dependent |
| Variance | Not dependent | Dependent |
|
172 videos|503 docs|154 tests
|
FAQs on Measure of Dispersion - Statistics - Mathematics (Maths) for JEE Main & Advanced
| 1. What is the range in statistics? |  |
| 2. What is mean deviation (MD) and how is it calculated? |  |
| 3. How is standard deviation (σ) different from variance in statistics? |  |
| 4. What does variance signify in statistics? |  |
| 5. How are measures of dispersion like range, mean deviation, standard deviation, and variance useful in data analysis? |  |


