Quant Mock Test - 6 - CLAT MCQ
15 Questions MCQ Test - Quant Mock Test - 6

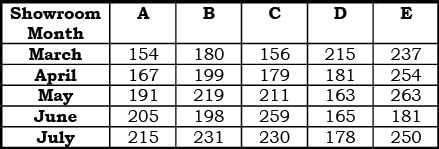
Directions: Study the table to answer the given questions:
Number of cars sold (in thousand) by 5 showrooms during 5 months

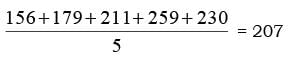
Q. What is the average number of cars sold (in thousand) by showroom C in all the given months together?
Number of cars sold (in thousand) by 5 showrooms during 5 months
Directions: Study the table to answer the given questions:
Number of cars sold (in thousand) by 5 showrooms during 5 months

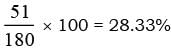
Q. By what percent the number of cars sold by showroom B increases from March to July?
Number of cars sold (in thousand) by 5 showrooms during 5 months

Directions: Study the table to answer the given questions:
Number of cars sold (in thousand) by 5 showrooms during 5 months
Q. The number of cars sold by showroom E increased by 8% from July to August and by 20% from August to September. How many cars were sold (in thousand) by store E in September?
Number of cars sold (in thousand) by 5 showrooms during 5 months
Directions: Study the table to answer the given questions:
Number of cars sold (in thousand) by 5 showrooms during 5 months
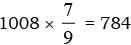
Q. The total number of cars sold by all the given stores together in August was 7/9 of the total number of cars sold by all the given stores together in June. How many cars were sold (in thousand) by all the given stores together in August itself?
Directions: Study the table to answer the given questions:
Number of cars sold (in thousand) by 5 showrooms during 5 months
Q. The no. of cars sold by showroom D in July is approximately what percent more than the number of cars sold by showroom A is March?
Directions: Study the table carefully and answer the given questions.
Number of Pages Printed by 6 Printers in 5 Different Weeks

Q. What is the respective ration between the number of pages printed by Printer – B in 2nd week and the number of pages printed by Printer – F in 5th week?
Directions: Study the table carefully and answer the given questions.
Number of Pages Printed by 6 Printers in 5 Different Weeks

Q. What is the approx average number of pages printed by all the given printers in 4th week?
Directions: Study the table carefully and answer the given questions.
Number of Pages Printed by 6 Printers in 5 Different Weeks
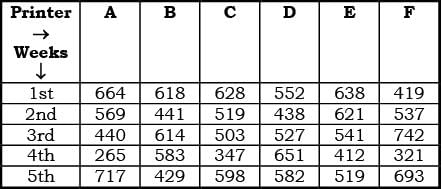
Q. Which of the following printer printed maximum number of pages in all the given weeks together?
Directions: Study the table carefully and answer the given questions.
Number of Pages Printed by 6 Printers in 5 Different Weeks

Q. Number of pages printed by Printer – A in 3rd week is what percent of the total number of pages printed by Printer – D in all the given weeks?
Directions: Study the table carefully and answer the given questions.
Number of Pages Printed by 6 Printers in 5 Different Weeks

Q. What is the difference between the total number of pages printed by Printed – E in 1st, 2nd and 4th week together and total number of pages printed by Printer – C in all the given weeks together?
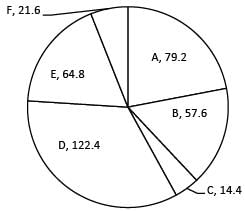
Directions: Study the following pie-chart and answer the questions given below.
Preferences of Students for Six Beverages A, B, C, D, E and F in Terms of Degrees of Angle in the Pie-chart (Value in Degree)

Total No. of Students = 6800
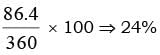
Q. What is the difference between the total number of students who prefer beverage A and C together and the total number of students who prefer beverage D and F together?
Directions: Study the following pie-chart and answer the questions given below.
Preferences of Students for Six Beverages A, B, C, D, E and F in Terms of Degrees of Angle in the Pie-chart (Value in Degree)
Total No. of Students = 6800
Q. What is the ratio of the number of students who prefer beverage F to the number of students who prefer beverage A?
Directions: Study the following pie-chart and answer the questions given below.
Preferences of Students for Six Beverages A, B, C, D, E and F in Terms of Degrees of Angle in the Pie-chart (Value in Degree)

Total No. of Students = 6800
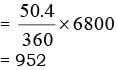
Q. The number of students who prefer beverage E and F together is what percent of the total number of students?
Directions: Study the following pie-chart and answer the questions given below.
Preferences of Students for Six Beverages A, B, C, D, E and F in Terms of Degrees of Angle in the Pie-chart (Value in Degree)

Total No. of Students = 6800
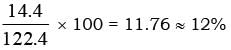
Q. The number of students who prefer beverage C is approximately what percent of the number of students who prefer beverage D?
Directions: Study the following pie-chart and answer the questions given below.
Preferences of Students for Six Beverages A, B, C, D, E and F in Terms of Degrees of Angle in the Pie-chart (Value in Degree)

Total No. of Students = 6800
Q. How many students prefer beverage B and E together?
Important Questions for Quant Mock Test - 6
Quant Mock Test - 6 MCQs with Answers
Online Tests for Quant Mock Test - 6
|
© EduRev
|
Education Revolution
|


|


within 7 days!