Quant Mock Test - 7 - CLAT MCQ
15 Questions MCQ Test - Quant Mock Test - 7
Directions: Study the table and answer the given questions.
Date related to candidate appeared and qualified from State 'X' in the competitive exam during 5 years

Q. In 2003, if the number of female qualified candidates was 70, what was respective ratio of number of female qualified candidates and number of male qualified candidates in the same year?
Date related to candidate appeared and qualified from State 'X' in the competitive exam during 5 years

Directions: Study the table and answer the given questions.
Date related to candidate appeared and qualified from State 'X' in the competitive exam during 5 years

Q. Number of appeared candidates increased by 20% from 2002 to 2006. If 25% of the appeared candidates qualified in 2006, what was the number of qualified candidates in 2006?
Date related to candidate appeared and qualified from State 'X' in the competitive exam during 5 years

Directions: Study the table and answer the given questions.
Date related to candidate appeared and qualified from State 'X' in the competitive exam during 5 years

Q. If the average number of qualified candidates in 2002 and 2005 was 433, what percent of appeared candidates qualified in the competitive exam in 2002?
Date related to candidate appeared and qualified from State 'X' in the competitive exam during 5 years

Directions: Study the table and answer the given questions.
Date related to candidate appeared and qualified from State 'X' in the competitive exam during 5 years

Q. In 2004, if the different between number of male qualified candidates and number of female qualified candidates was 120, what was the number of appeared candidate in 2004?
Directions: Study the table and answer the given questions.
Date related to candidate appeared and qualified from State 'X' in the competitive exam during 5 years

Q. In 2001, the respective ratio of number of appeared candidates to qualified candidates was 5 : 2. Number of female candidates qualified in 2001 constitutes what percent of the number of appeared candidates in the same year?
Directions: Refer to the graph and answer the given questions.
Number of visitors in Country 'XYZ' from City A and City B
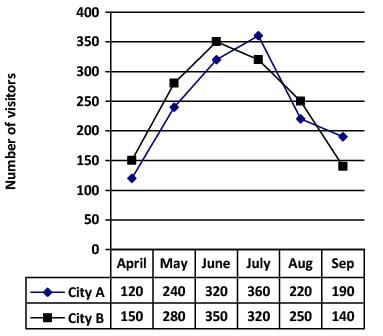
Q. The number of visitors from City A in May is what percent less than the number of visitors from City B in July?
Directions: Refer to the graph and answer the given questions.
Number of visitors in Country 'XYZ' from City A and City B
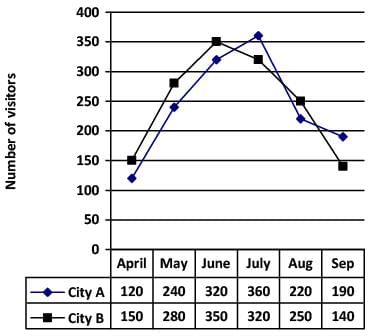
Q. What is the average number of visitors from City B in May, June, August and September?
Directions: Refer to the graph and answer the given questions.
Number of visitors in Country 'XYZ' from City A and City B
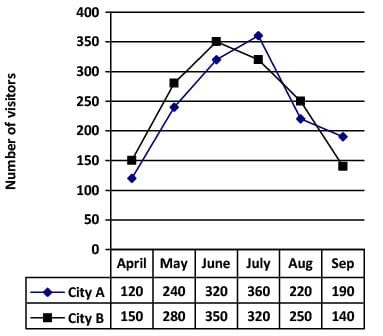
Q. What is the difference between the total number of visitors from City A and City B together in September and the total number of visitors from both the cities together in August?
Directions: Refer to the graph and answer the given questions.
Number of visitors in Country 'XYZ' from City A and City B
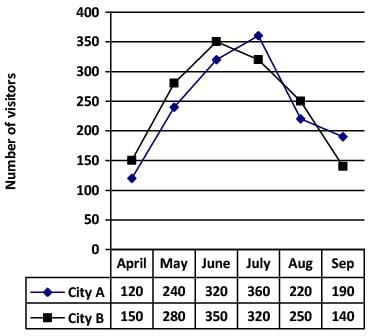
Q. The number of visitors from City A in April increased by 20% from the previous month. What is the respective ratio between the number of visitors from City A in July and the number of visitors from the same city in March?
Directions: Refer to the graph and answer the given questions.
Number of visitors in Country 'XYZ' from City A and City B
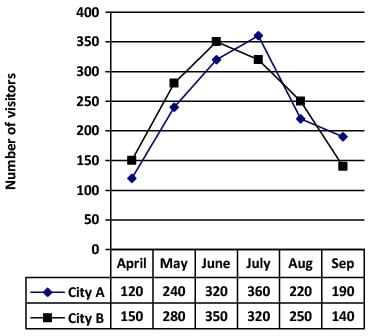
Q. The number of visitors from City B increased by what percent from April to June?
Direction: Study the following table carefully and answer the questions given below:
Dozens of Eggs produced by various Poultry Farms over the years
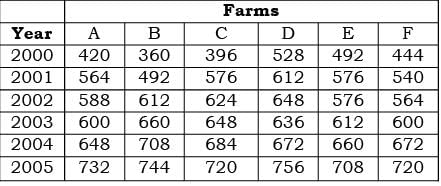
Q. What is the average number of eggs produced by Farm D over the years?
Direction: Study the following table carefully and answer the questions given below:
Dozens of Eggs produced by various Poultry Farms over the years
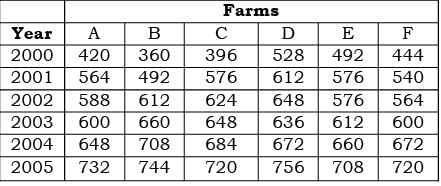
Q. The eggs produced by Farm B in the year 2003 are approximately what percent of the eggs produced by Farm B over the years?
Direction: Study the following table carefully and answer the questions given below:
Dozens of Eggs produced by various Poultry Farms over the years
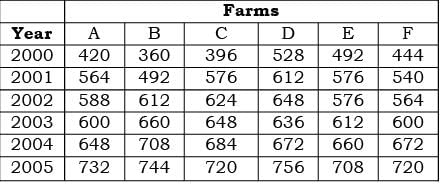
Q. What is the respective ratio of the eggs produced by Farm A to Farm E in the year 2005?
Direction: Study the following table carefully and answer the questions given below:
Dozens of Eggs produced by various Poultry Farms over the years
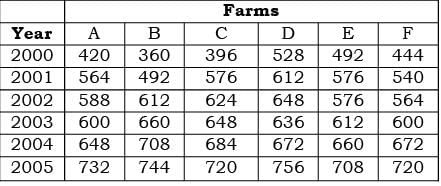
Q. What is the respective ratio of the eggs produced by Farms A, B and C together in the year 2000 to the eggs produced by Farms D, E and F together in the same year?
Direction: Study the following table carefully and answer the questions given below:
Dozens of Eggs produced by various Poultry Farms over the years
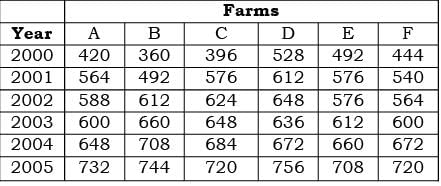
Q. What is the difference between the total number of eggs produced by all the farms together in the year 2001 and the year 2004?


