Sample Test: Quantitative Techniques - CLAT MCQ
14 Questions MCQ Test - Sample Test: Quantitative Techniques
Directions: Answer the questions on the basis of the information given below.
The break-up of the total number of state government employees in five different states of India - Andhra Pradesh (AP), Gujarat, Uttar Pradesh (UP), Maharashtra and Karnataka in 2018 is depicted in the pie- chart below. The bar graph shows the percentage break-up between permanent and temporary government employees for each state in the same year.
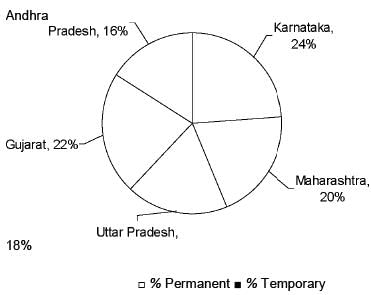
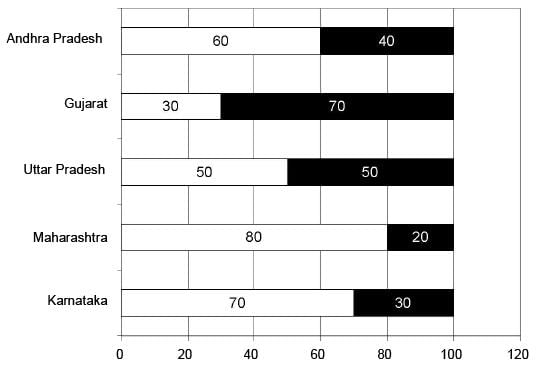
If the total number of state government employees in Maharashtra is 9000, then what is the total number of state government employees in Karnataka and Gujarat together?
The break-up of the total number of state government employees in five different states of India - Andhra Pradesh (AP), Gujarat, Uttar Pradesh (UP), Maharashtra and Karnataka in 2018 is depicted in the pie- chart below. The bar graph shows the percentage break-up between permanent and temporary government employees for each state in the same year.


Directions: Answer the questions on the basis of the information given below.
The break-up of the total number of state government employees in five different states of India - Andhra Pradesh (AP), Gujarat, Uttar Pradesh (UP), Maharashtra and Karnataka in 2018 is depicted in the pie- chart below. The bar graph shows the percentage break-up between permanent and temporary government employees for each state in the same year.
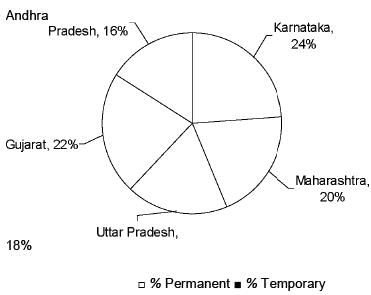
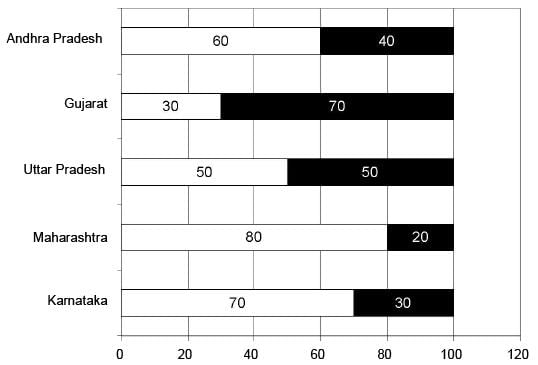
If Andhra Pradesh has 2880 temporary employees, then what is the total number of employees in Uttar Pradesh?
The break-up of the total number of state government employees in five different states of India - Andhra Pradesh (AP), Gujarat, Uttar Pradesh (UP), Maharashtra and Karnataka in 2018 is depicted in the pie- chart below. The bar graph shows the percentage break-up between permanent and temporary government employees for each state in the same year.


Directions: Answer the questions on the basis of the information given below.
The break-up of the total number of state government employees in five different states of India - Andhra Pradesh (AP), Gujarat, Uttar Pradesh (UP), Maharashtra and Karnataka in 2018 is depicted in the pie- chart below. The bar graph shows the percentage break-up between permanent and temporary government employees for each state in the same year.
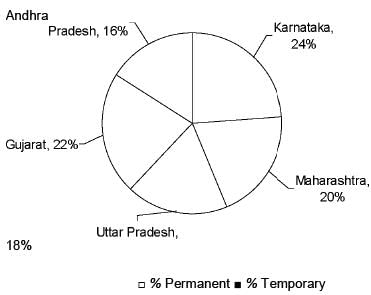
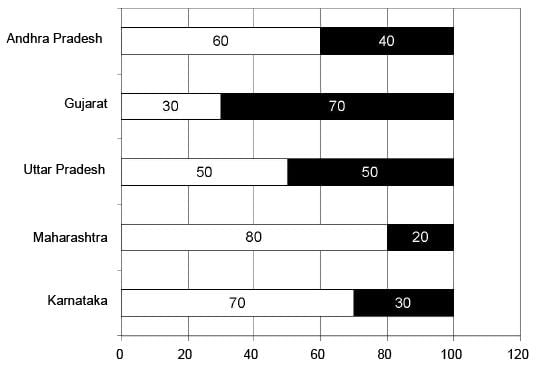
Which two states have the highest and the lowest number of temporary employees respectively?
The break-up of the total number of state government employees in five different states of India - Andhra Pradesh (AP), Gujarat, Uttar Pradesh (UP), Maharashtra and Karnataka in 2018 is depicted in the pie- chart below. The bar graph shows the percentage break-up between permanent and temporary government employees for each state in the same year.


Directions: Answer the questions on the basis of the information given below.
The break-up of the total number of state government employees in five different states of India - Andhra Pradesh (AP), Gujarat, Uttar Pradesh (UP), Maharashtra and Karnataka in 2018 is depicted in the pie- chart below. The bar graph shows the percentage break-up between permanent and temporary government employees for each state in the same year.
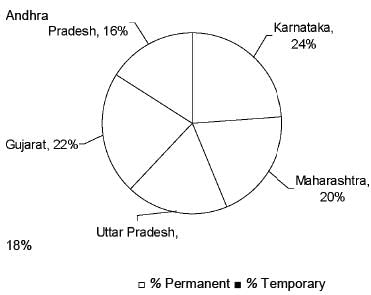
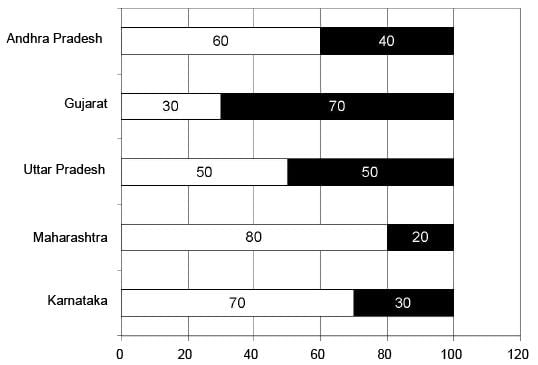
If the states are ranked according to the number of permanent employees, then which two states are first and second respectively?
Directions: Answer the questions on the basis of the information given below.
The break-up of the total number of state government employees in five different states of India - Andhra Pradesh (AP), Gujarat, Uttar Pradesh (UP), Maharashtra and Karnataka in 2018 is depicted in the pie- chart below. The bar graph shows the percentage break-up between permanent and temporary government employees for each state in the same year.
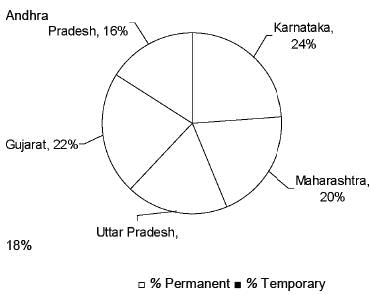
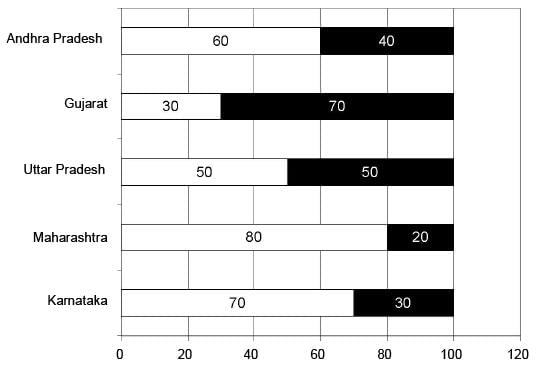
If the difference between the permanent employees and temporary employees of Karnataka is 192, then what is the total number of permanent employees in Gujarat and Andhra Pradesh together?
Directions: Answer the questions on the basis of the information given below.
A contractor undertakes a project to build a road. It is also known that:
The length of the road to be built is 15 km.
Total time allotted for the completion of work is 100 days.
The contractor employs 50 men for this purpose.
After 50 days he finds that only 6 km of the road is ready.
How many days behind schedule will the project be if the work continues at the same rate?
Directions: Answer the questions on the basis of the information given below.
A contractor undertakes a project to build a road. It is also known that:
The length of the road to be built is 15 km.
Total time allotted for the completion of work is 100 days.
The contractor employs 50 men for this purpose.
After 50 days he finds that only 6 km of the road is ready.
What should be the percentage increase in efficiency of the men for the remaining period so that the work is completed as per schedule?
Directions: Answer the questions on the basis of the information given below.
A contractor undertakes a project to build a road. It is also known that:
The length of the road to be built is 15 km.
Total time allotted for the completion of work is 100 days.
The contractor employs 50 men for this purpose.
After 50 days he finds that only 6 km of the road is ready.
How many more men should he employ to complete the work as per schedule?
Contribution Margin and Market Share of Company A is given for 8 months period. First being April to last being November (simultaneous months from April to November). If the contribution margin of the March is Rs. 1 lakh, then answer the questions based on the data given.
How much has market share changed from 4th month to 8th month assuming the customer base is same for all the months?
Study the following information and answer the related questions.
P, Q, R, S, T, A, B, C, D and E are employees of a company. A table shows the average age of any two employees of the company. The average age of A and B is 27.5.
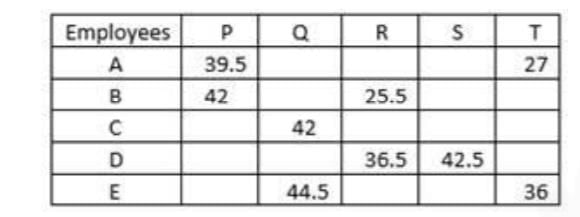
i.e. average age of A & P is given as (A+P)/2=39.5
What is the age of T?
Study the following information and answer the related questions.
P, Q, R, S, T, A, B, C, D and E are employees of a company. A table shows the average age of any two employees of the company. The average age of A and B is 27.5.
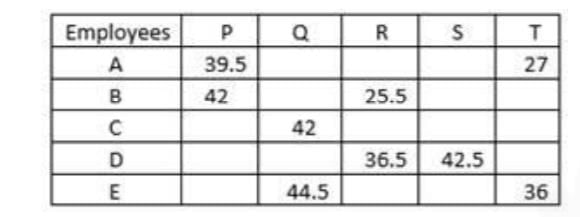
i.e. average age of A & P is given as (A+P)/2=39.5
What is the average age of D, R and S?
Study the following information and answer the related questions.
P, Q, R, S, T, A, B, C, D and E are employees of a company. A table shows the average age of any two employees of the company. The average age of A and B is 27.5.
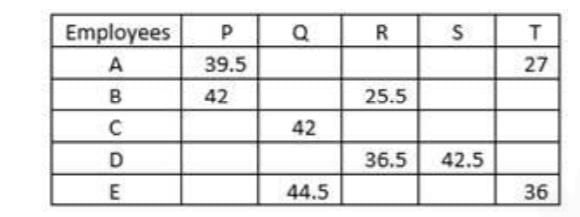
i.e. average age of A & P is given as (A+P)/2=39.5
What is the ratio of ages of Q and E?
Study the following information and answer the related questions.
P, Q, R, S, T, A, B, C, D and E are employees of a company. A table shows the average age of any two employees of the company. The average age of A and B is 27.5.
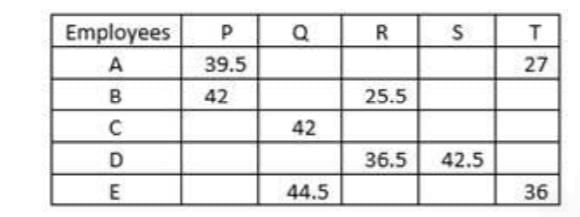
i.e. average age of A & P is given as (A+P)/2=39.5
What will be the average of sum of ages of A, B, C, D and E together after five years?
Study the following information and answer the related questions.
P, Q, R, S, T, A, B, C, D and E are employees of a company. A table shows the average age of any two employees of the company. The average age of A and B is 27.5.
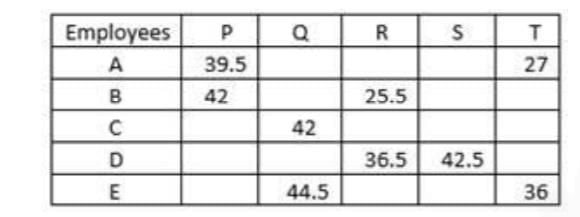
i.e. average age of A & P is given as (A+P)/2=39.5
If age of P and Q is decreased by 50% and age of A and B is increased by 20%, what will be the ratio of ages of P, Q, R, S and T together to the ages of A, B, C, D and E together?


