


All Exams >
Class 10 >
6 Months Boards Preparation for Class 10 (CBSE) >
All Questions
All questions of Statistics for Class 10 Exam
Find out the mode of the following data: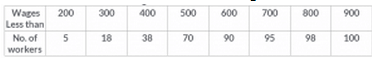
- a)450
- b)400
- c)600
- d)478
Correct answer is option 'A'. Can you explain this answer?
Find out the mode of the following data:
a)
450
b)
400
c)
600
d)
478

|
Rohini Seth answered |
The mode of a set of data values is the value that appears most often .So mode is the most occurrence of observation.
Converting the distribution in continuous grouped and applying the formula
Mode=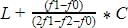
Modal class is 400-500
Where L=lower limit of the modal class =400
f1= modal class frequency=32
f2 = just after the modal class frequency=20
f0 = just previous the modal class frequency=20
C = Class size=100
Mode=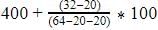
=400+50=450

The mean of all the factors of 24 is- a)7.5
- b)24
- c)7
- d)none of these
Correct answer is option 'A'. Can you explain this answer?
The mean of all the factors of 24 is
a)
7.5
b)
24
c)
7
d)
none of these

|
EduRev Class 10 answered |
To find the mean of all the factors of 24:
- List the factors of 24: 1, 2, 3, 4, 6, 8, 12, 24.
- Sum the factors: (1 + 2 + 3 + 4 + 6 + 8 + 12 + 24 = 60).
- Count the factors: There are 8 factors.
- Calculate the mean: Sum of the factors/ number of the factors = 60/8 = 7.5
Thus, the mean of all the factors is 7.5. The correct answer is A: 7.5.
The mean of 1, 2, 3, 4 …n is given by- a)

- b)n/2
- c)

- d)

Correct answer is option 'D'. Can you explain this answer?
The mean of 1, 2, 3, 4 …n is given by
a)
b)
n/2
c)
d)
|
|
Krishna Iyer answered |
⇒ We have the sequence, 1,2,3.......n
⇒ This is an AP, with the initial term a=1 and the common difference d=1.
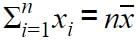
∴ The sum of n terms of an AP is given by,
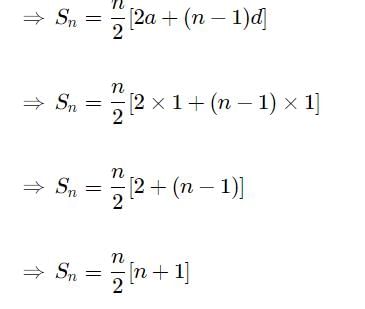
→ Arithmetic mean of n numbers a1,a2,a3,a4,...an is given by the formula
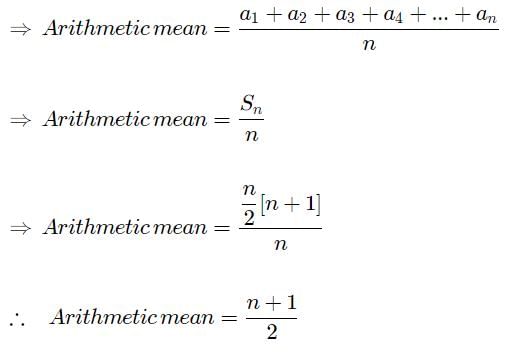
⇒ This is an AP, with the initial term a=1 and the common difference d=1.
∴ The sum of n terms of an AP is given by,
→ Arithmetic mean of n numbers a1,a2,a3,a4,...an is given by the formula
The mean of the first 10 natural numbers is- a)5
- b)6
- c)4.5
- d)5.5
Correct answer is option 'D'. Can you explain this answer?
The mean of the first 10 natural numbers is
a)
5
b)
6
c)
4.5
d)
5.5
|
|
Pooja Shah answered |
The first 10 natural numbers are 1, 2, 3, 4, 5, 6, 7, 8, 9 and 10.
Mean = Sum of Observations/Total No of Observations
Mean = 1 + 2 + 3 + 4 + 5 + 6 + 7 + 8 + 9 + 10 ÷ 10
Mean = 55/10
Mean = 5.5
Mean = Sum of Observations/Total No of Observations
Mean = 1 + 2 + 3 + 4 + 5 + 6 + 7 + 8 + 9 + 10 ÷ 10
Mean = 55/10
Mean = 5.5
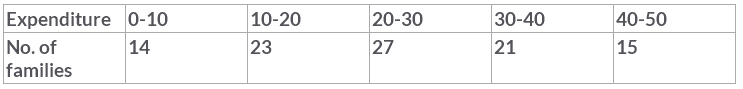 What is the mode of the given data?
- a)24
- b)21
- c)22
- d)25
Correct answer is option 'A'. Can you explain this answer?
What is the mode of the given data?
a)
24
b)
21
c)
22
d)
25

|
Skyhigh Academy answered |
Mode= 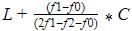
Where L=lower limit of the modal class =20
f1= modal class frequency.=27
f2 = just after the modal class frequency.=21
f0 = just previous the modal class frequency=23
C = Class size=10
Mode=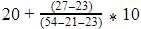
=20+4=24
Where L=lower limit of the modal class =20
f1= modal class frequency.=27
f2 = just after the modal class frequency.=21
f0 = just previous the modal class frequency=23
C = Class size=10
Mode=
=20+4=24
The arithmetic mean of a set of 40 values is 65. If each of the 40 values is increased by 5, what will be the mean of the set of new values:- a)50
- b)60
- c)70
- d)none of these
Correct answer is option 'C'. Can you explain this answer?
The arithmetic mean of a set of 40 values is 65. If each of the 40 values is increased by 5, what will be the mean of the set of new values:
a)
50
b)
60
c)
70
d)
none of these
|
|
Arun Sharma answered |
We have mean = 
Mean =
Now each value is increased by 5
Mean =
+5=65+5=70
Hence the mean is 70
Mean =
Now each value is increased by 5
Mean =
+5=65+5=70
Hence the mean is 70
The mean of the first 10 prime numbers is- a)12.9
- b)1.29
- c)129
- d)none of these
Correct answer is option 'A'. Can you explain this answer?
The mean of the first 10 prime numbers is
a)
12.9
b)
1.29
c)
129
d)
none of these

|
Let's Tute answered |
Step-by-step explanation:mean=2+3+5+7+11+13+17+19+23+29/10
Mean=129/10
Mean=12.9
If mean = (3 median - mode). k, then the value of k is- a)1
- b)2
- c)1/2
- d)3/2
Correct answer is option 'C'. Can you explain this answer?
If mean = (3 median - mode). k, then the value of k is
a)
1
b)
2
c)
1/2
d)
3/2
|
|
Kiran Mehta answered |
∵ Mode = 3 median - 2 mean
⇒ 2 mean = 3 m edian - mode

⇒ 2 mean = 3 m edian - mode
The age of 18 students of a class is reported below. Their modal age is 10, 17, 14, 10, 11, 12, 12, 13, 17, 13, 14, 14, 15, 16, 17, 15, 17, 16- a)22 years
- b)17 years
- c)14 years
- d)16 years
Correct answer is option 'B'. Can you explain this answer?
The age of 18 students of a class is reported below. Their modal age is 10, 17, 14, 10, 11, 12, 12, 13, 17, 13, 14, 14, 15, 16, 17, 15, 17, 16
a)
22 years
b)
17 years
c)
14 years
d)
16 years
|
|
Gaurav Kumar answered |
Mode is the highest number of times an observation occurs, which means the number that appears most frequently in a set. So modal age is the age which occurs maximum number of times. It is evident that 17 occurs most of the times. So, modal age is 17 years.
The mean of 15 numbers is 25. If each number is multiplied by 4, mean of the new numbers is- a)100
- b)40
- c)10
- d)60
Correct answer is option 'A'. Can you explain this answer?
The mean of 15 numbers is 25. If each number is multiplied by 4, mean of the new numbers is
a)
100
b)
40
c)
10
d)
60
|
|
Anmol Das answered |
Answer:
100
Step-by-step explanation:
mean=25
every number is multiplied by 4,
then 4 is common
Therefore, 25x4=100
The marks obtained by 9 students in Mathematics are 59, 46, 31, 23, 27, 44, 52, 40 and 29. The mean of the data is- a)37
- b)38
- c)39
- d)40
Correct answer is option 'C'. Can you explain this answer?
The marks obtained by 9 students in Mathematics are 59, 46, 31, 23, 27, 44, 52, 40 and 29. The mean of the data is
a)
37
b)
38
c)
39
d)
40
|
|
Avinash Patel answered |
The mean is the average of the numbers.
So, Mean =
Mean=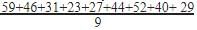 351/9=39
So, Mean =
Mean=
351/9=39The mean of five numbers is 28. If one of the numbers is excluded, the mean gets reduced by 2. The excluded number is- a)45
- b)36
- c)30
- d)25
Correct answer is option 'B'. Can you explain this answer?
The mean of five numbers is 28. If one of the numbers is excluded, the mean gets reduced by 2. The excluded number is
a)
45
b)
36
c)
30
d)
25
|
|
Vikas Kumar answered |
Mean of 5 nos.= 28
Therefore, sum of the 5 nos. = 28 * 5 = 140
The the no. exclude by 'x'.
New sum of 4 nos.= 140 - x
New mean = 28- 2 = 26
Therefore, (140 - x ) / 4 = 26
=> 140 - x = 104
=> x = 36
ANSWER= 36
The mean of the following data 12, 22, 32,.......n2 is –- a)(n+1)(2n+1)/6
- b)n(n – 1)(2n+1)/6
- c)n(n+1)(2n – 1)/6
- d)n(n – 1)(2n – 1)/6
Correct answer is option 'A'. Can you explain this answer?
The mean of the following data 12, 22, 32,.......n2 is –
a)
(n+1)(2n+1)/6
b)
n(n – 1)(2n+1)/6
c)
n(n+1)(2n – 1)/6
d)
n(n – 1)(2n – 1)/6
|
|
Lighτ Yαmɪ answered |
Sum of Series 1²+2²+3²+….+n² = n(n+1)(2n+1)/6
[as, (1+2+3+4+…..n) = n(n+1) / 2
Using the identity: a^3 -b^3 = (a-b)(a² +ab +b²)
We get, x^3 -(x-1)^3 = 3x² -3x +1 , by putting x = 1,2,3…n
We get,
1^3 - 0^3 = 3×1² - 3×1 + 1
2^3 -1^3 = 3×2² - 3×2 +1
3^3 - 2^3 = 3×3² - 3×3 +1
…..
n^3 - (n-1)^3 = 3*n² - 3n +1
By adding LHS up to x=3
1^3–0^3 + 2^3–1^3 + 3^3–2^3 = 3^3 -0^3
So by adding LHS up to x= n
We get, n^3 - 0^3 …….. LHS
Now by adding RHS =
3( 1²+2²+3² +…n²) - 3( 1+2+3+….n) + n
=3(1²+2²+3²+..n²) = n^3 +3(1+2+3+…n) -n
=(1² +2²+3²+..n²) = 1/3 [n^3 +(3 n(n+1)/2) - n]
=(1²+2² +3² +..n²) = 1/3 [ (2n^3 +3n²+3n - 2n) /2 ]
= (1²+2²+3²+..n²) = ( 2n^3 +3n² +n) /6
=n (n+1)(2n+1) /6]
mean=sum/number of terms
=n(n+1)(2n+1)/6×n
=(n+1) (2n+1) /6
Hence, option A is correct
The mean of the following data is: 45, 35, 20, 15, 25, 40- a)15
- b)25
- c)30
- d)35
Correct answer is option 'C'. Can you explain this answer?
The mean of the following data is: 45, 35, 20, 15, 25, 40
a)
15
b)
25
c)
30
d)
35
|
|
Pankaj verma answered |
Mean of Data Set
To find the mean of a data set, we add up all the numbers in the set and then divide by the total number of values in the set.
Calculation
To find the mean of the given data set, we need to add up all the numbers in the set and then divide by the total number of values in the set:
Mean = (45 + 35 + 20 + 15 + 25 + 40) / 6
Mean = 180 / 6
Mean = 30
Therefore, the mean of the given data set is 30. The correct answer is option C.
The mean of following distribution is –
- a)18.50
- b)18.05
- c)18.15
- d)18.25
Correct answer is option 'B'. Can you explain this answer?
The mean of following distribution is –
a)
18.50
b)
18.05
c)
18.15
d)
18.25
|
|
Ræjû Bhæï answered |
B option sahi hi n.. Bss isme khuss raho.. Aur explain chaiye toh subh ko fir milenge abhi sone ja rha hu.
The marks obtained by 9 students in Mathematics are 59, 46, 31, 23, 27, 40, 52, 35 and 29. The mean of the data is- a)23
- b)30
- c)38
- d)41
Correct answer is option 'C'. Can you explain this answer?
The marks obtained by 9 students in Mathematics are 59, 46, 31, 23, 27, 40, 52, 35 and 29. The mean of the data is
a)
23
b)
30
c)
38
d)
41
|
|
Pooja Shah answered |
The mean is the average of the numbers.
So, Mean =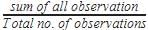
Mean= =342/9=38
So, Mean =
Mean=
=342/9=38Practice Test/Quiz or MCQ (Multiple Choice Questions) with Solutions of Chapter "Statistics" are available for CBSE Class 10 Mathematics (Maths) and have been compiled as per the syllabus of CBSE Class 10 Mathematics (Maths) Q. Which of the following is a measure of central tendency?- a)Frequency
- b)Cumulative frequency
- c)Mean
- d)Class limit
Correct answer is option 'C'. Can you explain this answer?
Practice Test/Quiz or MCQ (Multiple Choice Questions) with Solutions of Chapter "Statistics" are available for CBSE Class 10 Mathematics (Maths) and have been compiled as per the syllabus of CBSE Class 10 Mathematics (Maths)
Q. Which of the following is a measure of central tendency?
a)
Frequency
b)
Cumulative frequency
c)
Mean
d)
Class limit
|
|
Rahul Kapoor answered |
There are three main measures of central tendency: the mode, the median and the mean. Each of these measures describes a different indication of the typical or central value in the distribution. The mode is the most commonly occurring value in a distribution.
The mean of the first 10 multiples of 6 is- a)3.3
- b)33
- c)34
- d)none of these
Correct answer is option 'B'. Can you explain this answer?
The mean of the first 10 multiples of 6 is
a)
3.3
b)
33
c)
34
d)
none of these
|
|
Komal nayar answered |
Mean of First 10 Multiples of 6
To find the mean of the first 10 multiples of 6, we need to add the first 10 multiples of 6 and divide by 10.
Multiples of 6: 6, 12, 18, 24, 30, 36, 42, 48, 54, 60
Addition: 6 + 12 + 18 + 24 + 30 + 36 + 42 + 48 + 54 + 60 = 330
Mean: 330/10 = 33
Therefore, the correct answer is option B, 33.
To find the mean of the first 10 multiples of 6, we need to add the first 10 multiples of 6 and divide by 10.
Multiples of 6: 6, 12, 18, 24, 30, 36, 42, 48, 54, 60
Addition: 6 + 12 + 18 + 24 + 30 + 36 + 42 + 48 + 54 + 60 = 330
Mean: 330/10 = 33
Therefore, the correct answer is option B, 33.


Mode is not affected by- a)Maximum value
- b)Minimum value
- c)Extreme values
- d)All of the above
Correct answer is option 'D'. Can you explain this answer?
Mode is not affected by
a)
Maximum value
b)
Minimum value
c)
Extreme values
d)
All of the above
|
|
Krishna Iyer answered |
The mode of a set of data values is the value that appears most often.it is the value that is most likely to be sampled This means mode is the observations whose frequency is highest. So it does not pay attention to what is the maximum value or the minimum value . So it is not affected either by maximum or minimum values and its not affected by both as well.
The mean of a data set with 12 observations is calculated as 19.25. If one more value is included in the data, then for the new data with 13 observations, mean becomes 20. Value of this 13th observation is- a)28
- b)29
- c)31
- d)30
Correct answer is option 'B'. Can you explain this answer?
The mean of a data set with 12 observations is calculated as 19.25. If one more value is included in the data, then for the new data with 13 observations, mean becomes 20. Value of this 13th observation is
a)
28
b)
29
c)
31
d)
30
|
|
Anita Menon answered |
Suppose be all twelevth terms = x
Mean = Terms / Observation
19 . 25 = x / 12
x = 19.25 × 12
x = 231 .00
Now let thirteenth term will be y
Mean = 20
So, 20 = x + y / 13
20 = 231 + y / 13
20 × 13 = 231 + x
260 = 231 + x
260 - 231 = x
29 = x
Mean = Terms / Observation
19 . 25 = x / 12
x = 19.25 × 12
x = 231 .00
Now let thirteenth term will be y
Mean = 20
So, 20 = x + y / 13
20 = 231 + y / 13
20 × 13 = 231 + x
260 = 231 + x
260 - 231 = x
29 = x
The class mark of the class 15.5 - 20.5
- a)15.5
- b)20.5
- c)18
- d)5
Correct answer is option 'C'. Can you explain this answer?
The class mark of the class 15.5 - 20.5
a)
15.5
b)
20.5
c)
18
d)
5

|
Crafty Classes answered |
class mark= (upper limit+lower limit)/2
= (15.5+20.5)/2
=36/2
=18
= (15.5+20.5)/2
=36/2
=18
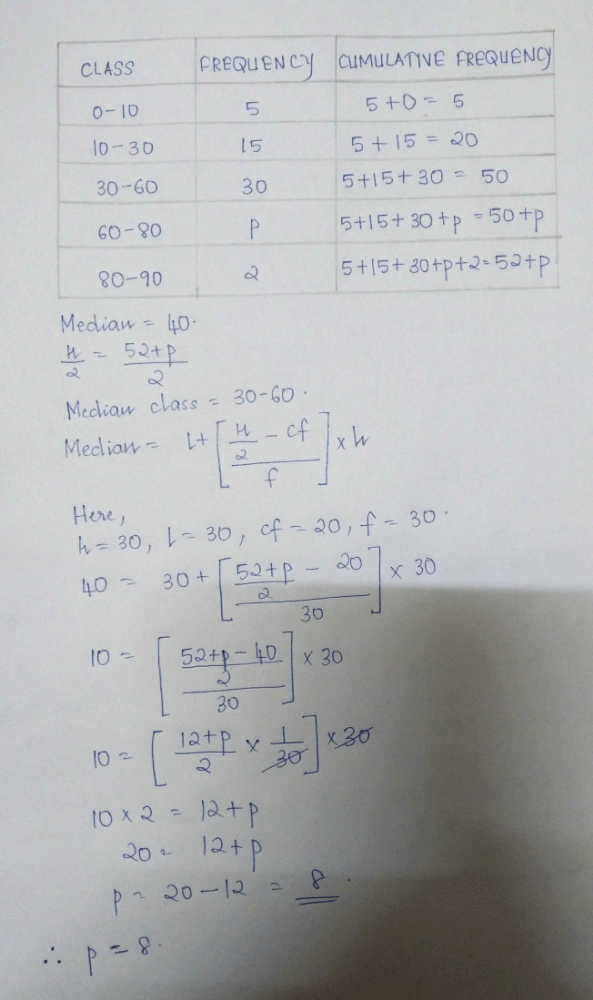
The lower limit of the modal class of the following data is:
- a)10
- b)20
- c)30
- d)50
Correct answer is option 'B'. Can you explain this answer?
The lower limit of the modal class of the following data is:
a)
10
b)
20
c)
30
d)
50
|
|
Raghav Bansal answered |
Modal class is the interval which has the highest frequency ie, which occur most of the times.Here highest frequency is 13 in the class interval 20-30. So lower limit of the class interval is 20.
Which of the following is true –- a)Mode = 3Median + 2Mean
- b)Median = Mode +3/2[Mean – Median]
- c)Mean = Mode + 3/2[Median – Mode]
- d)Median = Mode + 3/2[Median + Mode]
Correct answer is option 'C'. Can you explain this answer?
Which of the following is true –
a)
Mode = 3Median + 2Mean
b)
Median = Mode +3/2[Mean – Median]
c)
Mean = Mode + 3/2[Median – Mode]
d)
Median = Mode + 3/2[Median + Mode]
|
|
Amit Sharma answered |
Mean = Mode + 3/2 [Median – Mode]
Mean= Mode+3/2 Median-3/2Mode
2 Mean=2 Mode+3 Median-3 Mode
3 Median=2 Mean + Mode
So C is the correct answer.
Mean= Mode+3/2 Median-3/2Mode
2 Mean=2 Mode+3 Median-3 Mode
3 Median=2 Mean + Mode
So C is the correct answer.
Mode and mean of a data are 12k and 15k. Median of the data is- a)12k
- b)14k
- c)15k
- d)16k
Correct answer is option 'B'. Can you explain this answer?
Mode and mean of a data are 12k and 15k. Median of the data is
a)
12k
b)
14k
c)
15k
d)
16k
|
|
Amit Kumar answered |
Here's the solution to your question:
If two values are given in the below formula than we can use the formula if one is given than we cannot use the formula
3median = 2mean+mode
3median = 2(15k)+12k
3median = 30k+12k
3median = 42k
median = 42k/3
median = 14k
You can understand all the concepts of Class 10 mathematics through the link:

The class marks of the class 18-22 is- a)4
- b)18
- c)22
- d)20
Correct answer is option 'D'. Can you explain this answer?
The class marks of the class 18-22 is
a)
4
b)
18
c)
22
d)
20
|
|
Harshit Agrawal answered |
We know that ,
Class Mark = upper limit + lower limit /2
--->. Class Mark = 22 + 18/2
--->. Class Mark = 40/2
--->. Class Mark = 20
Hence , option D is correct.
Class Mark = upper limit + lower limit /2
--->. Class Mark = 22 + 18/2
--->. Class Mark = 40/2
--->. Class Mark = 20
Hence , option D is correct.
The mean of the first 10 natural odd numbers is- a)9
- b)10
- c)11
- d)12
Correct answer is option 'B'. Can you explain this answer?
The mean of the first 10 natural odd numbers is
a)
9
b)
10
c)
11
d)
12
|
|
Ananya Das answered |
Natural numbers start from 1
First ten natural odd numbers=1,3,5,7,9,11,13,15,17,19
Mean =
So mean is 10.
First ten natural odd numbers=1,3,5,7,9,11,13,15,17,19
Mean =
So mean is 10.
The value of 
- a)

- b)

- c)

- d)

Correct answer is option 'C'. Can you explain this answer?
The value of
a)
b)
c)
d)
|
|
Arun Sharma answered |
We have Mean = 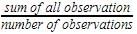
The mean of first ten even natural numbers is- a)100
- b)11
- c)30
- d)10
Correct answer is option 'B'. Can you explain this answer?
The mean of first ten even natural numbers is
a)
100
b)
11
c)
30
d)
10
|
|
Anmol Das answered |
Mean of First Ten Even Natural Numbers
To find the mean of the first ten even natural numbers, we need to add all the even numbers and divide the sum by the total number of even numbers. The first ten even natural numbers are:
2, 4, 6, 8, 10, 12, 14, 16, 18, 20
1. Add up the Even Numbers
Add up all the even numbers:
2 + 4 + 6 + 8 + 10 + 12 + 14 + 16 + 18 + 20 = 110
2. Divide the Sum by the Total Number of Even Numbers
Since there are 10 even numbers in the list, we divide the sum by 10:
110 ÷ 10 = 11
Therefore, the mean of the first ten even natural numbers is 11. Option 'B' is the correct answer.
Mean of 100 items is 49. It was discovered that three items which should have been 60, 70, 80 were wrongly read as 40, 20, 50 respectively. The correct mean is- a)48
- b)49
- c)50
- d)60
Correct answer is option 'C'. Can you explain this answer?
Mean of 100 items is 49. It was discovered that three items which should have been 60, 70, 80 were wrongly read as 40, 20, 50 respectively. The correct mean is
a)
48
b)
49
c)
50
d)
60
|
|
Ananya Das answered |
Sum of 100 observations = 100 x 49 = 4900
Correct sum = 4900 - [40 + 20 + 50] + [60 + 70 + 80] = 5000
∴ Correct mean = 5000/100 = 50
Correct sum = 4900 - [40 + 20 + 50] + [60 + 70 + 80] = 5000
∴ Correct mean = 5000/100 = 50
The modal class in the following frequency distribution is: 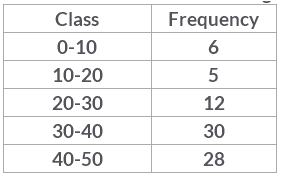
- a)40-50
- b)30-40
- c)20-30
- d)None of these
Correct answer is option 'B'. Can you explain this answer?
The modal class in the following frequency distribution is:
a)
40-50
b)
30-40
c)
20-30
d)
None of these
|
|
Raghav Bansal answered |
The modal class is the class with the highest frequency ie, the class which occurs the most. So,30-40 has frequency 30 which is the highest, therefore, 30-40 is the modal class.
The mean of 5 observations x, x + 2, x + 4, x + 6 and x + 8 is 11, then the value of x is:- a)6
- b)4
- c)7
- d)11
Correct answer is option 'C'. Can you explain this answer?
The mean of 5 observations x, x + 2, x + 4, x + 6 and x + 8 is 11, then the value of x is:
a)
6
b)
4
c)
7
d)
11
|
|
Krishna Iyer answered |
(x + x + 2 + x + 4 + x + 6 + x + 8) / 5 = 11
5x + 20 = 55
5x = 35 ⇒ x = 7
5x + 20 = 55
5x = 35 ⇒ x = 7
The mean of first 10 composite numbers is- a)11.2
- b)12.2
- c)11.4
- d)none of these
Correct answer is option 'A'. Can you explain this answer?
The mean of first 10 composite numbers is
a)
11.2
b)
12.2
c)
11.4
d)
none of these
|
|
Harshit Agrawal answered |
First 10 composite numbers are :
4, 6, 8, 9, 10, 12, 14, 15, 16, 18.
Mean = Sum of all observations ÷ Total no: of observations.
Sum of all observations = 4 + 6 + 8 + 9 + 1 0 +12 + 1 4 +15+ 16 + 18 = 112
Total no : of observations : 10
Mean = 112 / 10
= 11.2
4, 6, 8, 9, 10, 12, 14, 15, 16, 18.
Mean = Sum of all observations ÷ Total no: of observations.
Sum of all observations = 4 + 6 + 8 + 9 + 1 0 +12 + 1 4 +15+ 16 + 18 = 112
Total no : of observations : 10
Mean = 112 / 10
= 11.2
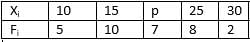

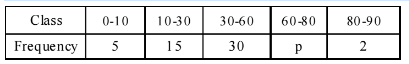
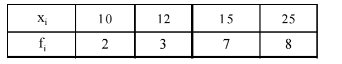
The mean of the following data is 18.75 then the value of p is –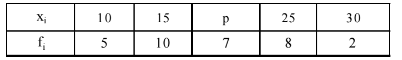
- a)21
- b)20.6
- c)20
- d)22
Correct answer is option 'C'. Can you explain this answer?
The mean of the following data is 18.75 then the value of p is –
a)
21
b)
20.6
c)
20
d)
22
|
|
King Kong answered |
C is right answer
by applying formula you will find your answer
by applying formula you will find your answer
The graphical representation of a cumulative frequency distribution is called- a)Bar graph
- b)Histogram
- c)Frequency polygon
- d)Ogive
Correct answer is option 'D'. Can you explain this answer?
The graphical representation of a cumulative frequency distribution is called
a)
Bar graph
b)
Histogram
c)
Frequency polygon
d)
Ogive
|
|
Anjana Khatri answered |
The graphical representation of a cumulative frequency distribution is called an ogive.
An ogive is a graph that plots the cumulative frequency of a set of data on the y-axis and the data values on the x-axis. It is used to represent the distribution of continuous data and is shaped like a curve.
A frequency polygon is also a graph that represents the frequency distribution of a set of data, but it is shaped like a polygon with straight lines connecting the data points. A bar graph is a graph that uses bars to represent the frequencies or counts of a set of data, and a histogram is a graph that represents the frequency distribution of continuous data using bars.
Construction of a cumulative frequency table is useful in determining the- a)mean
- b)median
- c)mode
- d)all of the above
Correct answer is option 'B'. Can you explain this answer?
Construction of a cumulative frequency table is useful in determining the
a)
mean
b)
median
c)
mode
d)
all of the above
|
|
Girish mehra answered |
The correct answer is b
A cumulative frequency table helps to determine the median of the series.
The mean of 25 observations is 36. If the mean of first 13 observations is 32 and that of the last 13 observations is 39, then the 13th observation is- a)13
- b)23
- c)26
- d)32
Correct answer is option 'B'. Can you explain this answer?
The mean of 25 observations is 36. If the mean of first 13 observations is 32 and that of the last 13 observations is 39, then the 13th observation is
a)
13
b)
23
c)
26
d)
32
|
|
Rohan Kapoor answered |
Mean of 25 observation = 36
Sum of 25 observations = 36 x 25 = 900
Mean of first 13 observations = 32
Sum of first 13 observations = 32 x 13 = 416
Mean of last 13 observations = 39
Sum of last 13 observations= 39 x 13 = 507
13th observation = (416 + 507) - 900
13th observation= 923 - 900
So, 13th observation = 23
In the formula, Mode 
- a)frequency of the modal class
- b)frequency of the second class
- c)frequency of the class preceding the modal class
- d)frequency of the class succeeding the modal class
Correct answer is option 'D'. Can you explain this answer?
In the formula, Mode
a)
frequency of the modal class
b)
frequency of the second class
c)
frequency of the class preceding the modal class
d)
frequency of the class succeeding the modal class
|
|
Crafty Classes answered |
The formula to find the mode of the grouped data is: Mode = l + [(f1-f0)/(2f1-f0-f2)]×h. Where, l = lower class limit of modal class, h = class size, f1 = frequency of modal class, f0 = frequency of class proceeding to modal class, f2 = frequency of class succeeding to modal class.
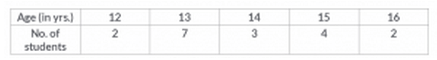 Modal age of students in given distribution is
- a)14 years
- b)12 years
- c)13 years
- d)15 years
Correct answer is option 'C'. Can you explain this answer?
Modal age of students in given distribution is
a)
14 years
b)
12 years
c)
13 years
d)
15 years
|
|
Amit Sharma answered |
Mode is the most frequently occurring observation. Since it's not a grouped data the frequency is the occurrence of only one observation , So the highest no. of frequency is 7 . So the modal age is 13.
While computing mean of a grouped data, we assume that the frequencies are- a)centered at the lower limits of the classes
- b)centered at the upper limits of the classes
- c)centered at the class marks of the classes
- d)evenly distributed over all the classes
Correct answer is option 'C'. Can you explain this answer?
While computing mean of a grouped data, we assume that the frequencies are
a)
centered at the lower limits of the classes
b)
centered at the upper limits of the classes
c)
centered at the class marks of the classes
d)
evenly distributed over all the classes

|
Kds Coaching answered |
- When computing the mean of grouped data, we assume that the frequencies are centered at the class marks of the classes.
- This means that each frequency is associated with the midpoint of its respective class interval.
- Using the class marks allows for an accurate calculation of the mean by multiplying each class mark by its frequency, summing these products, and then dividing by the total frequency.
The mode of 12, 17, 16, 14, 13, 16, 11, 14 is- a)13
- b)11
- c)14
- d)14 and 16
Correct answer is option 'D'. Can you explain this answer?
The mode of 12, 17, 16, 14, 13, 16, 11, 14 is
a)
13
b)
11
c)
14
d)
14 and 16
|
|
Sahana dasgupta answered |
To find the mode of a set of numbers, we need to determine the number(s) that appear most frequently in the set. In this case, the set of numbers is 12, 17, 16, 14, 13, 16, 11, and 14.
**Step 1: Arrange the numbers in ascending order:**
11, 12, 13, 14, 14, 16, 16, 17
**Step 2: Count the frequency of each number:**
11 appears once
12 appears once
13 appears once
14 appears twice
16 appears twice
17 appears once
**Step 3: Determine the number(s) with the highest frequency:**
In this case, the numbers 14 and 16 appear most frequently, each occurring twice. Therefore, the mode of the set is 14 and 16.
However, the options provided are a)13, b)11, c)14, and d)14 and 16. The correct answer is option d)14 and 16 because both numbers have the highest frequency in the set.
Therefore, the mode of the given set of numbers 12, 17, 16, 14, 13, 16, 11, and 14 is 14 and 16.
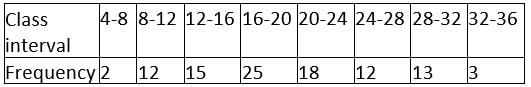
For the following distribution the modal class is
- a)30-40
- b)40-50
- c)20-30
- d)10-20
Correct answer is option 'B'. Can you explain this answer?
For the following distribution the modal class is
a)
30-40
b)
40-50
c)
20-30
d)
10-20
|
|
EduRev Class 10 answered |
To find the modal class from a given frequency distribution, we look for the class interval with the highest frequency. The class interval with the highest frequency is referred to as the modal class.
In the provided distribution, we have cumulative frequencies, so we need to first determine the frequency of each class interval. To do this, we subtract the cumulative frequency of the preceding class from the cumulative frequency of the current class.
Here are the cumulative frequencies provided for each class:
- Marks below 10: 2 students
- Marks below 20: 11 students
- Marks below 30: 25 students
- Marks below 40: 45 students
- Marks below 50: 67 students
- Marks below 60: 75 students
Now let's calculate the frequency for each class interval:
- 10-20: 11−2=911−2=9
- 20-30: 25−11=1425−11=14
- 30-40: 45−25=2045−25=20
- 40-50: 67−45=2267−45=22
- 50-60: 75−67=875−67=8
The class interval with the highest frequency is 40-50 with 22 students, making it the modal class. Therefore, the correct answer is option 2: 40-50.
Chapter doubts & questions for Statistics - 6 Months Boards Preparation for Class 10 (CBSE) 2025 is part of Class 10 exam preparation. The chapters have been prepared according to the Class 10 exam syllabus. The Chapter doubts & questions, notes, tests & MCQs are made for Class 10 2025 Exam. Find important definitions, questions, notes, meanings, examples, exercises, MCQs and online tests here.
Chapter doubts & questions of Statistics - 6 Months Boards Preparation for Class 10 (CBSE) in English & Hindi are available as part of Class 10 exam.
Download more important topics, notes, lectures and mock test series for Class 10 Exam by signing up for free.
6 Months Boards Preparation for Class 10 (CBSE)
344 videos|2427 docs|372 tests
|
|
© EduRev
|
Education Revolution
|


|


Signup to see your scores
go up within 7 days!
Access 1000+ FREE Docs, Videos and Tests
Takes less than 10 seconds to signup