


All Exams >
UPSC >
CSAT Preparation >
All Questions
All questions of Statistics for UPSC CSE Exam
Statistics are aggregates of______________- a)Methods
- b)Calculations
- c)Facts
- d)Data
Correct answer is option 'D'. Can you explain this answer?
Statistics are aggregates of______________
a)
Methods
b)
Calculations
c)
Facts
d)
Data
|
|
Utkarsh Joshi answered |
Statistics is a branch of mathematics that deals with the collection, analysis, interpretation, presentation, and organization of data. Data is the raw information or facts that are collected from various sources, such as surveys, experiments, observations, or databases.
Statistics take this raw data and transform it into meaningful information by applying various methods and calculations. These methods and calculations include techniques for summarizing and describing data, making inferences or predictions, testing hypotheses, and drawing conclusions.
While methods and calculations are used in the field of statistics, they are tools or techniques employed to analyze and process the data. They are not the aggregates themselves. Similarly, facts are individual pieces of information, whereas statistics involve the systematic and structured analysis of data to draw broader conclusions or make generalizations.
Therefore, statistics are aggregates of data. Data forms the foundation of statistical analysis, and statistics provide insights, summaries, and interpretations of the data, enabling us to better understand and draw conclusions about the phenomena or populations being studied.

Which mean is most affected by extreme values?- a)Geometric Mean
- b)Harmonic Mean
- c)Arithmetic mean
- d)Trimmed Mean
Correct answer is option 'C'. Can you explain this answer?
Which mean is most affected by extreme values?
a)
Geometric Mean
b)
Harmonic Mean
c)
Arithmetic mean
d)
Trimmed Mean
|
|
Vandana Deshpande answered |
Arithmetic Mean is most affected by extreme values
Arithmetic Mean is the sum of all values in a dataset divided by the number of values. Extreme values can significantly impact the arithmetic mean because they have a disproportionate effect on the total sum.
Extreme values can skew the arithmetic mean in one direction, pulling it towards the extreme value. This can lead to a misleading representation of the central tendency of the dataset.
Comparing with other means:
- Geometric Mean: Geometric Mean is less affected by extreme values because it involves multiplying all values in the dataset. Extreme values have less impact on the overall product compared to the sum in arithmetic mean.
- Harmonic Mean: Harmonic Mean is also less affected by extreme values as it considers the reciprocal of the values. Extreme values have a balancing effect on the harmonic mean.
- Trimmed Mean: Trimmed Mean is specifically designed to reduce the impact of extreme values. It involves removing a certain percentage of extreme values from both ends of the dataset before calculating the mean.
In conclusion, the Arithmetic Mean is most affected by extreme values compared to other means. It is important to consider the nature of the dataset and the presence of extreme values when choosing the appropriate mean for analysis.
The measures of dispersion are changed by the change of__________.- a)Scale
- b)Origin
- c)Unit
- d)None of these
Correct answer is option 'A'. Can you explain this answer?
The measures of dispersion are changed by the change of__________.
a)
Scale
b)
Origin
c)
Unit
d)
None of these
|
|
Muskaan Chopra answered |
The correct answer is option 'A': Scale.
Explanation:
When we talk about measures of dispersion, we are referring to statistical measures that describe how spread out or dispersed a set of data points are. These measures provide information about the variability or spread of the data. The measures of dispersion include range, variance, standard deviation, and mean deviation.
One of the factors that can affect the measures of dispersion is the scale of measurement. Scale refers to the units in which the data is measured. It can be nominal, ordinal, interval, or ratio.
- Nominal scale: This is the simplest form of measurement where data is categorized into distinct categories or groups. The scale does not have any inherent order or numerical value. For example, colors or categories like male/female.
- Ordinal scale: This scale allows data to be ranked or ordered based on some criteria. However, the differences between the categories are not necessarily equal. For example, ratings such as excellent, good, fair, poor.
- Interval scale: This scale has equal intervals between the categories, but there is no true zero point. For example, temperature measured in degrees Celsius or Fahrenheit. A change in the scale (e.g., from Celsius to Fahrenheit) would not affect the measures of dispersion.
- Ratio scale: This scale has equal intervals between the categories, and it also has a true zero point. For example, height, weight, or time. A change in the scale (e.g., from centimeters to inches) would affect the measures of dispersion.
When we change the scale of measurement, it can impact the measures of dispersion. This is because the units or intervals between the data points may change, leading to different values for range, variance, standard deviation, or mean deviation.
For example, let's consider a dataset of heights measured in centimeters. If we convert the scale to meters, the range, variance, standard deviation, and mean deviation will all be affected. The range will change from centimeters to meters, and the variance, standard deviation, and mean deviation will be divided by 100. This is because the change in scale affects the spread of the data and the units in which it is measured.
Therefore, it is important to consider the scale of measurement when interpreting and comparing measures of dispersion.
The appropriate average for calculating average percentage increase in population is____________.- a)Arithmetic Mean
- b)Harmonic Mean
- c)Mode
- d)Geometric Mean
Correct answer is option 'D'. Can you explain this answer?
The appropriate average for calculating average percentage increase in population is____________.
a)
Arithmetic Mean
b)
Harmonic Mean
c)
Mode
d)
Geometric Mean
|
|
Niharika Chakraborty answered |
The appropriate average for calculating the average percentage increase in population is the Geometric Mean.
Geometric Mean:
The geometric mean is a type of average that is calculated by taking the nth root of the product of n numbers. It is often used when dealing with growth rates, ratios, and percentages. In the case of calculating the average percentage increase in population, the geometric mean is the most appropriate choice because it takes into account the compounding effect of growth over time.
Explanation:
When calculating the average percentage increase in population, it is important to consider the compounding effect of growth. The geometric mean takes into account the fact that population growth is not linear, but rather exponential. It captures the proportional change in population over a given time period, which is essential when analyzing population growth.
Example:
Let's say we have the following population data for a city over a 5-year period:
Year 1: 100,000
Year 2: 120,000
Year 3: 144,000
Year 4: 172,800
Year 5: 207,360
To calculate the average percentage increase in population, we can use the geometric mean. Here's how it's done:
1. Calculate the percentage increase in population for each year by dividing the population of each year by the population of the previous year and subtracting 1:
Year 2: (120,000 - 100,000)/100,000 = 0.2 = 20%
Year 3: (144,000 - 120,000)/120,000 = 0.2 = 20%
Year 4: (172,800 - 144,000)/144,000 = 0.2 = 20%
Year 5: (207,360 - 172,800)/172,800 = 0.2 = 20%
2. Take the product of these percentage increases:
0.2 * 0.2 * 0.2 * 0.2 = 0.0016
3. Take the fifth root of this product to get the average percentage increase:
(0.0016)^(1/5) ≈ 0.2 = 20%
The average percentage increase in population over the 5-year period is approximately 20%.
If mean and mode of some data are 4 & 10 respectively, its median will be:- a)1.5
- b)5.3
- c)16
- d)6
Correct answer is option 'D'. Can you explain this answer?
If mean and mode of some data are 4 & 10 respectively, its median will be:
a)
1.5
b)
5.3
c)
16
d)
6
|
|
Utkarsh Joshi answered |
Concept:
Mean: The mean or average of a data set is found by adding all numbers in the data set and then dividing by the number of values in the set.
Mode: The mode is the value that appears most frequently in a data set.
Median: The median is a numeric value that separates the higher half of a set from the lower half.
Relation b/w mean, mode and median:
Mode = 3(Median) - 2(Mean)
Calculation:
Given that,
mean of data = 4 and mode of data = 10
We know that
Mode = 3(Median) - 2(Mean)
⇒ 10 = 3(median) - 2(4)
⇒ 3(median) = 18
⇒ median = 6
Hence, the median of data will be 6.
Which of the following cannot be less than zero (negative)?- a)Median
- b)Geometric Mean
- c)Arithmetic Mean
- d)Harmonic Mean
Correct answer is option 'B'. Can you explain this answer?
Which of the following cannot be less than zero (negative)?
a)
Median
b)
Geometric Mean
c)
Arithmetic Mean
d)
Harmonic Mean
|
|
Tanishq Sarkar answered |
Understanding the Means
In statistics, different types of means are used to analyze data, each with unique properties. Here’s an overview of the four means mentioned:
Median
- The median is the middle value in a sorted list of numbers.
- It can be zero or positive, but never negative if all data points are non-negative.
Arithmetic Mean
- The arithmetic mean is calculated by summing all values and dividing by the count.
- Like the median, it can be zero or positive, depending on the data, but cannot be negative if all values are non-negative.
Harmonic Mean
- The harmonic mean is defined as the reciprocal of the average of the reciprocals of the data values.
- It can be zero or positive but cannot be negative if all values are non-negative.
Geometric Mean
- The geometric mean is the nth root of the product of n values.
- Importantly, it cannot be less than zero; it is defined only for non-negative values. If any value is negative, the geometric mean becomes imaginary or undefined.
Conclusion
Thus, the correct answer is option 'B': the Geometric Mean cannot be less than zero. It strictly requires all input values to be non-negative. If any input is negative, the geometric mean is invalidated, reinforcing that it cannot assume negative values.
If mean is less than mode, the distribution will be__________.- a)Positively skewed
- b)Negatively skewed
- c)Symmetrical
- d)None of these
Correct answer is option 'B'. Can you explain this answer?
If mean is less than mode, the distribution will be__________.
a)
Positively skewed
b)
Negatively skewed
c)
Symmetrical
d)
None of these
|
|
Sonal Gupta answered |
Introduction:
In statistics, skewness is a measure of the asymmetry of a probability distribution. It indicates the extent to which the data is concentrated to one side of the mean compared to the other side. A positively skewed distribution has a long tail on the right side, while a negatively skewed distribution has a long tail on the left side.
Mean and Mode:
The mean is the average of a set of numbers, calculated by summing all the values and dividing by the total number of values. The mode, on the other hand, is the value that appears most frequently in a dataset. It represents the peak or highest point of the distribution.
Explanation:
When the mean is less than the mode, it indicates that the data is concentrated towards the higher values and there are a few extremely low values that pull the mean down. This situation leads to a negatively skewed distribution.
Example:
Let's consider an example to understand this concept better. Suppose we have a dataset of 10 numbers: {1, 2, 3, 4, 5, 6, 7, 8, 9, 10}. The mean of this dataset is (1+2+3+4+5+6+7+8+9+10)/10 = 5.5. However, the mode of this dataset is 1, as it appears most frequently.
If we plot a histogram of this dataset, we would observe that the data is concentrated towards the higher values (5, 6, 7, 8, 9, 10) and there is a long tail towards the lower values (1, 2, 3, 4). This distribution would be classified as negatively skewed.
Conclusion:
In conclusion, when the mean is less than the mode, it indicates a concentration of data towards higher values and a long tail towards lower values. This leads to a negatively skewed distribution. Therefore, the correct answer to the given question is option 'B' - Negatively skewed.
Find the median of the following data: 160, 180, 200, 280, 300, 320, 400_______.- a)140
- b)300
- c)180
- d)280
Correct answer is option 'D'. Can you explain this answer?
Find the median of the following data: 160, 180, 200, 280, 300, 320, 400_______.
a)
140
b)
300
c)
180
d)
280
|
|
Arun Khatri answered |
To find the median of the given data: 160, 180, 200, 280, 300, 320, 400, we first need to arrange the data in ascending order:
160, 180, 200, 280, 300, 320, 400
Since the total number of values in the dataset is odd (7 values), the median will be the middle value.
The middle value in this case is the fourth value, which is 280.
Therefore, the median of the given data is 280.
The calculation of mean and variance is based on________.- a)Small values only
- b)Large values only
- c)Extreme values only
- d)All values
Correct answer is option 'D'. Can you explain this answer?
The calculation of mean and variance is based on________.
a)
Small values only
b)
Large values only
c)
Extreme values only
d)
All values
|
|
Jaya Nair answered |
Both the mean and variance are statistical measures that provide insights into different aspects of a dataset.
The mean, also known as the arithmetic mean or average, is calculated by summing all the values in the dataset and dividing by the total number of values. It represents the central tendency or average value of the dataset. To obtain an accurate mean, all values in the dataset are considered and included in the calculation.
The variance is a measure of the dispersion or spread of the dataset. It quantifies the average squared deviation from the mean. To calculate the variance, each value in the dataset is subtracted from the mean, squared, and then summed. Again, all values in the dataset are taken into account in the variance calculation.
Both the mean and variance require consideration of all values in the dataset to provide meaningful and accurate results. Excluding any values would lead to an incomplete representation of the data and could potentially introduce biases or inaccuracies in the calculations.
Therefore, the calculation of mean and variance is based on all values in the dataset. It is important to include all values to obtain reliable and comprehensive measures of central tendency and dispersion.
If the mode of the following data is 7, then the value of k in the data set 3, 8, 6, 7, 1, 6, 10, 6, 7, 2k + 5, 9, 7, and 13 is:- a)3
- b)7
- c)4
- d)1
Correct answer is option 'D'. Can you explain this answer?
If the mode of the following data is 7, then the value of k in the data set 3, 8, 6, 7, 1, 6, 10, 6, 7, 2k + 5, 9, 7, and 13 is:
a)
3
b)
7
c)
4
d)
1
|
|
Malavika Datta answered |
To find the value of k in the given data set, we need to determine the value that would make the mode of the data set equal to 7. The mode is the value that appears most frequently in the data set.
Let's analyze the given data set step by step:
Step 1: Arrange the data set in ascending order:
1, 2k, 3, 5, 6, 6, 7, 7, 7, 8, 9, 10, 13
Step 2: Count the frequency of each value in the data set:
1 appears once
2k appears once
3 appears once
5 appears once
6 appears twice
7 appears three times
8 appears once
9 appears once
10 appears once
13 appears once
Step 3: Identify the value with the highest frequency:
In this case, the value with the highest frequency is 7, as it appears three times.
Step 4: Substitute the mode value into the data set:
Since the mode is 7, we can replace one of the 7s in the data set with the value of k.
The data set becomes: 1, 2k, 3, 5, 6, 6, 7, 7, 8, 9, 10, 13
Step 5: Find the value of k:
Since the mode is 7, we need to replace one of the 7s in the data set with the value of k. Therefore, k = 7.
Hence, the value of k in the given data set is 7, which corresponds to option D.
Which of the following Measure of Averages is not based on all the values given in the data set___________- a)Arithmetic Mean
- b)Geometric Mean
- c)Median
- d)Mode
Correct answer is option 'C'. Can you explain this answer?
Which of the following Measure of Averages is not based on all the values given in the data set___________
a)
Arithmetic Mean
b)
Geometric Mean
c)
Median
d)
Mode
|
|
Kavita Shah answered |
The mode is the value or values that occur most frequently in the data set. It represents the most common observation(s) or the peak of the distribution.
Unlike the arithmetic mean, geometric mean, and median, the mode does not take into account all the values in the data set. Instead, it focuses solely on identifying the value(s) with the highest frequency.
For example, consider the following data set: 2, 4, 4, 6, 6, 6, 8, 8, 8. In this case, the mode is 6 because it occurs three times, which is more frequently than any other value. The mode is determined by counting the occurrences of each value, rather than considering the entire range of values.
On the other hand:
- The arithmetic mean is calculated by summing all the values in the data set and dividing by the total number of values. It incorporates all the values in the calculation.
- The geometric mean is calculated by taking the nth root of the product of n values. It also considers all the values in the data set.
- The median represents the middle value when the data set is arranged in ascending or descending order. It includes all the values and identifies the middle observation(s).
Therefore, among the options given, the measure of average that is not based on all the values given in the data set is the mode. It focuses on identifying the most frequently occurring value(s) rather than considering all the values in the data set.
A set of values is said to be relatively uniform if it has_______.- a)High Dispersion
- b)Zero Dispersion
- c)Low Dispersion
- d)Negative Dispersion
Correct answer is option 'C'. Can you explain this answer?
A set of values is said to be relatively uniform if it has_______.
a)
High Dispersion
b)
Zero Dispersion
c)
Low Dispersion
d)
Negative Dispersion
|
|
Roshni Sarkar answered |
Explanation:
To understand why a set of values is said to be relatively uniform if it has low dispersion, let's first define what dispersion means in the context of statistics. Dispersion refers to the degree of spread or variability in a dataset. It provides information about how much the values deviate from the central tendency (mean, median, or mode) of the dataset.
Low Dispersion
When a set of values has low dispersion, it means that the values are closely clustered around the central tendency. In other words, there is little variation or spread among the values in the dataset. This can be visualized by a narrow distribution or a small range of values.
Relatively Uniform
When we say that a set of values is relatively uniform, we mean that the values are evenly distributed or balanced. In this context, uniformity refers to an equal representation of values across the dataset. This can be visualized by a histogram or bar chart where each category or bin has a similar frequency or count.
Connection between Low Dispersion and Relatively Uniform
Now, the connection between low dispersion and relatively uniform becomes evident. If a set of values has low dispersion, it means that the values are closely clustered or have little variation. In this case, the values are likely to be evenly distributed or relatively uniform across the dataset.
Answer: Option C - Low Dispersion
Therefore, a set of values is said to be relatively uniform if it has low dispersion. This implies that the values are evenly distributed, and there is little variation or spread among them.
What is the mean of the range, mode and median of the data given below?5, 10, 3, 6, 4, 8, 9, 3, 15, 2, 9, 4, 19, 11, 4- a)10
- b)12
- c)8
- d)9
Correct answer is option 'D'. Can you explain this answer?
What is the mean of the range, mode and median of the data given below?
5, 10, 3, 6, 4, 8, 9, 3, 15, 2, 9, 4, 19, 11, 4
a)
10
b)
12
c)
8
d)
9
|
|
Suresh Reddy answered |
Given:
The given data is 5, 10, 3, 6, 4, 8, 9, 3, 15, 2, 9, 4, 19, 11, 4
Concept used:
The mode is the value that appears most frequently in a data set
At the time of finding Median
First, arrange the given data in the ascending order and then find the term
Formula used:
Mean = Sum of all the terms/Total number of terms
Median = {(n + 1)/2}th term when n is odd
Median = 1/2[(n/2)th term + {(n/2) + 1}th] term when n is even
Range = Maximum value – Minimum value
Calculation:
Arranging the given data in ascending order
2, 3, 3, 4, 4, 4, 5, 6, 8, 9, 9, 10, 11, 15, 19
Here, Most frequent data is 4 so
Mode = 4
Total terms in the given data, (n) = 15 (It is odd)
Median = {(n + 1)/2}th term when n is odd
⇒ {(15 + 1)/2}th term
⇒ (8)th term
⇒ 6
Now, Range = Maximum value – Minimum value
⇒ 19 – 2 = 17
Mean of Range, Mode and median = (Range + Mode + Median)/3
⇒ (17 + 4 + 6)/3
⇒ 27/3 = 9
∴ The mean of the Range, Mode and Median is 9
Sum of square of the deviations about mean is_______.- a)Maximum
- b)Minimum
- c)Zero
- d)None of these
Correct answer is option 'B'. Can you explain this answer?
Sum of square of the deviations about mean is_______.
a)
Maximum
b)
Minimum
c)
Zero
d)
None of these
|
|
Anjali Rao answered |
The sum of the squares of the deviations about the mean is also known as the sum of squared deviations or sum of squares. It is a measure of the dispersion or variability in a dataset.
To calculate the sum of squares, we first calculate the deviation of each data point from the mean by subtracting the mean from each data point. Then, we square each deviation and sum up all the squared deviations.
When we calculate the sum of squares, the goal is to minimize this value. By minimizing the sum of squares, we can find the best-fitting measure of central tendency, which is the mean. This is the idea behind the method of least squares, which is commonly used in regression analysis to find the best-fit line.
If we were to change any of the data points slightly, the sum of squares would increase. Therefore, the current sum of squares represents the minimum value of the sum of squares possible for that dataset.
In summary, the sum of the squares of the deviations about the mean is minimum for a given dataset.
Which of the following describe the middle part of a group of numbers?________.- a)The Measure of Variability
- b)The Measure of Central Tendency
- c)The Measure of Association
- d)The Measure of Shape
Correct answer is option 'B'. Can you explain this answer?
Which of the following describe the middle part of a group of numbers?________.
a)
The Measure of Variability
b)
The Measure of Central Tendency
c)
The Measure of Association
d)
The Measure of Shape
|
|
Rhea Kulkarni answered |
The Measure of Central Tendency
The measure of central tendency refers to a statistical measure that represents the middle or typical value of a group of numbers. It provides us with a single value that summarizes the entire set of data. There are several measures of central tendency, including the mean, median, and mode. Among these options, the measure of central tendency is the one that best describes the middle part of a group of numbers.
Mean
The mean is the most commonly used measure of central tendency. It is calculated by summing up all the values in a data set and dividing it by the total number of values. The mean is influenced by outliers, which are extreme values that can distort the overall average.
Median
The median is another measure of central tendency. It is the middle value in a data set when the values are arranged in ascending or descending order. If there is an even number of values, the median is calculated by taking the average of the two middle values. The median is not affected by outliers, making it a better measure of central tendency when dealing with skewed data.
Mode
The mode is the value that appears most frequently in a data set. It is useful for describing the most common value or category in a set of data. Unlike the mean and median, the mode can be used with both numerical and categorical data.
Conclusion
In summary, the measure of central tendency is the statistical measure that describes the middle part of a group of numbers. It provides a single value that summarizes the data and represents the typical value in the set. The mean, median, and mode are different measures of central tendency, with each having its own advantages and uses depending on the nature of the data.
If the mean of 5 observations x, x + 2, x + 4, x + 6 and x + 8 is 11, then the mean of last 3 observations is - a)13
- b)15
- c)17
- d)11
Correct answer is option 'A'. Can you explain this answer?
If the mean of 5 observations x, x + 2, x + 4, x + 6 and x + 8 is 11, then the mean of last 3 observations is
a)
13
b)
15
c)
17
d)
11
|
|
Rajiv Reddy answered |
Concept use:
Mean of the observation = Sum of the observations/ Total no of observations
Calculations:
mean of 5 observations x, x + 2, x + 4, x + 6 and x + 8 is 11
⇒ mean of 5 observation = x + x + 2 + x + 4 + x + 6 + x + 8/ 5 = 5x + 20/5 = 11
⇒ mean of 5 observation = x + 4 = 11
⇒ x = 7
Mean of Last Observation = x + 4 + x + 6 + x + 8/ 3 = 3x + 18/3 = x + 6 = 7 + 6 = 13
The observations 4, 1, 4, 3, 6, 2, 1, 3, 4, 5, 1, 6 are outputs of 12 dices thrown simultaneously. If m and M are means of lowest 8 observations and highest 4 observations respectively, then what is (2m + M) equal to? - a)10
- b)12
- c)17
- d)21
Correct answer is option 'A'. Can you explain this answer?
The observations 4, 1, 4, 3, 6, 2, 1, 3, 4, 5, 1, 6 are outputs of 12 dices thrown simultaneously. If m and M are means of lowest 8 observations and highest 4 observations respectively, then what is (2m + M) equal to?
a)
10
b)
12
c)
17
d)
21
|
|
Kaavya Gupta answered |
To find the value of (2m + M), we need to calculate the mean of the lowest 8 observations (m) and the mean of the highest 4 observations (M). Let's break down the problem step by step:
Step 1: Sorting the observations
First, let's sort the given observations in ascending order:
1, 1, 1, 2, 3, 3, 4, 4, 4, 5, 6, 6
Step 2: Calculating the mean of the lowest 8 observations (m)
To find the mean (average), we sum up all the lowest 8 observations and divide it by 8:
m = (1 + 1 + 1 + 2 + 3 + 3 + 4 + 4) / 8
m = 19 / 8
m = 2.375
Step 3: Calculating the mean of the highest 4 observations (M)
To find the mean (average), we sum up all the highest 4 observations and divide it by 4:
M = (4 + 5 + 6 + 6) / 4
M = 21 / 4
M = 5.25
Step 4: Calculating (2m + M)
Now, we can substitute the values of m and M into the equation:
(2m + M) = (2 * 2.375 + 5.25)
(2m + M) = (4.75 + 5.25)
(2m + M) = 10
Therefore, (2m + M) is equal to 10, which corresponds to option A in the given options.
If mode of a grouped data is 10 and mean is 4, then median will be- a)1
- b)4
- c)6
- d)8
Correct answer is option 'C'. Can you explain this answer?
If mode of a grouped data is 10 and mean is 4, then median will be
a)
1
b)
4
c)
6
d)
8
|
|
Bhargavi Dasgupta answered |
To determine the median of a grouped data set, we need to find the midpoint of the data. The median is the value that separates the data into two equal halves, with an equal number of data points on either side.
Given that the mode of the grouped data is 10, it means that the value 10 occurs most frequently in the data set. However, the mode does not provide any information about the position or order of the data points, so it does not directly help us in finding the median.
We are also given that the mean of the grouped data is 4. The mean is the average of all the data points and is calculated by summing all the values and dividing by the total number of values. Therefore, we have:
Mean = Sum of all values / Total number of values
From this information, we cannot directly determine the position of the median either.
To find the median, we need to consider the intervals and the frequencies of the grouped data. The frequency tells us how many times a particular value occurs in the data set.
Since we do not have the complete grouped data or the frequency distribution, it is not possible to determine the exact value of the median. However, based on the given information, we can make an educated guess.
If the mode is 10 and the mean is 4, it is likely that the data is positively skewed, meaning that there are a few larger values that are pulling the mean higher. In this case, the median is expected to be lower than the mean.
Since the mode is 10, it is reasonable to assume that the median is closer to 10 than to any other value. Among the given options, the only value that is closer to 10 than to any other value is 6. Therefore, the correct answer is option C, 6.
However, it is important to note that without the complete data or the frequency distribution, we cannot determine the exact value of the median. The given information only allows us to make an educated guess.
A symmetrical distribution has mean equal to 4. Its mode will be______.- a)Equal to 4
- b)Less than 4
- c)Greater than 4
- d)Not equal to 4
Correct answer is option 'A'. Can you explain this answer?
A symmetrical distribution has mean equal to 4. Its mode will be______.
a)
Equal to 4
b)
Less than 4
c)
Greater than 4
d)
Not equal to 4
|
|
Maya Joshi answered |
Meaning of Symmetrical Distribution:
Symmetrical distribution refers to a type of distribution where the data is evenly spread around the central point, which is the mean. In a symmetrical distribution, the mean, median, and mode are all equal.
Relationship between Mean and Mode in Symmetrical Distribution:
In a symmetrical distribution with a mean of 4, the mode will also be equal to 4. This is because in a symmetrical distribution, the data is evenly distributed around the mean, leading to the highest frequency of data points occurring at the mean value. Therefore, in this case, the mode will be equal to the mean, which is 4.
Conclusion:
In a symmetrical distribution with a mean of 4, the mode will be equal to 4. This relationship holds true in symmetrical distributions where the data is evenly spread around the mean. Therefore, the correct answer to the question is option 'A' - Equal to 4.
The shape of symmetrical distribution is _______- a)U shaped
- b)Bell Shaped
- c)J Shaped
- d)None of these
Correct answer is option 'B'. Can you explain this answer?
The shape of symmetrical distribution is _______
a)
U shaped
b)
Bell Shaped
c)
J Shaped
d)
None of these
|
|
Diya Singh answered |
Symmetrical Distribution
Symmetrical distribution refers to a probability distribution in which the values are evenly distributed around the mean, resulting in a balanced and bell-shaped curve. It is also known as a normal distribution or Gaussian distribution. The correct answer to the given question is option 'B', which states that the shape of symmetrical distribution is bell-shaped.
Characteristics of Symmetrical Distribution
Symmetrical distributions have several key characteristics:
1. Bell-shaped Curve: Symmetrical distributions have a bell-shaped curve, with the highest frequency of values located at the mean and tapering off symmetrically on both sides.
2. Mean, Median, and Mode: In a symmetrical distribution, the mean, median, and mode are all equal and located at the center of the distribution.
3. Equal Tails: The left and right tails of the distribution are equal in length and shape, mirroring each other.
4. Skewness: Symmetrical distributions have a skewness of zero, indicating that the data is evenly distributed around the mean without any skewness to the left or right.
5. Standard Deviation: The spread of data in symmetrical distributions can be characterized by the standard deviation. The standard deviation determines the width of the bell curve and represents the average distance between data points and the mean.
Examples of Symmetrical Distributions
Several real-world phenomena follow a symmetrical distribution:
1. Height: Heights of individuals in a population tend to follow a symmetrical distribution, with most people clustered around the average height.
2. IQ Scores: IQ scores are often distributed symmetrically, with the majority of scores concentrated around the average intelligence level.
3. Measurement Errors: Errors in measurement, such as errors in reading a thermometer or weight scale, often follow a symmetrical distribution.
4. Random Variables: Many random variables, such as the sum of two dice or the average of a large number of random samples, tend to have a symmetrical distribution.
Conclusion
In conclusion, the shape of a symmetrical distribution is bell-shaped. It is characterized by a balanced curve with the highest frequency of values at the mean and equal tails on both sides. Symmetrical distributions have several characteristics, including equal mean, median, and mode, as well as zero skewness. Real-world examples of symmetrical distributions include height, IQ scores, measurement errors, and various random variables.
What is the mean of first 99 natural numbers?- a)100
- b)50.5
- c)50
- d)99
Correct answer is option 'C'. Can you explain this answer?
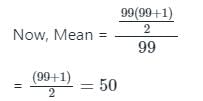
What is the mean of first 99 natural numbers?
a)
100
b)
50.5
c)
50
d)
99
|
|
Anjali Rao answered |
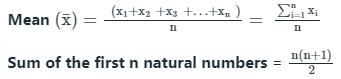
Suppose there are ‘n’ observations {x1, x2, x3,…, xn}
Calculation:
To find: Mean of the first 99 natural numbers
As we know, Sum of first n natural numbers = 
The extreme values in negatively skewed distribution lie in the_____.- a)Middle
- b)Right Tail
- c)Left Tail
- d)Whole Curve
Correct answer is option 'C'. Can you explain this answer?
The extreme values in negatively skewed distribution lie in the_____.
a)
Middle
b)
Right Tail
c)
Left Tail
d)
Whole Curve
|
|
Niharika Shah answered |
Negatively Skewed Distribution
In statistics, a negatively skewed distribution, also known as a left-skewed distribution, is a type of distribution where the tail on the left side of the distribution is longer or fatter than the tail on the right side. This means that the majority of the data points are concentrated towards the right side of the distribution, while the extreme values are located in the left tail.
Extreme Values
Extreme values, also known as outliers, are observations that are significantly different from the other values in a dataset. In a negatively skewed distribution, the extreme values are located in the left tail of the distribution.
Explanation
To understand why the extreme values in a negatively skewed distribution lie in the left tail, let's consider a hypothetical example. Suppose we have a dataset of exam scores ranging from 0 to 100, where most students scored between 70 and 90, but a few students scored very low (e.g., 20 or 30).
In this scenario, the distribution of exam scores would be negatively skewed because the tail on the left side (representing low scores) would be longer or fatter than the tail on the right side. The majority of students would fall within the range of 70 to 90, which is towards the right side of the distribution. However, the few students who scored very low (the extreme values) would be located in the left tail of the distribution.
The reason for this lies in the definition of skewness. Skewness measures the asymmetry of a distribution. In a negatively skewed distribution, the mean is less than the median, indicating that the tail on the left side is longer. This means that there are more extreme values in the left tail than in the right tail.
Therefore, the extreme values in a negatively skewed distribution lie in the left tail because the tail on the left side is longer or fatter, indicating a higher concentration of extreme values in that region.
The distribution in which mean = 60 and mode = 50, will be ________- a)Symmetrical
- b)Positive skewed
- c)Negative skewed
- d)None of these
Correct answer is option 'B'. Can you explain this answer?
The distribution in which mean = 60 and mode = 50, will be ________
a)
Symmetrical
b)
Positive skewed
c)
Negative skewed
d)
None of these
|
|
Tanishq Choudhury answered |
Explanation:
To understand why the given distribution is positively skewed, let's first discuss what skewness is.
Skewness:
Skewness is a measure of the asymmetry of a probability distribution. It tells us whether the data is concentrated more on one side of the distribution or the other. Skewness can be positive, negative, or zero.
Positive Skewness:
A distribution is positively skewed when the tail on the right side of the distribution is longer or fatter than the left side. In other words, the mean is greater than the median and mode.
Mean, Median, and Mode:
The mean, median, and mode are measures of central tendency.
- Mean: The mean is the average of all the values in the distribution. It is calculated by summing up all the values and dividing by the total number of values.
- Median: The median is the middle value of the distribution when the data is arranged in ascending or descending order. It divides the data into two equal halves.
- Mode: The mode is the value that appears most frequently in the distribution.
Given Information:
- Mean = 60
- Mode = 50
Analysis:
In a positively skewed distribution, the mean is greater than the median and mode. Since the given mean is 60 and the mode is 50, we can conclude that the distribution is positively skewed.
Example:
Let's consider an example to understand this better. Assume we have the following dataset: 50, 50, 50, 60, 70, 80.
- Mean: (50 + 50 + 50 + 60 + 70 + 80) / 6 = 360 / 6 = 60
- Median: 55 (middle value)
- Mode: 50 (most frequently occurring value)
In this example, the mean is 60, which is greater than the median (55) and mode (50). Therefore, the distribution is positively skewed.
Conclusion:
Based on the given information, the distribution in which the mean is 60 and the mode is 50 is positively skewed.
If any of the value in data set is negative then it is impossible to compute___________- a)Arithmetic Mean
- b)Harmonic Mean
- c)Geometric Mean
- d)Mode
Correct answer is option 'C'. Can you explain this answer?
If any of the value in data set is negative then it is impossible to compute___________
a)
Arithmetic Mean
b)
Harmonic Mean
c)
Geometric Mean
d)
Mode
|
|
Arshiya Kulkarni answered |
Explanation:
To compute the geometric mean, all values in the data set must be positive. The geometric mean is a measure of central tendency that is calculated by taking the nth root of the product of n numbers. It is commonly used when dealing with numbers that are related to each other multiplicatively, such as growth rates or ratios.
Arithmetic Mean:
The arithmetic mean is the sum of all values in a data set divided by the number of values. It is used to find the average value of a set of numbers. The presence of negative values in the data set does not affect the calculation of the arithmetic mean. Negative values can be balanced out by positive values, resulting in a non-negative mean.
Harmonic Mean:
The harmonic mean is the reciprocal of the arithmetic mean of the reciprocals of a set of numbers. It is used to find the average rate or speed when dealing with rates or speeds that are inversely proportional to each other. The presence of negative values in the data set does not prevent the computation of the harmonic mean. The reciprocal of a negative value is still a valid value, and the mean can be calculated accordingly.
Geometric Mean:
The geometric mean is the nth root of the product of n numbers. It is used to find the average value of a set of numbers that are related to each other multiplicatively. However, the presence of negative values in the data set affects the computation of the geometric mean. Taking the root of a negative number results in an imaginary number, which is not a valid value for the geometric mean. Therefore, if any value in the data set is negative, it is impossible to compute the geometric mean.
Mode:
The mode is the value that appears most frequently in a data set. Unlike the arithmetic mean, harmonic mean, and geometric mean, the mode is not affected by the presence of negative values. The mode can be computed regardless of the presence of negative numbers in the data set.
In conclusion, if any value in a data set is negative, it is impossible to compute the geometric mean. The arithmetic mean, harmonic mean, and mode can still be calculated even if negative values are present.
If any of the value in the data set is zero then it is not possible (i.e. impossible) to compute_________.- a)Mode
- b)Median
- c)Mean
- d)Harmonic Mean
Correct answer is option 'D'. Can you explain this answer?
If any of the value in the data set is zero then it is not possible (i.e. impossible) to compute_________.
a)
Mode
b)
Median
c)
Mean
d)
Harmonic Mean
|
|
Jaideep Sen answered |
Introduction
In statistics, various measures are used to describe and analyze data sets. Some of the commonly used measures include the mode, median, mean, and harmonic mean. However, if any value in the data set is zero, it becomes impossible to compute the harmonic mean.
Explanation
The harmonic mean is a measure of central tendency that is used when dealing with rates or ratios. It is defined as the reciprocal of the arithmetic mean of the reciprocals of the individual values in the data set. Mathematically, the harmonic mean (H) is calculated as:
H = n / (∑(1/x))
where n is the number of values in the data set and x represents each individual value.
Reasoning
When any value in the data set is zero, it poses a problem in calculating the harmonic mean because division by zero is undefined. Since the harmonic mean involves taking the reciprocals of the individual values, the presence of a zero value would result in division by zero. As a result, the harmonic mean cannot be computed.
Example
Let's consider a simple example to illustrate this point. Suppose we have a data set with the values [2, 4, 0, 6, 8]. To calculate the harmonic mean, we would need to take the reciprocals of each value and sum them up. However, when we encounter the zero value, we cannot proceed with the calculation as division by zero is undefined. Hence, in this case, it is impossible to compute the harmonic mean.
Conclusion
In summary, if any value in the data set is zero, it becomes impossible to compute the harmonic mean. This is because the harmonic mean involves taking the reciprocals of the individual values, and division by zero is undefined. It is important to note that this limitation only applies to the harmonic mean, while other measures such as the mode, median, and mean can still be calculated even if zero values are present in the data set.
Data must be arranged either in ascending or descending order if some want to compute________.- a)Mode
- b)Mean
- c)Harmonic Mean
- d)Median
Correct answer is option 'D'. Can you explain this answer?
Data must be arranged either in ascending or descending order if some want to compute________.
a)
Mode
b)
Mean
c)
Harmonic Mean
d)
Median
|
|
Bhavya Gupta answered |
Explanation:
Median Calculation:
- The median is the middle value in a set of numbers when they are arranged in either ascending or descending order.
- To calculate the median, the data must be arranged in a specific order so that the middle value can be identified.
- If the data is not arranged, it would be challenging to determine the middle value accurately.
Importance of Arranging Data:
- Arranging data in ascending or descending order is crucial for calculating the median accurately.
- If the data is not arranged, the median calculation may result in errors or incorrect values.
- The correct order of data ensures that the middle value is correctly identified, leading to an accurate median calculation.
Conclusion:
- In conclusion, arranging data in ascending or descending order is essential for computing the median accurately.
- Without proper arrangement, the calculation of the median may lead to errors and inaccuracies.
- Therefore, ensuring that the data is correctly ordered is crucial for obtaining the correct median value.
In Uni-model distribution, if mode is less than mean, then the distribution will be_________.- a)Symmetrical
- b)Normal
- c)Positively skewed
- d)Negatively skewed
Correct answer is option 'D'. Can you explain this answer?
In Uni-model distribution, if mode is less than mean, then the distribution will be_________.
a)
Symmetrical
b)
Normal
c)
Positively skewed
d)
Negatively skewed
|
|
Deepak Kapoor answered |
A unimodal distribution refers to a distribution that has a single peak or mode. It means that there is one value in the dataset that occurs more frequently than any other value.
When the mode is less than the mean, it indicates that the majority of the data points are located towards the higher values, while the tail extends towards the lower values. This pattern is commonly observed in negatively skewed distributions, also known as left-skewed distributions.
In a negatively skewed distribution, the tail extends towards the left side, while the bulk of the data is concentrated towards the right side. The mode represents the most frequently occurring value, and when it is lower than the mean, it suggests that the distribution is pulled towards the higher values.
To visualize this, imagine a dataset representing the test scores of a group of students. If the distribution is negatively skewed and the mode is less than the mean, it implies that there are a few students who scored exceptionally high, which extends the tail towards the left. However, the majority of the students have lower scores, resulting in the mode being lower than the mean.
Therefore, based on the given information, in a unimodal distribution where the mode is less than the mean, the distribution will most likely be negatively skewed. The tail of the distribution is longer on the left side, indicating a concentration of values towards the right side.
To find the average speed of a journey which is the appropriate measure of central tendency____________- a)Mean
- b)Geometric Mean
- c)Harmonic Mean
- d)Weighted Mean
Correct answer is option 'C'. Can you explain this answer?
To find the average speed of a journey which is the appropriate measure of central tendency____________
a)
Mean
b)
Geometric Mean
c)
Harmonic Mean
d)
Weighted Mean
|
|
Suresh Reddy answered |
The harmonic mean is specifically designed for rates or ratios, making it suitable for calculating average speeds. It is calculated by taking the reciprocal of each value, finding their arithmetic mean, and then taking the reciprocal of that result.
When finding the average speed of a journey, it is common to have different segments or intervals with varying speeds. The harmonic mean is useful in this scenario because it gives more weight to the slower speeds.
The harmonic mean ensures that the calculated average reflects the overall time taken for the journey, considering the different speeds and distances traveled in each segment. By taking the reciprocal of the speeds, finding their arithmetic mean, and then taking the reciprocal again, the harmonic mean effectively balances the impact of different speeds on the average.
On the other hand, the mean, geometric mean, and weighted mean are not as appropriate for finding the average speed of a journey. The mean does not account for the different speeds and distances traveled. The geometric mean is more suitable for multiplicative relationships rather than additive ones like average speeds. The weighted mean involves assigning different weights to each value, which may not be necessary unless there are specific considerations for certain segments of the journey.
Therefore, to find the average speed of a journey, the appropriate measure of central tendency is the harmonic mean. It accounts for the varying speeds and ensures the average reflects the overall time taken for the journey.
The most repeated (popular) value in a data set is called_______.- a)Median
- b)Mean
- c)Mode
- d)Geometric Mean
Correct answer is option 'C'. Can you explain this answer?
The most repeated (popular) value in a data set is called_______.
a)
Median
b)
Mean
c)
Mode
d)
Geometric Mean
|
|
Kavita Shah answered |
The mode is a measure of central tendency that represents the value or values in a data set that occur most frequently. It is the observation(s) with the highest frequency.
In other words, the mode represents the most popular or commonly occurring value in the data set. It is the value that appears more often than any other value.
For example, consider the following data set: 3, 5, 5, 7, 7, 7, 9, 9, 9. In this case, the mode is 7 and 9 because they both occur three times, which is the highest frequency. Both 7 and 9 are the most repeated values in the data set.
The mode is particularly useful when you want to identify the value(s) that have the highest occurrence or when you are interested in the most typical observation in the data set.
On the other hand:
- The median represents the middle value when the data set is arranged in ascending or descending order.
- The mean, also known as the arithmetic mean, is calculated by summing all the values and dividing by the total number of values.
- The geometric mean is calculated by taking the nth root of the product of n positive values.
Therefore, among the options given, the most repeated (popular) value in a data set is called the mode. It represents the value(s) that occur with the highest frequency in the data set.
The middle value of an ordered array of numbers is the________.- a)Mode
- b)Mean
- c)Median
- d)Mid-Point
Correct answer is option 'C'. Can you explain this answer?
The middle value of an ordered array of numbers is the________.
a)
Mode
b)
Mean
c)
Median
d)
Mid-Point
|
|
Arun Khatri answered |
The median is a measure of central tendency that represents the middle value in a dataset when the values are arranged in ascending or descending order. It divides the dataset into two equal halves, with an equal number of values above and below it.
To find the median in an ordered array of numbers, you simply identify the value located at the center position. If the total number of values in the array is odd, there will be one middle value that is the median. If the total number of values is even, the median is typically calculated as the average of the two middle values.
For example, consider the ordered array [2, 4, 7, 9, 12]. The middle value is 7, so 7 would be the median of this array.
The median is particularly useful when dealing with skewed distributions or datasets with outliers. Unlike the mean, which is influenced by extreme values, the median provides a robust measure of central tendency that is less affected by outliers.
In summary, the middle value of an ordered array of numbers is the median. It represents the central value that divides the dataset into two equal halves when the values are arranged in ascending or descending order.
Which of the following Measure of averages is affected by extreme (very small or very large) values in the data set?- a)Geometric Mean
- b)Median
- c)Arithmetic Mean
- d)Harmonic Mean
Correct answer is option 'C'. Can you explain this answer?
Which of the following Measure of averages is affected by extreme (very small or very large) values in the data set?
a)
Geometric Mean
b)
Median
c)
Arithmetic Mean
d)
Harmonic Mean
|
|
Rahul Choudhury answered |
The arithmetic mean, also known as the mean, is calculated by summing all the values in the data set and dividing by the total number of values. It represents the balance point or center of the data.
Extreme values in the data set can have a significant impact on the arithmetic mean because they contribute to the overall sum. If there are extreme values that are very small or very large, they can pull the mean towards those extreme values.
For example, consider the following data set: 1, 2, 3, 4, 1000. The arithmetic mean of this data set is (1 + 2 + 3 + 4 + 1000) / 5 = 202. If we remove the extreme value of 1000, the mean becomes (1 + 2 + 3 + 4) / 4 = 2.5. The presence of the extreme value significantly affects the arithmetic mean.
On the other hand, the geometric mean, median, and harmonic mean are less influenced by extreme values.
- The geometric mean is calculated by taking the nth root of the product of n values. Since extreme values contribute to the product rather than the sum, their effect is mitigated.
- The median represents the middle value when the data set is arranged in ascending or descending order. Extreme values do not impact the position of the middle value, making the median less affected by them.
- The harmonic mean is calculated by taking the reciprocal of each value, finding their arithmetic mean, and then taking the reciprocal of that result. Extreme values have a smaller influence on the harmonic mean due to the reciprocal operations involved.
In summary, the measure of average that is affected by extreme values in the data set is the arithmetic mean. Extreme values can significantly alter the mean due to their contribution to the overall sum.
In symmetrical distribution, mean, median, and mode are__________- a)Equal
- b)Different
- c)Zero
- d)None of these
Correct answer is option 'A'. Can you explain this answer?
In symmetrical distribution, mean, median, and mode are__________
a)
Equal
b)
Different
c)
Zero
d)
None of these
|
|
Deepak Kapoor answered |
In a perfectly symmetrical distribution, the data points are evenly distributed around a central value, resulting in a mirror image when the distribution is folded along its center. This means that the left and right sides of the distribution are symmetrically balanced.
Given this symmetry, the mean, median, and mode will all have the same value in a perfectly symmetrical distribution.
The mean represents the average value of the dataset, calculated by summing all the values and dividing by the total number of values. The median represents the middle value when the dataset is arranged in ascending or descending order. The mode represents the value or values that occur most frequently in the dataset.
In a perfectly symmetrical distribution, the balance of the data on both sides of the mode implies that the mean and median will be located at the center of the distribution, which is also where the mode will be located.
Therefore, in a symmetrical distribution, the mean, median, and mode are equal. They all have the same value, reflecting the central tendency and balance of the data points in the distribution.
Let the average of three numbers be 16. If two of the numbers are 8 and 10, what is the remaining number?- a)-30
- b)18
- c)12
- d)30
Correct answer is option 'D'. Can you explain this answer?
Let the average of three numbers be 16. If two of the numbers are 8 and 10, what is the remaining number?
a)
-30
b)
18
c)
12
d)
30
|
|
Amit Kumar answered |
Concept:
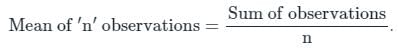
Calculation:
Here n = 3. Let's say that the third number is x.
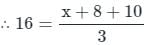
⇒ x + 18 = 48
⇒ x = 30.
________ is the measure of average which can have more than one value.- a)Mean
- b)Median
- c)Harmonic Mean
- d)Mode
Correct answer is option 'D'. Can you explain this answer?
________ is the measure of average which can have more than one value.
a)
Mean
b)
Median
c)
Harmonic Mean
d)
Mode
|
|
Arun Khatri answered |
The mode is the value or values in a dataset that occur most frequently. In some cases, there may be multiple values with the same highest frequency, resulting in multiple modes. When this occurs, the dataset is described as having multiple modes or being multimodal.
For example, consider a dataset of exam scores: 75, 80, 85, 90, 90, 95, 95, 95. In this dataset, the value 95 occurs three times, which is the highest frequency. Therefore, the mode(s) of this dataset is 95. This dataset is said to have a mode of 95.
However, in some cases, a dataset may not have any repeated values, or all values may have the same frequency. In such cases, the dataset is considered to have no mode.
On the other hand, the mean, median, and harmonic mean are measures of central tendency that typically yield a single value. The mean is the average calculated by summing all the values and dividing by the total number of values. The median is the middle value when the dataset is arranged in ascending or descending order. The harmonic mean is a type of average used for rates or ratios.
Therefore, the measure of average that can have more than one value is the mode.
Which of the following is not a value of central tendency?- a)Mode
- b)Median
- c)Mean
- d)Standard deviation
Correct answer is option 'D'. Can you explain this answer?
Which of the following is not a value of central tendency?
a)
Mode
b)
Median
c)
Mean
d)
Standard deviation
|
|
Suresh Reddy answered |
- The mode represents the most frequently occurring value,
- The median is the middle value when the data is arranged in ascending or descending order, and
- The mean is the average value calculated by summing all values and dividing by the number of values.
- Mode, median, and mean, are all measures of central tendency.
- The standard deviation is not a value of central tendency.
- It is a measure of dispersion or variability in a dataset.
∴ Standard deviation is the required answer.
In a symmetrical distribution, mean is ____________ mode.- a)Equal to
- b)Less than
- c)Greater than
- d)Not equal to
Correct answer is option 'A'. Can you explain this answer?
In a symmetrical distribution, mean is ____________ mode.
a)
Equal to
b)
Less than
c)
Greater than
d)
Not equal to
|
|
Deepak Kapoor answered |
In a symmetrical distribution, the data points are evenly distributed around a central value, resulting in a mirror image when the distribution is folded along its center. This means that the left and right sides of the distribution are symmetrically balanced.
Given this symmetry, the mean, median, and mode will all have the same value in a perfectly symmetrical distribution.
The mean represents the average value of the dataset, calculated by summing all the values and dividing by the total number of values. The mode represents the most frequently occurring value in the dataset.
Since a symmetrical distribution has equal frequencies on both sides of the mode, the mode will be the value that occurs most often and therefore represents the highest peak in the distribution.
In a symmetrical distribution, the balance of the data on both sides of the mode implies that the mean will be the same as the mode.
Therefore, in a symmetrical distribution, the mean is equal to the mode.
The Geometric Mean of -2, 4, 03, 6, 0 will be__________.- a)-3
- b)0
- c)Cannot be Computed
- d)None of these
Correct answer is option 'C'. Can you explain this answer?
The Geometric Mean of -2, 4, 03, 6, 0 will be__________.
a)
-3
b)
0
c)
Cannot be Computed
d)
None of these
|
|
Kavita Shah answered |
The geometric mean is calculated by taking the nth root of the product of n positive values. However, it is important to note that the geometric mean is only defined for positive values. It cannot be calculated when negative values or zero are present in the dataset.
In the given values -2, 4, 03, 6, 0, we have a negative value (-2) and a zero (0). Since the geometric mean cannot be computed with negative values or zero, we cannot find the geometric mean for this dataset.
Therefore, the geometric mean of -2, 4, 03, 6, 0 is cannot be computed.
If mean, median, and mode are all equal then distribution will be________- a)Positive Skewed
- b)Negative Skewed
- c)Symmetrical
- d)None of these
Correct answer is option 'C'. Can you explain this answer?
If mean, median, and mode are all equal then distribution will be________
a)
Positive Skewed
b)
Negative Skewed
c)
Symmetrical
d)
None of these
|
|
Arun Khatri answered |
In a symmetrical distribution, the data points are evenly distributed around a central value, resulting in a mirror image when the distribution is folded along its center. This means that the left and right sides of the distribution are symmetrically balanced.
When the mean, median, and mode are equal, it indicates that the distribution is perfectly balanced and there is no skewness or bias towards either side. Each side of the distribution has an equal number of data points, resulting in a symmetrical shape.
A symmetrical distribution is also known as a normal distribution or Gaussian distribution. It follows a characteristic bell-shaped curve, where the mean, median, and mode are all located at the center of the distribution.
In summary, if the mean, median, and mode are all equal in a distribution, it indicates that the distribution is symmetrical. The balance of the data points on both sides of the distribution implies a lack of skewness or bias towards either side.
Which among the following are the measures of Central Tendency or Measures of Location?A. MeanB. RangeC. ModeD. MedianE. VarianceChoose the most appropriate answer from the options given below:- a)A, B, C and E only
- b)C, D and E only
- c)A, C and D only
- d)B, C and D only
Correct answer is option 'C'. Can you explain this answer?
Which among the following are the measures of Central Tendency or Measures of Location?
A. Mean
B. Range
C. Mode
D. Median
E. Variance
Choose the most appropriate answer from the options given below:
a)
A, B, C and E only
b)
C, D and E only
c)
A, C and D only
d)
B, C and D only
|
|
Ojasvi Mehta answered |
A. Mean: The mean is a measure of central tendency that represents the average value of a set of data. It is calculated by summing all the values in the dataset and dividing by the number of observations.
C. Mode: The mode is a measure of central tendency that represents the most frequently occurring value in a dataset. It is the value that appears with the highest frequency.
D. Median: The median is a measure of central tendency that represents the middle value in a dataset when it is arranged in ascending or descending order. It divides the dataset into two equal halves.
B. Range: The range is not a measure of central tendency. It is a measure of dispersion that represents the difference between the maximum and minimum values in a dataset. It provides information about the spread of the data but does not give insight into the central tendency.
E. Variance: The variance is not a measure of central tendency. It is a measure of dispersion that quantifies the spread of data points around the mean. It provides information about the variability of the dataset but does not directly represent the central tendency.
Therefore, the measures of central tendency or measures of location are A. Mean, C. Mode, and D. Median.
The values of mean, median and mode can be________.- a)Some time equal
- b)Never equal
- c)Always equal
- d)None of these
Correct answer is option 'A'. Can you explain this answer?
The values of mean, median and mode can be________.
a)
Some time equal
b)
Never equal
c)
Always equal
d)
None of these
|
|
Arun Khatri answered |
The mean, median, and mode are three measures of central tendency that provide insights into the location or center of a dataset. While they can be equal in certain situations, it is not a universal rule that they will always be equal.
In some distributions, the mean, median, and mode may have the same value. This occurs in perfectly symmetrical distributions, such as the normal distribution, where the data points are evenly distributed around a central value.
However, in many distributions, the mean, median, and mode can have different values. This is especially true in distributions that are skewed or have multiple modes.
For example, in a positively skewed distribution, the mean will be greater than the median, and both of these may differ from the mode. Similarly, in a negatively skewed distribution, the mean will be less than the median, and the mode may be different as well.
It's important to consider the shape and characteristics of the specific distribution when determining the relationship between the mean, median, and mode. While they can be equal in some cases, it is not a guaranteed or universal outcome.
Therefore, the values of mean, median, and mode can be some times equal, but it is not always the case.
Chapter doubts & questions for Statistics - CSAT Preparation 2025 is part of UPSC CSE exam preparation. The chapters have been prepared according to the UPSC CSE exam syllabus. The Chapter doubts & questions, notes, tests & MCQs are made for UPSC CSE 2025 Exam. Find important definitions, questions, notes, meanings, examples, exercises, MCQs and online tests here.
Chapter doubts & questions of Statistics - CSAT Preparation in English & Hindi are available as part of UPSC CSE exam.
Download more important topics, notes, lectures and mock test series for UPSC CSE Exam by signing up for free.
CSAT Preparation
205 videos|264 docs|136 tests
|
|
© EduRev
|
Education Revolution
|


|


Signup on EduRev and stay on top of your study goals
10M+ students crushing their study goals daily