All Exams >
UPSC >
CSAT Preparation >
All Questions
All questions of Tables for UPSC CSE Exam
Study the following table and answer the questions based on it.
 The total expenditure of the company over these items during the year 2000 is?
- a)Rs. 544.44 lakhs
- b)Rs. 501.11 lakhs
- c)Rs. 446.46 lakhs
- d)Rs. 478.87 lakhs
Correct answer is option 'A'. Can you explain this answer?
Study the following table and answer the questions based on it.

The total expenditure of the company over these items during the year 2000 is?
a)
Rs. 544.44 lakhs
b)
Rs. 501.11 lakhs
c)
Rs. 446.46 lakhs
d)
Rs. 478.87 lakhs
|
|
Kabir Verma answered |
Total expenditure of the Company during 2000
= Rs. (324 + 101 + 3.84 + 41.6 + 74)lakhs
= Rs. 544.44 lakhs.
= Rs. (324 + 101 + 3.84 + 41.6 + 74)lakhs
= Rs. 544.44 lakhs.
Study the following table and answer the questions based on it. What is the average amount of interest per year which the company had to pay during this period?
- a)Rs. 32.43 lakhs
- b)Rs. 36.66 lakhs
- c)Rs. 33.72 lakhs
- d)None of the above
Correct answer is option 'B'. Can you explain this answer?
Study the following table and answer the questions based on it.
What is the average amount of interest per year which the company had to pay during this period?
a)
Rs. 32.43 lakhs
b)
Rs. 36.66 lakhs
c)
Rs. 33.72 lakhs
d)
None of the above

|
Dhruv Mehra answered |
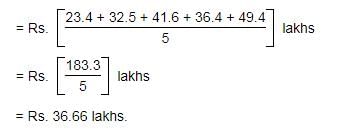
Average amount of interest paid by the Company during the given period

Study the following table and answer the questions based on it. The total amount of bonus paid by the company during the given period is approximately what percent of the total amount of salary paid during this period?
- a)0.1%
- b)1%
- c).0.5%
- d)1.25%
Correct answer is option 'B'. Can you explain this answer?
Study the following table and answer the questions based on it.
The total amount of bonus paid by the company during the given period is approximately what percent of the total amount of salary paid during this period?
a)
0.1%
b)
1%
c)
.0.5%
d)
1.25%

|
Ishani Rane answered |
Required percentage = [(3.00 + 2.52 + 3.84 + 3.68 + 3.96)/(288 + 342 + 324 + 336 + 420)*100]%
= [17/1710*100]%
= 1%
Practice Quiz or MCQ (Multiple Choice Questions) with solutions are available for Practice, which would help you prepare for "Table Charts" under LR and DI. You can practice these practice quizzes as per your speed and improvise the topic. The same topic is covered under various competitive examinations like - CAT, GMAT, Bank PO, SSC and other competitive examinations.The following table gives the percentage distribution of population of five states, P, Q, R, S and T on the basis of poverty line and also on the basis of sex.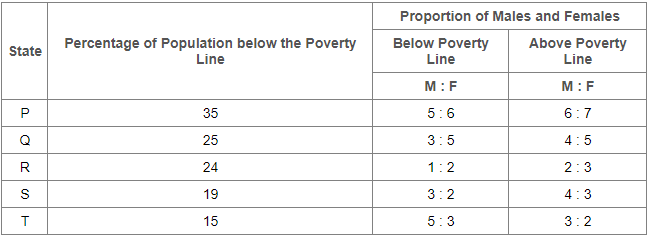 If the male population above poverty line for State R is 1.9 million, then the total population of State R is?
- a)4.5 million
- b)4.85 million
- c)5.35 million
- d)6.25 million
Correct answer is option 'D'. Can you explain this answer?
Practice Quiz or MCQ (Multiple Choice Questions) with solutions are available for Practice, which would help you prepare for "Table Charts" under LR and DI. You can practice these practice quizzes as per your speed and improvise the topic. The same topic is covered under various competitive examinations like - CAT, GMAT, Bank PO, SSC and other competitive examinations.
The following table gives the percentage distribution of population of five states, P, Q, R, S and T on the basis of poverty line and also on the basis of sex.
If the male population above poverty line for State R is 1.9 million, then the total population of State R is?
a)
4.5 million
b)
4.85 million
c)
5.35 million
d)
6.25 million

|
Disha Sengupta answered |
Study the following table and answer the questions based on it.
 The ratio between the total expenditure on Taxes for all the years and the total expenditure on Fuel and Transport for all the years respectively is approximately?
- a)4:7
- b)12:13
- c)10:13
- d)5:8
Correct answer is option 'C'. Can you explain this answer?
Study the following table and answer the questions based on it.

The ratio between the total expenditure on Taxes for all the years and the total expenditure on Fuel and Transport for all the years respectively is approximately?
a)
4:7
b)
12:13
c)
10:13
d)
5:8

|
Manoj Ghosh answered |
Total expenditure on taxes
⇒ 83 + 108 + 74 + 88 + 98
⇒ 451
Total expenditure on Fuel and Expenditure
⇒ 98 + 112 + 101 + 133 + 142
⇒ 586
Approximate Ratio
⇒ 451 : 586
Divide by 45
⇒ 10 : 13 ----(Approximate value)
∴ The approximate ratio is 10 : 13.
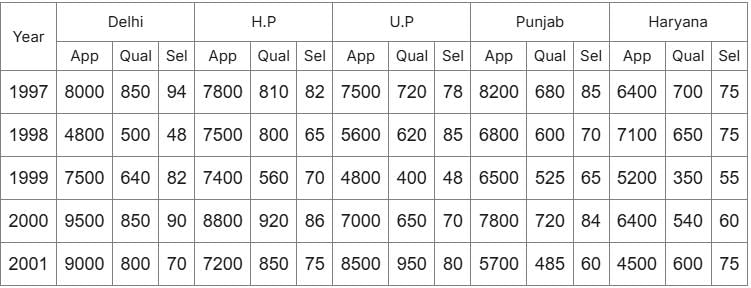
Study the following table and answer the questions based on it.Number of Candidates Appeared, Qualified and Selected in a Competitive Examination from Five States Delhi, H.P, U.P, Punjab and Haryana Over the Years 1994 to 1998
 Q.For which state the average number of candidates selected over the years is the maximum?
- a)Punjab
- b)H.P
- c)U.P
- d)Delhi
Correct answer is option 'D'. Can you explain this answer?
Study the following table and answer the questions based on it.
Number of Candidates Appeared, Qualified and Selected in a Competitive Examination from Five States Delhi, H.P, U.P, Punjab and Haryana Over the Years 1994 to 1998


Q.For which state the average number of candidates selected over the years is the maximum?
a)
Punjab
b)
H.P
c)
U.P
d)
Delhi

|
Wizius Careers answered |
The average number of candidates selected over the given period for various states are:
For Delhi = (94 + 48 + 82 + 90 + 70)/5 = 384/5 = 76.8
For H.P. = (82 + 65 + 70 + 86 + 75)/5 = 378/5= 75.6
For U.P. = (78 + 85 + 48 + 70 + 80)/5 = 361/5 = 72.2
For Punjab = (85 + 70 + 65 + 84 + 60)/5 = 364/5 = 72.8
For Haryana = (75 + 75 + 55 + 60 + 75)/5 = 340/5 = 68
Clearly, this average is the maximum for Delhi that is 76.8
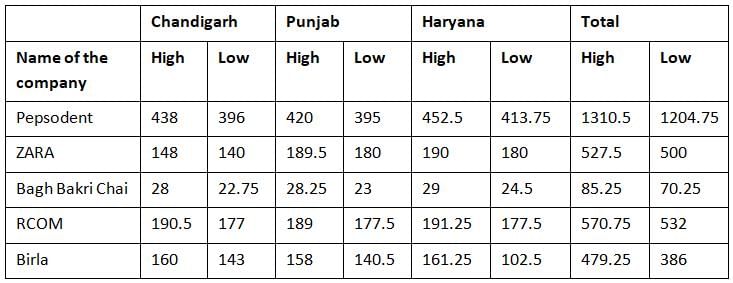
Directions: Read the table given below and answer the questions accordingly.Shares traded in Chandigarh, Punjab, Haryana (In Rupees)
 Q. The average for the high rates of Chandigarh for all the companies was
- a)Rs.192.9
- b)Rs.202.9
- c)Rs.169.9
- d)Rs.178
Correct answer is option 'A'. Can you explain this answer?
Directions: Read the table given below and answer the questions accordingly.
Shares traded in Chandigarh, Punjab, Haryana (In Rupees)


Q. The average for the high rates of Chandigarh for all the companies was
a)
Rs.192.9
b)
Rs.202.9
c)
Rs.169.9
d)
Rs.178

|
Learning Education answered |
The average for all the high involved with the Chandigarh region was
(438 + 148 + 28 + 190.5 + 160)/5 which gives 192.9.
Study the following table and answer the questions.Number of Candidates Appeared and Qualified in a Competitive Examination from Different States Over the Years.
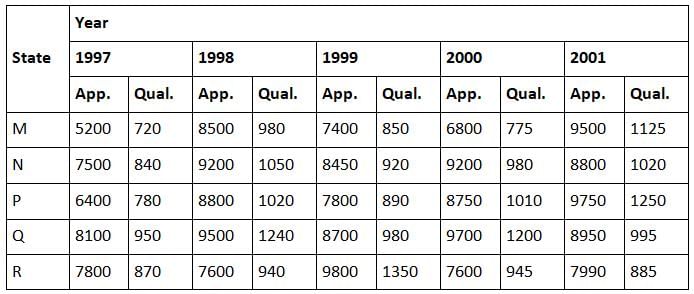 Q. Total number of candidates qualified from all the states together in 1997 is approximately what percentage of the total number of candidates qualified from all the states together in 1998?
- a)72%
- b)80%
- c)77%
- d)83%
Correct answer is option 'B'. Can you explain this answer?
Study the following table and answer the questions.
Number of Candidates Appeared and Qualified in a Competitive Examination from Different States Over the Years.


Q. Total number of candidates qualified from all the states together in 1997 is approximately what percentage of the total number of candidates qualified from all the states together in 1998?
a)
72%
b)
80%
c)
77%
d)
83%

|
G.K Academy answered |
Required percentage
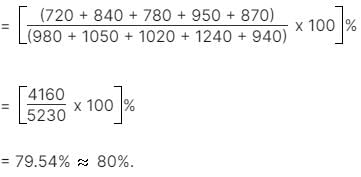

Directions: Read the table given below and answer the questions accordingly.Shares traded in Chandigarh, Punjab, Haryana (In Rupees)
 Q. Total of low value of the Punjab region exceeds the total of the low value of the region of Haryana by how much?
- a)17.75
- b)15.67
- c)15.57
- d)None of these
Correct answer is option 'A'. Can you explain this answer?
Directions: Read the table given below and answer the questions accordingly.
Shares traded in Chandigarh, Punjab, Haryana (In Rupees)


Q. Total of low value of the Punjab region exceeds the total of the low value of the region of Haryana by how much?
a)
17.75
b)
15.67
c)
15.57
d)
None of these

|
Iq Funda answered |
Total value for the low of the Punjab region for the given companies is 395 + 180 + 23 + 177.5 + 140.5 = 916
whereas the total for the low of the Haryana region is 413.75 + 180 + 24.5 + 177.5 + 102.5 = 898.25.
So it exceeds by 916 – 898.25 = 17.75.
Directions: Read the table given below and answer the questions accordingly.Shares traded in Chandigarh, Punjab, Haryana (In Rupees)
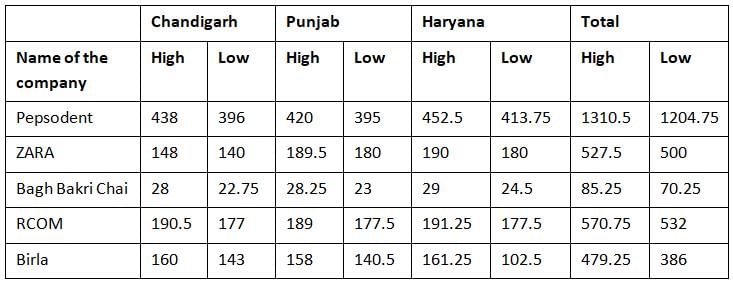 Q. High for Chandigarh for BIRLA form what percent of the High for BIRLA for Punjab and Haryana combined?
- a)50%
- b)44%
- c)40%
- d)55%
Correct answer is option 'A'. Can you explain this answer?
Directions: Read the table given below and answer the questions accordingly.
Shares traded in Chandigarh, Punjab, Haryana (In Rupees)


Q. High for Chandigarh for BIRLA form what percent of the High for BIRLA for Punjab and Haryana combined?
a)
50%
b)
44%
c)
40%
d)
55%

|
Aim It Academy answered |
High for the company "BIRLA" in Chandigarh was 160 and Total of high in Punjab and Haryana happen to be 319.25.
So, ATQ the percentage required will be (160/319.25) * 100 = 50% approx.
Directions: Read the table given below and answer the questions accordingly.Shares traded in Chandigarh, Punjab, Haryana (In Rupees)
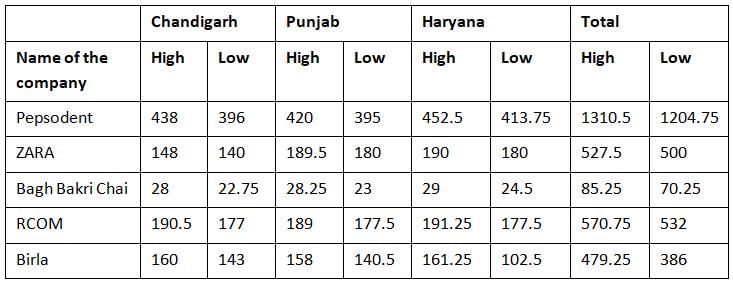 Q. Low for RCOM for all the given states/UT form what percent of the low for ZARA for the same?
- a)98.4%
- b)101%
- c)106.4%
- d)None of these
Correct answer is option 'C'. Can you explain this answer?
Directions: Read the table given below and answer the questions accordingly.
Shares traded in Chandigarh, Punjab, Haryana (In Rupees)


Q. Low for RCOM for all the given states/UT form what percent of the low for ZARA for the same?
a)
98.4%
b)
101%
c)
106.4%
d)
None of these

|
Iq Funda answered |
The total of lows for the RCOM for all the given states/ UT are given to be 532 and the ZARA has the total for their lows to be 500.
Thus ATQ (532/500)*100 = 106.4%
Study the following table and answer the questions based on it.Expenditures of a Company (in Lakh Rupees) per Annum Over the given Years.
 Q. Total expenditure on all these items in 1998 was approximately what percent of the total expenditure in 2002?
- a)62%
- b)69%
- c)66%
- d)71%
Correct answer is option 'B'. Can you explain this answer?
Study the following table and answer the questions based on it.
Expenditures of a Company (in Lakh Rupees) per Annum Over the given Years.


Q. Total expenditure on all these items in 1998 was approximately what percent of the total expenditure in 2002?
a)
62%
b)
69%
c)
66%
d)
71%

|
Aim It Academy answered |

Directions: Study the following graph carefully and answer the questions given below:Production (in Lakhs) of Widgets & Percentage defect over the years in five factories A, B, C, D, E.
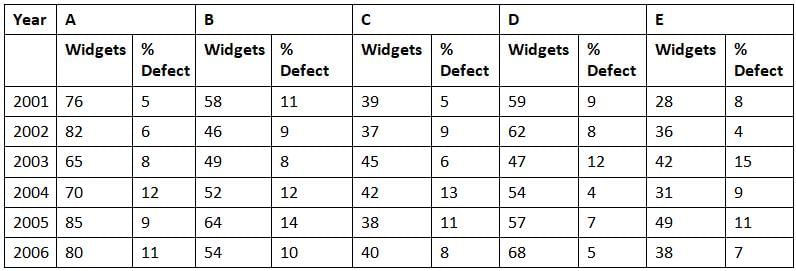 Q. What was the difference in defected widgets of factory C for the year 2006 and defected widgets of factory E for the year 2003?
- a)280000
- b)400000
- c)350000
- d)310000
Correct answer is option 'D'. Can you explain this answer?
Directions: Study the following graph carefully and answer the questions given below:
Production (in Lakhs) of Widgets & Percentage defect over the years in five factories A, B, C, D, E.

Q. What was the difference in defected widgets of factory C for the year 2006 and defected widgets of factory E for the year 2003?
a)
280000
b)
400000
c)
350000
d)
310000

|
Impact Learning answered |
Reqd. No. = (15% of 4200000) - (8% of 400000) = 630000 - 320000 = 310000
Directions: Study the following table carefully and answer the questions given below. Number of candidates appeared (App.) and percentage of candidates qualified (Qual.) under different disciplines over the years.
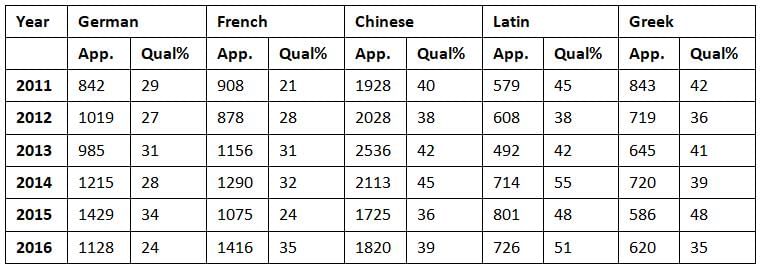 Q. Approximately, what was the percentage increase in the number of candidates who appeared under the German stream from 2013 to 2014(approx)?
- a)230
- b)23
- c)40
- d)30
Correct answer is option 'B'. Can you explain this answer?
Directions: Study the following table carefully and answer the questions given below.
Number of candidates appeared (App.) and percentage of candidates qualified (Qual.) under different disciplines over the years.


Q. Approximately, what was the percentage increase in the number of candidates who appeared under the German stream from 2013 to 2014(approx)?
a)
230
b)
23
c)
40
d)
30

|
Aim It Academy answered |
Number of students in the year 2013 were 985 and they increased to 1215,
so there was a net increase of 230.
Talking of percentage there was an increase of 230 in the initial value 985,
so the increase will be (230/985)*100 = 23.35
Directions: Read the table given below and answer the questions accordingly.Shares traded in Chandigarh, Punjab, Haryana (In Rupees)
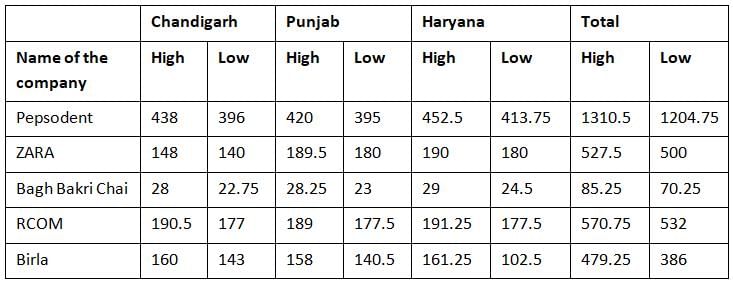 Q. Total of high for all the companies in all the States/UT are more than the lows for all the states/UT by how much?
- a)260
- b)170
- c)270
- d)280.25
Correct answer is option 'D'. Can you explain this answer?
Directions: Read the table given below and answer the questions accordingly.
Shares traded in Chandigarh, Punjab, Haryana (In Rupees)


Q. Total of high for all the companies in all the States/UT are more than the lows for all the states/UT by how much?
a)
260
b)
170
c)
270
d)
280.25

|
Aspire Academy answered |
The total of high for all the given places is 2973.25 whereas the low totals to 2693.
So the given data differ by 280.25.
Directions: Study the following graph carefully and answer the questions given below:Production (in Lakhs) of Widgets & Percentage defect over the years in five factories A, B, C, D, E.
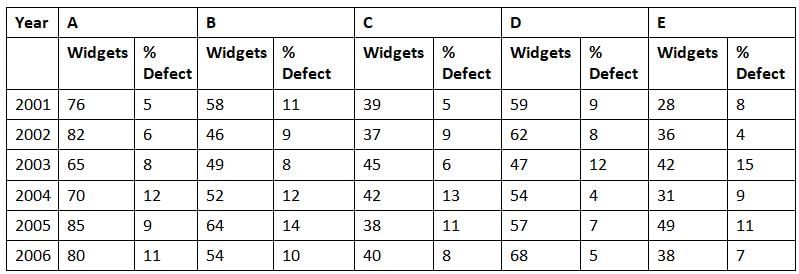 Q. What was the difference in the number of widgets of factory C which were free from any defect in the years 2004 and 2006?
- a)300
- b)150
- c)260
- d)400
Correct answer is option 'C'. Can you explain this answer?
Directions: Study the following graph carefully and answer the questions given below:
Production (in Lakhs) of Widgets & Percentage defect over the years in five factories A, B, C, D, E.

Q. What was the difference in the number of widgets of factory C which were free from any defect in the years 2004 and 2006?
a)
300
b)
150
c)
260
d)
400

|
Learning Education answered |
Required difference = (87% of 42000) – (92% of 40000) = 36540 – 36800 = -260
So the difference is 260.
Directions: Study the following graph carefully and answer the questions given below:Production (in Lakhs) of Widgets & Percentage defect over the years in five factories A, B, C, D, E.
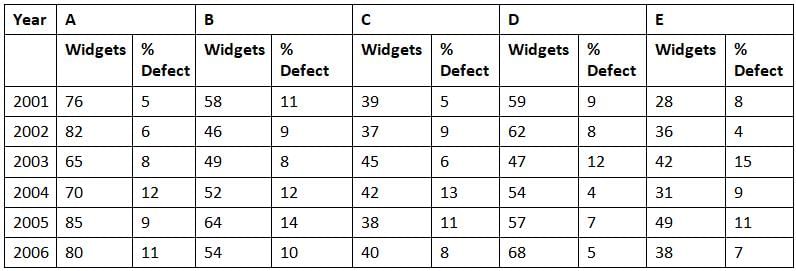 Q. The average production for the given data will be maximum for which factory?
- a)B
- b)E
- c)A
- d)D
Correct answer is option 'C'. Can you explain this answer?
Directions: Study the following graph carefully and answer the questions given below:
Production (in Lakhs) of Widgets & Percentage defect over the years in five factories A, B, C, D, E.


Q. The average production for the given data will be maximum for which factory?
a)
B
b)
E
c)
A
d)
D

|
G.K Academy answered |
If we look closely then we will find that the production of factory A happens to be maximum and thus its average will also be highest.
We can also verify this by calculating the number of widgets individually and dividing it by the number of given years i.e. 6.
Directions: Study the following graph carefully and answer the questions given below:Production (in Lakhs) of Widgets & Percentage defect over the years in five factories A, B, C, D, E.
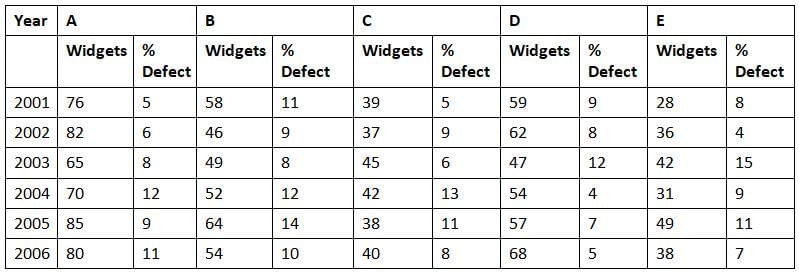 Q. The average number of widgets that were produced in the year 2002 formed what percent of the widgets that were produced in the year 2006?
- a)94%
- b)90%
- c)85%
- d)99%
Correct answer is option 'A'. Can you explain this answer?
Directions: Study the following graph carefully and answer the questions given below:
Production (in Lakhs) of Widgets & Percentage defect over the years in five factories A, B, C, D, E.

Q. The average number of widgets that were produced in the year 2002 formed what percent of the widgets that were produced in the year 2006?
a)
94%
b)
90%
c)
85%
d)
99%

|
Learning Education answered |
The total of the widgets that were produced in the year 2002 was 263(Lakhs) and the ones produced in the year 2006 were 280(Lakhs).
The percentage value is (263/280) x 100 = 94 % (approx).
Chapter doubts & questions for Tables - CSAT Preparation 2025 is part of UPSC CSE exam preparation. The chapters have been prepared according to the UPSC CSE exam syllabus. The Chapter doubts & questions, notes, tests & MCQs are made for UPSC CSE 2025 Exam. Find important definitions, questions, notes, meanings, examples, exercises, MCQs and online tests here.
Chapter doubts & questions of Tables - CSAT Preparation in English & Hindi are available as part of UPSC CSE exam.
Download more important topics, notes, lectures and mock test series for UPSC CSE Exam by signing up for free.

Contact Support
Our team is online on weekdays between 10 AM - 7 PM
Typical reply within 3 hours
|
Free Exam Preparation
at your Fingertips!
Access Free Study Material - Test Series, Structured Courses, Free Videos & Study Notes and Prepare for Your Exam With Ease

 Join the 10M+ students on EduRev
|

|
Create your account for free
OR
Forgot Password
OR
Signup to see your scores
go up
within 7 days!
within 7 days!
Takes less than 10 seconds to signup


