


All Exams >
Electronics and Communication Engineering (ECE) >
Electromagnetics >
All Questions
All questions of Transmission Lines for Electronics and Communication Engineering (ECE) Exam
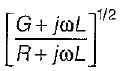
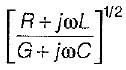
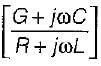
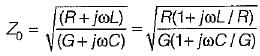
'The characteristic impedance Z0 of a transmission line is given by (where R, L, G, C are the unit length parameters)- a)
- b)

- c)
- d)
Correct answer is option 'C'. Can you explain this answer?
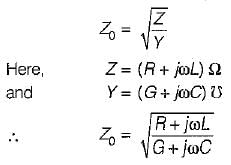
'The characteristic impedance Z0 of a transmission line is given by (where R, L, G, C are the unit length parameters)
a)
b)
c)
d)
|
|
Sanya Agarwal answered |
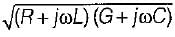
The characteristic impedance (Z0) of a transmission line is given by

The reflection coefficient of a transmission line with a short-circuited load is - a)infinite
- b)1∠1800
- c)zero
- d)none of these
Correct answer is option 'B'. Can you explain this answer?
The reflection coefficient of a transmission line with a short-circuited load is
a)
infinite
b)
1∠1800
c)
zero
d)
none of these
|
|
Rhea Reddy answered |
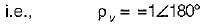
For a short-circuited load,
reflection coefficient of voltage
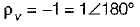
and reflection coefficient of current,
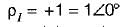
Here, only option (b) matches the answer
reflection coefficient of voltage
and reflection coefficient of current,
Here, only option (b) matches the answer
A transmission line whose characteristic impedance is purely resistive
- a)must be lossless line
- b)must be a distortionless line
- c)may not be a lossless line
- d)may not be a distortionless line
Correct answer is option 'A'. Can you explain this answer?
A transmission line whose characteristic impedance is purely resistive
a)
must be lossless line
b)
must be a distortionless line
c)
may not be a lossless line
d)
may not be a distortionless line

|
Starcoders answered |
If the transmission line is to have neither frequency nor delay distortion, then α (attenuation constant) and velocity of propagation cannot be functions of frequency.
V = ω/β β
must be a direct function of frequency to achieve this condition
LG = CR
L/C = R/G
z0 = √((R + jωL)/(G + jωC))
For a lossless line,
z0 = √(L/C)
α = √(RG) = 0 for R = 0, G = 0
β = ω√(LC)
A loss less line is always a distortion less line.
V = ω/β β
must be a direct function of frequency to achieve this condition
LG = CR
L/C = R/G
z0 = √((R + jωL)/(G + jωC))
For a lossless line,
z0 = √(L/C)
α = √(RG) = 0 for R = 0, G = 0
β = ω√(LC)
A loss less line is always a distortion less line.
Double stub matching eliminates standing waves on the- a)load side of right stub
- b)source side of the left stub
- c)both sides of the stub
- d)in between the two stubs
Correct answer is option 'B'. Can you explain this answer?
Double stub matching eliminates standing waves on the
a)
load side of right stub
b)
source side of the left stub
c)
both sides of the stub
d)
in between the two stubs
|
|
Anshika Khanna answered |
Double stub matching eliminates standing waves on the source side of the left stub.
Which of the following statements related to a transmission line is/are correct?
1. Transmission line elements are integral parts of the antenna, in some antenna system.
2. A feeder is a particular case of a transmission Sine.
3. A lossless transmission line doesn’t has resistance but, has a non-zero value of leakage conductance.
4. At radio frequency (RF), R and G both are neglected.- a)1 and 2 only
- b)1, 2 and 4 only
- c)2 and 4 only
- d)1, 2, 3 and 4
Correct answer is option 'B'. Can you explain this answer?
Which of the following statements related to a transmission line is/are correct?
1. Transmission line elements are integral parts of the antenna, in some antenna system.
2. A feeder is a particular case of a transmission Sine.
3. A lossless transmission line doesn’t has resistance but, has a non-zero value of leakage conductance.
4. At radio frequency (RF), R and G both are neglected.
a)
1 and 2 only
b)
1, 2 and 4 only
c)
2 and 4 only
d)
1, 2, 3 and 4
|
|
Debanshi Basak answered |
Transmission Line Statements
1. Transmission line elements are integral parts of the antenna, in some antenna system.
- This statement is correct as transmission lines are often used in antenna systems to efficiently transfer RF energy from the transmitter to the antenna.
2. A feeder is a particular case of a transmission line.
- This statement is correct as a feeder is a type of transmission line that is used to connect the transmitter to the antenna.
4. At radio frequency (RF), R and G both are neglected.
- This statement is correct as at high frequencies like RF, the resistance (R) and conductance (G) of the transmission line are often neglected due to the skin effect and other factors.
Therefore, the correct statements related to a transmission line are 1, 2, and 4.
If Zsc = 64Ω and Zoc = 100 Ω, the characteristic impedance will be given by.- a)60 Ω
- b)170 Ω
- c)400 Ω
- d)80 Ω
Correct answer is option 'D'. Can you explain this answer?
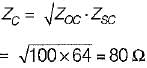
If Zsc = 64Ω and Zoc = 100 Ω, the characteristic impedance will be given by.
a)
60 Ω
b)
170 Ω
c)
400 Ω
d)
80 Ω
|
|
Meghana Gupta answered |
Characteristic impedance is given by
When the load impedance is equal to the characteristic impedance of the transmission lines, then the reflection coefficient and standing wave ratio are, respectively _________.- a)1 and 1
- b)0 and 0
- c)1 and 0
- d)0 and 1
- e)All of these
Correct answer is option 'D'. Can you explain this answer?
When the load impedance is equal to the characteristic impedance of the transmission lines, then the reflection coefficient and standing wave ratio are, respectively _________.
a)
1 and 1
b)
0 and 0
c)
1 and 0
d)
0 and 1
e)
All of these
|
|
Karan Singhania answered |
Reflection Coefficient and Standing Wave Ratio (SWR) when the Load Impedance is Equal to the Characteristic Impedance of the Transmission Lines:
Reflection Coefficient:
The reflection coefficient measures the amount of power reflected back from the load compared to the power incident on the load. It is denoted by the symbol Γ (gamma) and is a complex quantity.
When the load impedance is equal to the characteristic impedance of the transmission line, the reflection coefficient is zero. This means that there is no reflection of power from the load, and all the power is absorbed by the load. Mathematically, the reflection coefficient can be expressed as:
Γ = (ZL - Z0) / (ZL + Z0)
Where ZL is the load impedance and Z0 is the characteristic impedance of the transmission line.
If ZL = Z0, then the numerator of the above equation becomes zero, resulting in a reflection coefficient of zero.
Standing Wave Ratio (SWR):
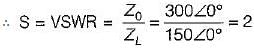
The Standing Wave Ratio (SWR) is a measure of how well a load is matched to the characteristic impedance of the transmission line. It is defined as the ratio of the maximum voltage to the minimum voltage on the transmission line.
When the load impedance is equal to the characteristic impedance of the transmission line, the SWR is 1. This indicates a perfect match between the load and the transmission line. There are no reflections, and the voltage remains constant along the line.
Mathematically, SWR can be calculated as:
SWR = (1 + |Γ|) / (1 - |Γ|)
Where |Γ| is the magnitude of the reflection coefficient.
If the reflection coefficient is zero, i.e., |Γ| = 0, then the SWR becomes:
SWR = (1 + 0) / (1 - 0) = 1
Therefore, the SWR is 1 when the load impedance is equal to the characteristic impedance of the transmission line.
Conclusion:
When the load impedance is equal to the characteristic impedance of the transmission line, the reflection coefficient is zero, indicating no power reflection from the load. Additionally, the SWR is 1, indicating a perfect match between the load and the transmission line.
Reflection Coefficient:
The reflection coefficient measures the amount of power reflected back from the load compared to the power incident on the load. It is denoted by the symbol Γ (gamma) and is a complex quantity.
When the load impedance is equal to the characteristic impedance of the transmission line, the reflection coefficient is zero. This means that there is no reflection of power from the load, and all the power is absorbed by the load. Mathematically, the reflection coefficient can be expressed as:
Γ = (ZL - Z0) / (ZL + Z0)
Where ZL is the load impedance and Z0 is the characteristic impedance of the transmission line.
If ZL = Z0, then the numerator of the above equation becomes zero, resulting in a reflection coefficient of zero.
Standing Wave Ratio (SWR):
The Standing Wave Ratio (SWR) is a measure of how well a load is matched to the characteristic impedance of the transmission line. It is defined as the ratio of the maximum voltage to the minimum voltage on the transmission line.
When the load impedance is equal to the characteristic impedance of the transmission line, the SWR is 1. This indicates a perfect match between the load and the transmission line. There are no reflections, and the voltage remains constant along the line.
Mathematically, SWR can be calculated as:
SWR = (1 + |Γ|) / (1 - |Γ|)
Where |Γ| is the magnitude of the reflection coefficient.
If the reflection coefficient is zero, i.e., |Γ| = 0, then the SWR becomes:
SWR = (1 + 0) / (1 - 0) = 1
Therefore, the SWR is 1 when the load impedance is equal to the characteristic impedance of the transmission line.
Conclusion:
When the load impedance is equal to the characteristic impedance of the transmission line, the reflection coefficient is zero, indicating no power reflection from the load. Additionally, the SWR is 1, indicating a perfect match between the load and the transmission line.
For a reciprocal transmission line, the three transmission parameters are given by A = 4, B = 7 and C = 5. The value of D is equal to- a)8.5
- b)9
- c)-8.5
- d)-9
Correct answer is option 'B'. Can you explain this answer?
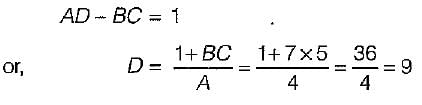
For a reciprocal transmission line, the three transmission parameters are given by A = 4, B = 7 and C = 5. The value of D is equal to
a)
8.5
b)
9
c)
-8.5
d)
-9
|
|
Om Saini answered |
Since the transmission line is reciprocal, therefore,
In a transmission line terminated by characteristic impedance, Z0- a)the incident current is zero for only applied voltage.
- b)there are large number of maximum and minimum on the line.
- c)the reflection is maximum due to termination.
- d)there is no reflection of the incident wave.
Correct answer is option 'D'. Can you explain this answer?
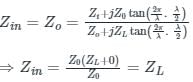
In a transmission line terminated by characteristic impedance, Z0
a)
the incident current is zero for only applied voltage.
b)
there are large number of maximum and minimum on the line.
c)
the reflection is maximum due to termination.
d)
there is no reflection of the incident wave.
|
|
Sanjana Chopra answered |
When a transmission line is terminated by an impedance Z, then reflection coefficient are:
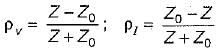
Here, Z0 = Characteristic impedance of transmission line.
Since Z = Z0 therefore reflection co-efficient of voltage (pv) and current (pI) both will be zero, i.e there will be no reflection of incident wave.
Here, Z0 = Characteristic impedance of transmission line.
Since Z = Z0 therefore reflection co-efficient of voltage (pv) and current (pI) both will be zero, i.e there will be no reflection of incident wave.
The best stub selection for the transmission line will be- a)Series open
- b)Series short
- c)Shunt open
- d)Shunt short
Correct answer is option 'D'. Can you explain this answer?
The best stub selection for the transmission line will be
a)
Series open
b)
Series short
c)
Shunt open
d)
Shunt short
|
|
Aditi Verma answered |
The best stub selection for the transmission line will be Shunt short.
- Introduction:
When designing a transmission line, it is often necessary to add stubs to the main transmission line in order to improve its performance or match its impedance to the load. These stubs can be either series or shunt connected to the main transmission line. In this case, the best stub selection is a shunt short.
- Impedance matching:
One of the primary reasons for using stubs is to match the impedance of the transmission line to the load. Impedance mismatch can lead to signal reflections and loss of power. By adding a stub, we can introduce additional reactance to cancel out the reactance of the main transmission line, resulting in a better impedance match.
- Series stub:
A series stub is connected in series with the main transmission line. It introduces a reactance that can cancel out the reactance of the main transmission line. However, a series stub can only cancel out the reactance at a single frequency, making it less flexible for impedance matching over a wide range of frequencies.
- Shunt stub:
A shunt stub is connected in parallel to the main transmission line. It introduces a reactance that can cancel out the reactance of the main transmission line. Unlike a series stub, a shunt stub can cancel out reactance over a wide range of frequencies, making it more versatile for impedance matching.
- Shunt short:
A shunt short is a type of shunt stub where the stub is short-circuited at the end. This means that the shunt stub acts as a short circuit to the main transmission line at the operating frequency. This is advantageous because a short circuit has an impedance of zero, effectively canceling out any reactance in the main transmission line. As a result, the shunt short provides a perfect impedance match between the transmission line and the load.
- Advantages of shunt short:
1. Provides a perfect impedance match between the transmission line and the load.
2. Can cancel out reactance over a wide range of frequencies, making it more versatile for impedance matching.
3. Does not introduce any additional losses in the transmission line.
- Conclusion:
In conclusion, the best stub selection for the transmission line is a shunt short. It provides a perfect impedance match, cancels out reactance over a wide range of frequencies, and does not introduce any additional losses.
The Smith chart consists of the- a)Constant R and variable X circles
- b)Variable R and constant X circles
- c)Constant R and constant X circles
- d)Variable R and variable X circles
Correct answer is option 'C'. Can you explain this answer?
The Smith chart consists of the
a)
Constant R and variable X circles
b)
Variable R and constant X circles
c)
Constant R and constant X circles
d)
Variable R and variable X circles
|
|
Hiral Shah answered |
The Smith Chart
The Smith Chart is a graphical tool used in the field of electrical engineering, particularly in the area of microwave engineering. It is a polar plot that allows engineers to analyze and design transmission lines and impedance matching networks. The chart provides a visual representation of complex impedance, allowing engineers to easily determine the impedance at any point along a transmission line.
Constant R and Constant X Circles
The Smith Chart consists of constant resistance (R) and constant reactance (X) circles. These circles are concentric and intersect at the center of the chart, which represents the normalized impedance point (1 + j0) or 50 ohms.
Constant Resistance Circles
The constant resistance circles on the Smith Chart are represented by concentric circles centered at the origin. These circles represent the locus of points with a constant resistance value. Each circle corresponds to a specific resistance value, which is normalized to the characteristic impedance of the transmission line. By analyzing the position of a point on a constant resistance circle, engineers can determine the reactive component (X) of the impedance.
Constant Reactance Circles
The constant reactance circles on the Smith Chart are represented by arcs that intersect the real axis (R axis) at right angles. These arcs represent the locus of points with a constant reactance value. Each arc corresponds to a specific reactance value, which is normalized to the characteristic impedance of the transmission line. By analyzing the position of a point on a constant reactance arc, engineers can determine the resistive component (R) of the impedance.
Interpretation on the Smith Chart
To interpret the impedance represented by a point on the Smith Chart, engineers analyze the position of the point relative to the constant resistance and constant reactance circles. If the point lies on a constant resistance circle, it indicates that the impedance has a fixed resistive component and a variable reactive component. If the point lies on a constant reactance arc, it indicates that the impedance has a fixed reactive component and a variable resistive component.
Conclusion
In conclusion, the correct answer is option 'C' - the Smith Chart consists of constant resistance (R) and constant reactance (X) circles. These circles provide a graphical representation of complex impedance and allow engineers to analyze and design transmission lines and impedance matching networks.
If a transmission line of length less than λ/4 is short circuited, it behaves as- a)series resonant circuit
- b)pure capacitive reactance
- c)pure inductive reactance
- d)parallel resonant circuit
Correct answer is option 'C'. Can you explain this answer?
If a transmission line of length less than λ/4 is short circuited, it behaves as
a)
series resonant circuit
b)
pure capacitive reactance
c)
pure inductive reactance
d)
parallel resonant circuit

|
Mira Sharma answered |
One-tenth of the wavelength is used to transmit a signal, then the line can be considered as a lumped element. This means that the transmission line can be modeled as a series of discrete components, such as resistors, capacitors, and inductors, that are connected in a particular configuration to achieve the desired signal transmission characteristics.
In this lumped element model, the transmission line is assumed to have uniform characteristics along its entire length, and the signal propagates through the line instantaneously. This approximation is valid for low-frequency signals and short transmission lines, but it becomes less accurate as the frequency and length of the transmission line increase.
For higher frequency signals or longer transmission lines, a distributed element model must be used to accurately describe the signal propagation. In this model, the transmission line is considered as a continuous medium with varying characteristics along its length, and the signal is modeled as a wave that travels through this medium. The distributed element model is more complex than the lumped element model, but it provides a more accurate description of signal transmission in high-frequency and long-distance applications.
Consider the following statements regarding the Smith's chart:1. Smith's chart is a graphical indication of the impedance of a transmission line and of the corresponding reflection coefficient as one moves along the line.2. λ distance on the line corresponds to a 720° movement on the Smith's chart.3. The admittance chart can be obtained by shifting each and every point on the impedance chart by 90°.4. Counter-clockwise movement on the chart corresponds to moving towards the generator.which of the above statements are correct?- a)1 and 2 only
- b)1 and 3 only
- c)1, 2 and 4 only
- d)2, 3 and 4 only
Correct answer is option 'A'. Can you explain this answer?
Consider the following statements regarding the Smith's chart:
1. Smith's chart is a graphical indication of the impedance of a transmission line and of the corresponding reflection coefficient as one moves along the line.
2. λ distance on the line corresponds to a 720° movement on the Smith's chart.
3. The admittance chart can be obtained by shifting each and every point on the impedance chart by 90°.
4. Counter-clockwise movement on the chart corresponds to moving towards the generator.
which of the above statements are correct?
a)
1 and 2 only
b)
1 and 3 only
c)
1, 2 and 4 only
d)
2, 3 and 4 only
|
|
Yash Khurana answered |
Smiths chart is a polar plot with normalized impedance and admittance values.3. The Smiths chart is commonly used in microwave engineering for impedance matching and network analysis.4. The Smiths chart provides a visual representation of how different loads and transmission line lengths affect the impedance and reflection coefficient.5. The Smiths chart can be used to determine the location of impedance mismatches and calculate the required matching network parameters.
The input impedance of a short circuited quarter wave long transmission line is- a)purely reactive
- b)purely resistive
- c)dependent on the characteristic impedance of the line
- d)none of the above
Correct answer is option 'D'. Can you explain this answer?
The input impedance of a short circuited quarter wave long transmission line is
a)
purely reactive
b)
purely resistive
c)
dependent on the characteristic impedance of the line
d)
none of the above
|
|
Pranjal Datta answered |
Explanation:
Input impedance is the impedance seen by the input of a transmission line. The input impedance of a short circuited quarter wave long transmission line can be explained as follows:
- A quarter wave long transmission line is a transmission line whose length is equal to one-fourth of the wavelength of the signal being transmitted.
- When this transmission line is short circuited at the input end, the voltage at the input end becomes zero and the current becomes maximum.
- The signal then travels along the transmission line towards the load. After traveling a quarter wavelength, the signal gets reflected at the load end.
- The reflected signal travels back towards the input end and when it reaches the input end, it gets reflected again due to the short circuit.
- The two reflected signals add up at the input end and create a standing wave pattern.
- The input impedance of the short circuited quarter wave long transmission line is the impedance seen by the input end of the line due to the standing wave pattern.
Answer:
The input impedance of a short circuited quarter wave long transmission line is neither purely reactive nor purely resistive. It is a complex impedance that depends on the characteristic impedance of the line, the frequency of the signal being transmitted, and the length of the line. Therefore, option D is the correct answer.
Consider a lossless line with characteristic impedance R0 and VSWR = S. Then, the impedance at the point of voltage maxima and voltage minima are respectively given by- a)SR0 and R0/S
- b)R0/S and SR0
- c)R0/S and R0/S
- d)SR0 and SR0
Correct answer is option 'A'. Can you explain this answer?
Consider a lossless line with characteristic impedance R0 and VSWR = S. Then, the impedance at the point of voltage maxima and voltage minima are respectively given by
a)
SR0 and R0/S
b)
R0/S and SR0
c)
R0/S and R0/S
d)
SR0 and SR0
|
|
Ritika Sarkar answered |
Impedance at Points of Voltage Maxima and Minima on a Lossless Line
Introduction:
In the study of transmission lines, the voltage standing wave ratio (VSWR) is an important parameter that characterizes the behavior of the line. The VSWR is the ratio of the maximum voltage to the minimum voltage along the line. In the case of a lossless line with a characteristic impedance R0, we can determine the impedance at the points of voltage maxima and minima.
Explanation:
To understand why the impedance at the points of voltage maxima and minima is given by option 'A' (SR0 and R0/S), let's consider the behavior of the voltage and current along the transmission line.
1. Voltage and Current Distribution:
- When a signal travels along a lossless transmission line, it experiences reflections at the line's ends due to impedance mismatch.
- These reflections result in the formation of standing waves along the line, with voltage and current nodes and antinodes.
- At voltage maxima, the voltage reaches its highest positive peak, while at voltage minima, the voltage reaches its lowest negative peak.
- The voltage and current distribution along the line can be described by the voltage and current standing wave patterns.
2. Relationship between VSWR and Impedance:
- The VSWR is defined as the ratio of the maximum voltage (Vmax) to the minimum voltage (Vmin) along the transmission line.
- VSWR = (Vmax / Vmin)
- The VSWR can also be expressed in terms of impedance as VSWR = (Zmax / Zmin), where Zmax and Zmin are the maximum and minimum impedances along the line, respectively.
3. Impedance at Voltage Maxima and Minima:
- At the points of voltage maxima, the voltage is maximum, and the current is minimum. This implies that the impedance at voltage maxima (Zmax) is equal to the characteristic impedance of the line (R0) multiplied by the VSWR (S).
Zmax = SR0
- Similarly, at the points of voltage minima, the voltage is minimum, and the current is maximum. This implies that the impedance at voltage minima (Zmin) is equal to the characteristic impedance of the line (R0) divided by the VSWR (S).
Zmin = R0/S
Conclusion:
In a lossless transmission line with a characteristic impedance R0 and VSWR = S, the impedance at the points of voltage maxima and minima are given by SR0 and R0/S, respectively (option 'A'). This relationship is derived from the behavior of voltage and current standing waves along the line. Understanding these relationships is crucial in the design and analysis of transmission lines in various electrical and electronic systems.
Identify the type of load, at lossless transmission line if the Voltage standing wave pattern is found to be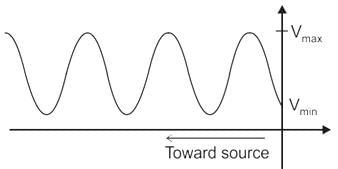
- a)Inductive
- b)Capacitive
- c)Resistive
- d)Open circuit at load
Correct answer is option 'C'. Can you explain this answer?
Identify the type of load, at lossless transmission line if the Voltage standing wave pattern is found to be
a)
Inductive
b)
Capacitive
c)
Resistive
d)
Open circuit at load

|
Crack Gate answered |
Concept: Consider the points in diagrams shown below.
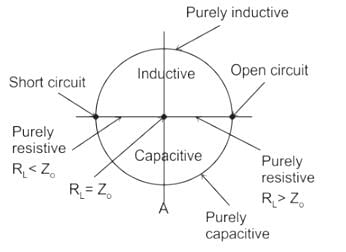
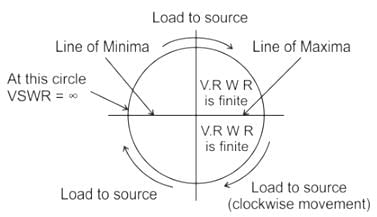
Now According to VSWR identify where do load can exist. if VSWR is Infinite then load will be anywhere on outer circle otherwise inside the circle.
1. If VSWR is infinite and Maxima at load then load will be Open circuit.
2. If VSWR is infinite and Minima at load then load will be Short circuit.
3. If VSWR is infinite and neither maxima nor minima occur at load, now if we move away from the load and minima comes first then load will be Purely capacitive.
4. If VSWR is infinite and neither maxima nor minima occur at load, now if we move away from the load and maxima comes first then load will be Purely inductive.
5. If VSWR is finite(not equal to 1) and Maxima occur at load then load will be Purely resistive with RL > Z0.
6. If VSWR is finite(not equal to 1) and Minima at load then load will be Purely resistive with RL < Z0.
7. If VSWR is finite(not equal to 1) and neither maxima nor minima occur at load, now if we move away from the load and minima comes first then load will be capacitive.
8. If VSWR is finite(not equal to 1) and neither maxima nor minima occur at load, now if we move away from the load and maxima comes first then load will be inductive.
9. If VSWR is finite and equal to 1 then Load is purely resistive with RL = Z0.
Solution:
1. we can see VSWR is finite so we are somewhere inside the circle and as there is minima at load so we are on the line of minima.
2. So load is purely Resistive. Moreover RL < Z0.
Hence option C is correct.
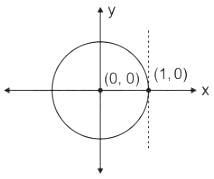
The impedances Z = jX, for all X in the range (-∞, ∞), map to the Smith chart as- a)a circle of radius 1 with center at (0, 0).
- b)a point at the center of the chart
- c)a line passing through the center of the chart
- d)a circle of radius 0.5 with center at (0.5 0)
Correct answer is option 'A'. Can you explain this answer?
The impedances Z = jX, for all X in the range (-∞, ∞), map to the Smith chart as
a)
a circle of radius 1 with center at (0, 0).
b)
a point at the center of the chart
c)
a line passing through the center of the chart
d)
a circle of radius 0.5 with center at (0.5 0)
|
|
Sarita Yadav answered |
Concept:
For drawing a smith chart:
First, we calculate normalized impedance (z)
 …1)
…1)Then we solve for constant R circles and constant X-circles by using the following formulas:
Const. R circles:
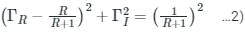
Const. X circles:

Where, ΓR = Real part of reflection coefficients.
ΓI = Imaj part of reflection coefficients.
Calculation:
Given: Z = j X
Compare this with equation (1), we can write:
R = 0
After putting this value in equation (2), we get:
(ΓR)2 + (ΓI)2 = 1 …4)
Equation (4) represents the equation of a unit circle with center (0, 0). Hence option (a) is correct.
The characteristic impedance of a distortionless line is- a)inductive
- b)capacitive
- c)complex
- d)real
Correct answer is option 'D'. Can you explain this answer?
The characteristic impedance of a distortionless line is
a)
inductive
b)
capacitive
c)
complex
d)
real
|
|
Nayanika Kaur answered |
Characteristic impedance,
or,
or,

(Since L/R = C/G for a distortionless line)
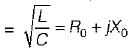
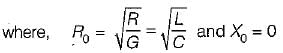
Hence, characteristic impedance of a distortionless line is purely real.
Assertion (A): A transmission line act as resonant circuit and is used in many applications at high frequencies in antenna design and other ratio circuitory
Reason (R): An open and short-circuited lines behaves like resonant circuit when length of line is an integral multiple of λ/3.- a)Both A and R are true and R is a correct explanation of A.
- b)Both A and R are true but R is not a correct explanation of A.
- c)A is true but R is false. .
- d)A is false but R is true.
Correct answer is option 'C'. Can you explain this answer?
Assertion (A): A transmission line act as resonant circuit and is used in many applications at high frequencies in antenna design and other ratio circuitory
Reason (R): An open and short-circuited lines behaves like resonant circuit when length of line is an integral multiple of λ/3.
Reason (R): An open and short-circuited lines behaves like resonant circuit when length of line is an integral multiple of λ/3.
a)
Both A and R are true and R is a correct explanation of A.
b)
Both A and R are true but R is not a correct explanation of A.
c)
A is true but R is false. .
d)
A is false but R is true.
|
|
Samridhi Bose answered |
Assertion is correct because when a transmission line is open or short-circuited it behaves as resonant circuit. However, reason is false because this happens when length of the line is an integral multiple of λ/4.
We knnw that
Zoc = -j cot βl
and Zsc = jZ0 tan βl
Thus, when βl = length of line = nλ/4 , then
cot βl = 0
and tan βl = ∞
∴ Zoc = 0
and Zsc = ∞
This means a quarter wave short-circuit line represents an infinite impedance at inpul terminals, just like a parallel resonant (LC) circuil and a λ/4 open circuit line present zero impedance at input terminals just like a series resonant LC circuit.
Assertion (A): A finite transmission line terminated in its characteristic impedance Z0, is equivalent to an infinite line.
Reason (R): The input impedance of an infinite line is the characteristic impedance of the line.- a)Both A and R are true and R is a correct explanation of A.
- b)Both A and R are true but R is not a correct explanation of A.
- c)A is true but R is false.
- d)A is false but R is true.
Correct answer is option 'A'. Can you explain this answer?
Assertion (A): A finite transmission line terminated in its characteristic impedance Z0, is equivalent to an infinite line.
Reason (R): The input impedance of an infinite line is the characteristic impedance of the line.
Reason (R): The input impedance of an infinite line is the characteristic impedance of the line.
a)
Both A and R are true and R is a correct explanation of A.
b)
Both A and R are true but R is not a correct explanation of A.
c)
A is true but R is false.
d)
A is false but R is true.
|
|
Kajal Mukherjee answered |
The input impedance of a finite line terminated in its characteristic impedance (Z0), is equivalent to an infinite line because the input impedance of an infinite line is the characteristic impedance of the line (Z0). Hence, both assertion and reason are true and reason is the correct explanation of assertion.
In the following Smith Chart, Constant VSWR circle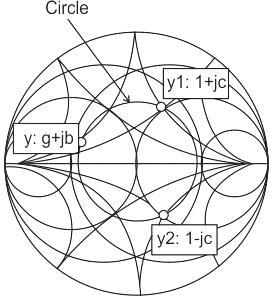 the movement from y along a constant VSWR circle to y1 needs addition of
- a)Capacitance in series with y
- b)Capacitance in shunt with y
- c)TRL in series with y
- d)Stub with y
Correct answer is option 'B'. Can you explain this answer?
In the following Smith Chart, Constant VSWR circle
the movement from y along a constant VSWR circle to y1 needs addition of
a)
Capacitance in series with y
b)
Capacitance in shunt with y
c)
TRL in series with y
d)
Stub with y
|
|
Yash Patel answered |
Concept:
VSWR: Voltage standing wave ratio is a measure of low-efficiency radio frequency power is transmitted from a power source through a transmission line into a load.
Range of VSWR is from 1 to ∞
In the smith chart clockwise movement represents the increase in impedance and its represent towards the generator.
Solution:
Capacitive reactance should be connected in shunt to increase the reactance
So movement from y to y1 is clockwise so correct option is (b) i.e. capacitance should be connected in shunt with y
Important Points:
Inductive reactance should be connected in series for clockwise movement in the smith chart.
More information on about smith chart:
(1) One complete movement is represented (360°) represent λ/2 distance λ → 720°
(2) Smith's chart is used for both impedance and admittance chart.
Which is indicated the Reflection coefficient, If ‘n’ is refractive index of incident medium and n1 is the refractive index of transmitted medium?- a)(n1 - n)/(n - n1)
- b)(n - n1)/(n1 - n)
- c)(n1 - n)/(n1 + n)
- d)(n - n1)/(n - n1)
Correct answer is option 'C'. Can you explain this answer?
Which is indicated the Reflection coefficient, If ‘n’ is refractive index of incident medium and n1 is the refractive index of transmitted medium?
a)
(n1 - n)/(n - n1)
b)
(n - n1)/(n1 - n)
c)
(n1 - n)/(n1 + n)
d)
(n - n1)/(n - n1)
|
|
Sanvi Kapoor answered |
Concept:
Normal Incidence is as shown:
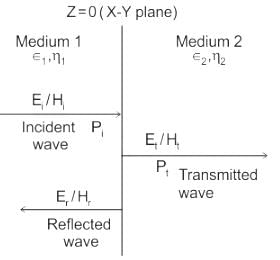
The Reflection coefficient is defined as:

Where:
η1 = intrinsic impedance of medium 1
η2 = intrinsic impedance of medium 2
Note:
This question is given wrongly in the official paper and full marks was awarded to all.
Impedance characteristics on a Smith Chart repeat after a distance of- a)λ
- b)λ/4
- c)λ/2
- d)None of the above
Correct answer is option 'C'. Can you explain this answer?
Impedance characteristics on a Smith Chart repeat after a distance of
a)
λ
b)
λ/4
c)
λ/2
d)
None of the above
|
|
Sanvi Kapoor answered |
Concept
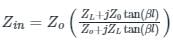
Where β = 2π/λ
Application:
When l = 0 (i.e. at the load),
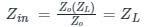
When l = λ2
Hence the input impedance (or the Smith Chart) repeats itself every half-wavelength, i.e. a half-wavelength along the transmission line corresponds to a complete rotation on the Smith chart.
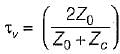
A transmission line with a characteristic impedance Z0 is connected to a transmission line with characteristic impedance Zc. if the systme is being driven by a generator connected to the first line, then the overall transmission coefficient of current will be- a)

- b)

- c)

- d)

Correct answer is option 'A'. Can you explain this answer?
A transmission line with a characteristic impedance Z0 is connected to a transmission line with characteristic impedance Zc. if the systme is being driven by a generator connected to the first line, then the overall transmission coefficient of current will be
a)
b)
c)
d)
|
|
Surbhi Chopra answered |
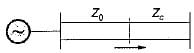
The overall transmission coefficient is
Consider the following statements:
1. Propagation constant is a dimensionless quantity.
2. When the line is lossless, propagation constant is directly proportional to the frequency.
3. Propagation constant when multiplied with the frequency gives the electrical length of the line.
Which of the above statements is/are true?- a)3 only
- b)2 only
- c)1, 2 and 3
- d)2 and 3 only
Correct answer is option 'C'. Can you explain this answer?
Consider the following statements:
1. Propagation constant is a dimensionless quantity.
2. When the line is lossless, propagation constant is directly proportional to the frequency.
3. Propagation constant when multiplied with the frequency gives the electrical length of the line.
Which of the above statements is/are true?
1. Propagation constant is a dimensionless quantity.
2. When the line is lossless, propagation constant is directly proportional to the frequency.
3. Propagation constant when multiplied with the frequency gives the electrical length of the line.
Which of the above statements is/are true?
a)
3 only
b)
2 only
c)
1, 2 and 3
d)
2 and 3 only
|
|
Poulomi Ahuja answered |
- Propagation constant is dimensionless quantity because it is the ratio of voltages or currents.
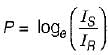
or,
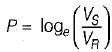
(where, P = Propagation constant) Hence, statement-1 is correct. - For a lossless transmission line,
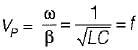
∴ VP α f
Thus, statement - 2 is also correct. - Statement-3 is also true.
Thus, all statements are true.
A transmission line having characteristic impedance ‘Z1’ of varying length in series with a load impedance ‘ZL’ appears in a Smith Chart on- a)Constant Resistance Circle
- b)Constant VSWR circle
- c)Constant Reactance Circle
- d)All of the above
Correct answer is option 'B'. Can you explain this answer?
A transmission line having characteristic impedance ‘Z1’ of varying length in series with a load impedance ‘ZL’ appears in a Smith Chart on
a)
Constant Resistance Circle
b)
Constant VSWR circle
c)
Constant Reactance Circle
d)
All of the above
|
|
Sanvi Kapoor answered |
The reflection coefficient at the load is defined as:
 , where ZL = load impedance and Z0 = characteristic impedance.
Also, VSWR = 
Clearly, VSWR is a function of ZL and Z0.
For the given transmission line, Z0 = Zt and ZL = ZL
So, VSWR is constant and it doesn’t change with the length of the line, In the smith chart, this is represented as a constant VSWR circle.
Assertion (A): The group velocity is usually more than the phase velocity.
Reason (R): If the transmission line or transmission medium is such that different frequencies travel with different velocities, then the line or the medium is said to be dispersive.- a)Both A and R are true and R is a correct explanation of A.
- b)Both A and R are true but R is not a correct explanation of A.
- c)A is true but R is false.
- d)A is false but R is true.
Correct answer is option 'D'. Can you explain this answer?
Assertion (A): The group velocity is usually more than the phase velocity.
Reason (R): If the transmission line or transmission medium is such that different frequencies travel with different velocities, then the line or the medium is said to be dispersive.
Reason (R): If the transmission line or transmission medium is such that different frequencies travel with different velocities, then the line or the medium is said to be dispersive.
a)
Both A and R are true and R is a correct explanation of A.
b)
Both A and R are true but R is not a correct explanation of A.
c)
A is true but R is false.
d)
A is false but R is true.
|
|
Srishti Choudhary answered |
Group velocity is given by
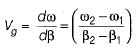
Phase velocity or velocity of propagation is given by
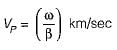
The group velocity is usually less than the phase velocity. Hence, assertion is a false statement.
Phase velocity or velocity of propagation is given by
The group velocity is usually less than the phase velocity. Hence, assertion is a false statement.
A transmission line works as a- a)LPF
- b)HPF
- c)attenuator
- d)none of these
Correct answer is option 'A'. Can you explain this answer?
A transmission line works as a
a)
LPF
b)
HPF
c)
attenuator
d)
none of these
|
|
Sakshi Chauhan answered |
Introduction:
A transmission line is a specialized structure used to transfer electric power or signals from one point to another. It consists of two or more conductors separated by a dielectric material. Transmission lines are commonly used in various electronic systems and communication networks.
Explanation:
A transmission line works as a Low Pass Filter (LPF). Let's understand why:
1. Frequency Response:
A transmission line exhibits a frequency-dependent behavior. It can transmit signals with a wide range of frequencies, but the transmission characteristics vary with frequency. The frequency response of a transmission line depends on its physical length, impedance, and termination.
2. Attenuation:
Attenuation refers to the decrease in signal strength as it propagates through a transmission line. In a transmission line, attenuation is caused by resistive losses, dielectric losses, and radiation losses. These losses increase with frequency, resulting in a reduction in signal amplitude.
3. Phase Shift:
Phase shift refers to the change in the phase angle of a signal as it propagates through a transmission line. A transmission line introduces a phase shift that is frequency-dependent. Higher frequencies experience greater phase shifts compared to lower frequencies.
4. Cutoff Frequency:
The cutoff frequency of a transmission line is the frequency at which the transmission characteristics change significantly. Above the cutoff frequency, the transmission line starts behaving as a low pass filter. It attenuates higher frequency components of the signal and allows lower frequency components to pass through with minimal distortion.
5. Filtering Effect:
Due to the frequency-dependent attenuation and phase shift, a transmission line effectively filters out high-frequency components and allows low-frequency components to pass through. This filtering effect is similar to that of a low pass filter. Hence, a transmission line can be considered as a low pass filter.
Conclusion:
In conclusion, a transmission line works as a Low Pass Filter (LPF) due to its frequency-dependent characteristics, attenuation, phase shift, and filtering effect. It attenuates higher frequency components and allows lower frequency components to pass through with minimal distortion.
A line becomes distortionless - a)it is terminated into Z0
- b)LR = GC
- c)LG = CR
- d)it is properly matched
Correct answer is option 'C'. Can you explain this answer?
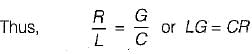
A line becomes distortionless
a)
it is terminated into Z0
b)
LR = GC
c)
LG = CR
d)
it is properly matched
|
|
Jaya Rane answered |
A distortionless transmission line is one in which the attenuation constant α is independent of frequency while the phase.constant β is linearly dependent on frequency.
The real part of the propagation constant shows:- a)reduction in voltage, current values of signal amplitude
- b)reduction of only voltage amplitude
- c)reduction of only current amplitude
- d)variation of phase shift/position of-voltage
Correct answer is option 'A'. Can you explain this answer?
The real part of the propagation constant shows:
a)
reduction in voltage, current values of signal amplitude
b)
reduction of only voltage amplitude
c)
reduction of only current amplitude
d)
variation of phase shift/position of-voltage
|
|
Shaan Choudhary answered |
Explanation:
Real part of the propagation constant:
The real part of the propagation constant in a transmission line represents the attenuation or reduction in the voltage and current values of the signal amplitude as it propagates along the transmission line. This means that as the signal travels through the line, its amplitude decreases due to factors such as resistance and conductor losses.
Effect on signal amplitude:
- The reduction in amplitude affects both the voltage and current components of the signal.
- This attenuation is a result of energy dissipation in the form of heat as the signal propagates through the transmission line.
Consequence:
- The reduction in signal amplitude can lead to signal degradation over long transmission lines.
- To compensate for this attenuation, amplifiers or repeaters may be used along the transmission line to boost the signal strength.
Significance:
Understanding the real part of the propagation constant is crucial in designing and analyzing communication systems. It helps in predicting signal strength variations and ensuring reliable signal transmission over long distances.
In conclusion, the real part of the propagation constant indicates the reduction in voltage and current values of the signal amplitude as it travels through a transmission line. This understanding is essential for maintaining signal integrity and quality in communication systems.
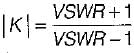
If K is the reflection coefficient and S is the voltage standing wave ratio, then- a)
- b)
- c)
- d)
Correct answer is option 'B'. Can you explain this answer?
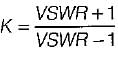
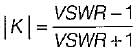
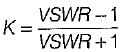
If K is the reflection coefficient and S is the voltage standing wave ratio, then
a)
b)
c)
d)
|
|
Sanchita Choudhary answered |
Voltage standing wave ratio is given by
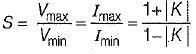
or,
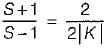

(Using componendo and dividendo)
or,
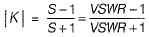
or,
(Using componendo and dividendo)
or,
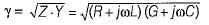
In terms of R, L, G and C the propagation constant of a transmission line is given by- a)

- b)

- c)
- d)

Correct answer is option 'C'. Can you explain this answer?
In terms of R, L, G and C the propagation constant of a transmission line is given by
a)
b)
c)
d)
|
|
Madhurima Das answered |
Propagation constant of a transmission line is given by

Chapter doubts & questions for Transmission Lines - Electromagnetics 2025 is part of Electronics and Communication Engineering (ECE) exam preparation. The chapters have been prepared according to the Electronics and Communication Engineering (ECE) exam syllabus. The Chapter doubts & questions, notes, tests & MCQs are made for Electronics and Communication Engineering (ECE) 2025 Exam. Find important definitions, questions, notes, meanings, examples, exercises, MCQs and online tests here.
Chapter doubts & questions of Transmission Lines - Electromagnetics in English & Hindi are available as part of Electronics and Communication Engineering (ECE) exam.
Download more important topics, notes, lectures and mock test series for Electronics and Communication Engineering (ECE) Exam by signing up for free.
Electromagnetics
12 videos|85 docs|90 tests
|
|
© EduRev
|
Education Revolution
|


|


Signup to see your scores
go up
within 7 days!
within 7 days!
Takes less than 10 seconds to signup