


All Exams >
CDS >
Elementary Mathematics for CDS >
All Questions
All questions of Measures of Central tendency & Data for CDS Exam

What is the coefficient of range for the following distribution?

- a)22
- b)50
- c)72.46%
- d)75.82
Correct answer is option 'C'. Can you explain this answer?
What is the coefficient of range for the following distribution?
a)
22
b)
50
c)
72.46%
d)
75.82

|
Glance Learning Institute answered |
Calculating the Coefficient of Range
- Step 1: Find the range of the distribution by subtracting the smallest value from the largest value. In this case, the smallest value is 22 and the largest value is 75.82. So, the range is 75.82 - 22 = 53.82.
- Step 2: Find the mean of the distribution by adding all the values and dividing by the number of values. The sum of all values is 22 + 50 + 72.46 + 75.82 = 220.28. Since there are 4 values, the mean is 220.28 / 4 = 55.07.
- Step 3: Calculate the coefficient of range by dividing the range by the mean and multiplying by 100. So, the coefficient of range is (53.82 / 55.07) * 100 = 97.7%.
Therefore, the coefficient of range for the given distribution is 97.7%.
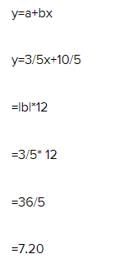
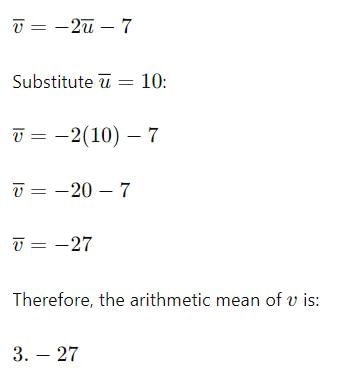
If two variables x and y are related by 2x + 3y –7 =0 and the mean and mean deviation about mean of x are 1 and 0.3 respectively, then the coefficient of mean deviation of y about mean is- a)–5
- b)12
- c)50
- d)4
Correct answer is option 'B'. Can you explain this answer?
If two variables x and y are related by 2x + 3y –7 =0 and the mean and mean deviation about mean of x are 1 and 0.3 respectively, then the coefficient of mean deviation of y about mean is
a)
–5
b)
12
c)
50
d)
4

|
Shalabh Jain answered |
2x+3y=7y=(7-2x)/3=7/3-2x/3mean of y=(7-2*mean of x)/3mean deviation of y=abs value of 2/3* mean deviation of xcoeff of mean deviation of y= mean deviation of y/mean of y
If mean = 5, Standard deviation = 2.6, median = 5 and quartile deviatiion = 1.5, then the coefficient of quartile deviation equals.- a)35
- b)39
- c)30
- d)32
Correct answer is option 'C'. Can you explain this answer?
If mean = 5, Standard deviation = 2.6, median = 5 and quartile deviatiion = 1.5, then the coefficient of quartile deviation equals.
a)
35
b)
39
c)
30
d)
32

|
Defence Exams answered |
Formula:
Coefficient of Quartile Deviation = (Quartile Deviation / Median) × 100
Given:
- Quartile Deviation = 1.5
- Median = 5
Substitute the values:
Coefficient of Quartile Deviation = (1.5 / 5) × 100 = 30
Correct Answer:
c) 30
If x and y are related by 2x+3y+4 = 0 and SD of x is 6, then SD of y is- a)22
- b)4
- c)5
- d)9
Correct answer is option 'B'. Can you explain this answer?
If x and y are related by 2x+3y+4 = 0 and SD of x is 6, then SD of y is
a)
22
b)
4
c)
5
d)
9

|
Gurmeet Gill answered |
It's simple 2x+3y+4=0X value is given is 6 2(6) +3y+4=0
12+3y+4=0
3y=16
Y=4
Ans= B is the correct answer
12+3y+4=0
3y=16
Y=4
Ans= B is the correct answer
Coefficient of mean deviation about mean of the first 9 natural numbers is - a)200/9
- b)80
- c)400/9
- d)50
Correct answer is option 'C'. Can you explain this answer?
Coefficient of mean deviation about mean of the first 9 natural numbers is
a)
200/9
b)
80
c)
400/9
d)
50

|
Dhruv Mehra answered |
1,2,3,4,5,6,7,8,9
Σx = 1+2+3+4+5+6+7+8+9 = 45
mean = 45/9 = 5
absolute deviations from the mean:
1-5, 2-5 ,... 9-5 in absolute value
4,3,2,1,0,1,2,3,4
add the absolute deviations and divide by 9
Absolute deviations from the mean = 20/9
divide by the mean = (20/9) / 5 = 20/45 = 4/9 = 0.4444
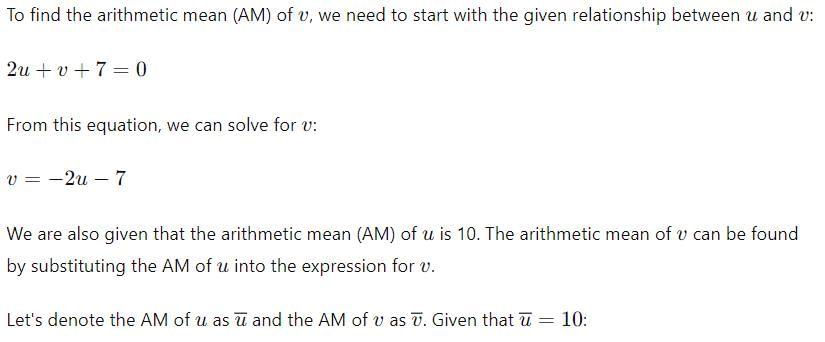
If x and y are related by y = 2x+ 5 and the SD and AM of x are known to be 5 and 10 respectively, then the coefficient of variation is
- a)25
- b)30
- c)40
- d)20
Correct answer is option 'C'. Can you explain this answer?
If x and y are related by y = 2x+ 5 and the SD and AM of x are known to be 5 and 10 respectively, then the coefficient of variation is
a)
25
b)
30
c)
40
d)
20

|
Kuldip Rajput R answered |
=2x+5
=2(10)+5
=25
then s.d is 2(5)
=10
so
= 10/25×100
=40
=2(10)+5
=25
then s.d is 2(5)
=10
so
= 10/25×100
=40
Find at the variance given that the Arithmetic Mean = ( 8 + 4)/2- a)2
- b)6
- c)1
- d)4
Correct answer is option 'D'. Can you explain this answer?
Find at the variance given that the Arithmetic Mean = ( 8 + 4)/2
a)
2
b)
6
c)
1
d)
4
|
|
Kavya Saxena answered |
We know that S. D = range/2
= Max-min/2
=8-4/2=2
And variance = (sd)2
= 22= 4
At a manufacturing plant, the unit of quantity manufactured in 8 days are 250, 320, 240, 210, 260, 330, 310, 260- a)210
- b)260
- c)240
- d)250
Correct answer is option 'B'. Can you explain this answer?
At a manufacturing plant, the unit of quantity manufactured in 8 days are 250, 320, 240, 210, 260, 330, 310, 260
a)
210
b)
260
c)
240
d)
250

|
King Is Mine answered |
Can anyone please explain me this question
Median in set 6, 4, 2, 3, 4, 5, 5, 4 would be- a)5
- b)3
- c)4
- d)6
Correct answer is option 'C'. Can you explain this answer?
Median in set 6, 4, 2, 3, 4, 5, 5, 4 would be
a)
5
b)
3
c)
4
d)
6

|
Ritika Iyer answered |
Finding the Median of the Given Set
To find the median of the given set 6, 4, 2, 3, 4, 5, 5, 4, we can follow these steps:
1. Arrange the set in ascending order: 2, 3, 4, 4, 4, 5, 5, 6
2. Count the number of elements in the set: 8
3. Determine the middle element(s) of the set:
- If the set has an odd number of elements, the median is the middle element. In this case, there are 8 elements, so the middle element is the 4th one, which is 4.
- If the set has an even number of elements, the median is the average of the two middle elements. In this case, there are 8 elements, so the two middle elements are the 4th and 5th ones, which are both 4. Therefore, the median is the average of 4 and 4, which is also 4.
Therefore, the median of the given set 6, 4, 2, 3, 4, 5, 5, 4 is 4.
If the SD of x is 3, what us the variance of (5–2x)?
- a)36
- b)6
- c)1
- d)9
Correct answer is option 'A'. Can you explain this answer?
If the SD of x is 3, what us the variance of (5–2x)?
a)
36
b)
6
c)
1
d)
9
|
|
Priya Patel answered |
SD = √var
Var = (SD)2
Variance of X = (SD)2 = (3)2 = 9
Var(5 - 2x) = (-2)2 . variance of x = 4 x 9 = 36.
Var = (SD)2
Variance of X = (SD)2 = (3)2 = 9
Var(5 - 2x) = (-2)2 . variance of x = 4 x 9 = 36.
Geometric mean of 8,4,2 is - a)4
- b)2
- c)8
- d)None of these
Correct answer is option 'A'. Can you explain this answer?
Geometric mean of 8,4,2 is
a)
4
b)
2
c)
8
d)
None of these
|
|
Defence Exams answered |
The formula for the geometric mean (GM) of n numbers is:
GM = (x₁ ⋅ x₂ ⋅ x₃ ⋅ ... ⋅ xₙ)^(1/n)
Given numbers: 8, 4, 2
Step-by-step calculation:
- Multiply the numbers: 8 ⋅ 4 ⋅ 2 = 64
- Apply the formula: GM = ³√64 = 4
Correct Answer:
a) 4
The A.M of 1, 3, 5, 6, x, 10 is 6. The value of x is- a)10
- b)11
- c)12
- d)None
Correct answer is option 'B'. Can you explain this answer?
The A.M of 1, 3, 5, 6, x, 10 is 6. The value of x is
a)
10
b)
11
c)
12
d)
None
|
|
Faizan Khan answered |
(1+3+5+6+x+10)/6 = 6
(25+x)/6 = 6
x = 36-25
x = 11
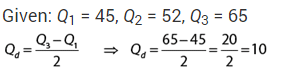
What will be the probable value of mean deviation? When Q3 = 40 and Q1 = 15- a)17.50
- b)18.75
- c)15.00
- d)None of the above
Correct answer is option 'C'. Can you explain this answer?
What will be the probable value of mean deviation? When Q3 = 40 and Q1 = 15
a)
17.50
b)
18.75
c)
15.00
d)
None of the above
|
|
Pratiksha Singh answered |
Q3-Q1/2
40-15/2=12.5
As we know,
6Q.D=5M.D=4S.D
.•. 6Q.D =5M.D
6×12.5/5=M.D
M.D=15
40-15/2=12.5
As we know,
6Q.D=5M.D=4S.D
.•. 6Q.D =5M.D
6×12.5/5=M.D
M.D=15
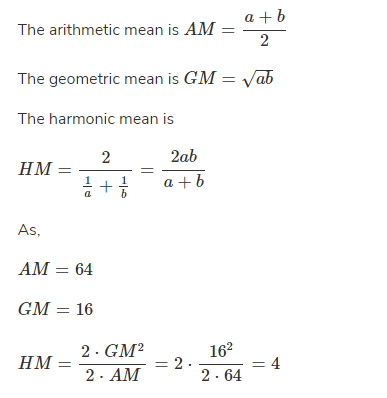
If the Arithmetic mean between two numbers is 64 and the Geometric mean between them is 16. The Harmonic Mean between them is ______________.- a)64
- b)4
- c)16
- d)40
Correct answer is option 'B'. Can you explain this answer?
If the Arithmetic mean between two numbers is 64 and the Geometric mean between them is 16. The Harmonic Mean between them is ______________.
a)
64
b)
4
c)
16
d)
40
|
|
Priya Patel answered |
Answer:
The harmonic mean is =4
Explanation:Let the 2
numbers be a and b
Then,
Which one is difficult to compute?- a)Relative measures of dispersion
- b)Absolute measures of dispersion
- c)Both a) and b)
- d)Range
Correct answer is option 'A'. Can you explain this answer?
Which one is difficult to compute?
a)
Relative measures of dispersion
b)
Absolute measures of dispersion
c)
Both a) and b)
d)
Range
|
|
Dhruv Mehra answered |
Relative measures of dispersion are known as ‘Coefficient of dispersion’. They are obtained as ratios or percentages. They are pure numbers independent of the units of measurement. Variability or dispersion among different distributions are compared by these relative measures.
One example will illustrate the point. Supposing the average mark of a group of students is 20 and the absolute measure of dispersion is 10 and the average mark of another group of students is 60 and the absolute measure of dispersion is also 10. This does not mean that variability in the two series are the same. For this, relative measure of dispersion should be calculated.
The average of 5 quantities is 6 and the average of 3 is 8. What is the average of the remaining two. - a)4
- b)5
- c)3
- d)3.5
Correct answer is option 'C'. Can you explain this answer?
The average of 5 quantities is 6 and the average of 3 is 8. What is the average of the remaining two.
a)
4
b)
5
c)
3
d)
3.5

|
Sameer Rane answered |
The average of 5 quantities is 6.
Therefore, the sum of the 5 quantities is 5 x 6 = 30.
The average of three of these 5 quantities is 8.
Therefore, the sum of these three quantities = 3 x 8 = 24
The sum of the remaining two quantities = 30 - 24 = 6.
Average of these two quantities = 6/2 = 3.
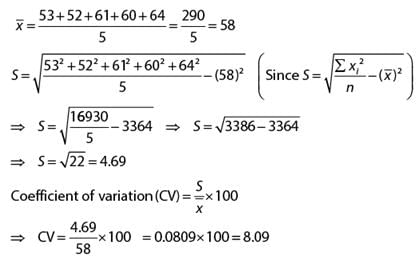
Which of the following companies A and B is more consistent so far as the payment of dividend are concerned ?
- a)A
- b)B
- c)Both (a) and (b)
- d)Neither (a) nor (b)
Correct answer is option 'A'. Can you explain this answer?
Which of the following companies A and B is more consistent so far as the payment of dividend are concerned ?
a)
A
b)
B
c)
Both (a) and (b)
d)
Neither (a) nor (b)

|
132 Muskan answered |
mean of x = 9.37
SD of x = 3.01
CV of x = 3.01/9.37 � 100
= 32.12
mean of y = 9.12
SD of y = 4.54
CV of y = 4.54/9.12 � 100
= 49.78
so CV x = 32.12 (less variable , more consistent)
CV y = 49.78 (more variable, less consistant)
there for Company A is more consistent
If each item is reduced by 10, the range is- a)Increased by 10
- b)Decreased by 15
- c)Unchanged
- d)None
Correct answer is option 'C'. Can you explain this answer?
If each item is reduced by 10, the range is
a)
Increased by 10
b)
Decreased by 15
c)
Unchanged
d)
None

|
Tejas Chaudhary answered |
Explanation:
When each item in a set is reduced by the same amount, the range of the set remains unchanged. This is because the range is the difference between the highest and lowest values in the set, and reducing each item by the same amount will not change the relative distance between any two items.
For example, consider the set {10, 15, 20, 25, 30}. The range of this set is 30 - 10 = 20. If we reduce each item by 10, we get the set {0, 5, 10, 15, 20}. The range of this set is still 20 - 0 = 20, which is the same as the range of the original set.
Therefore, the correct answer is option C: Unchanged.
Which of the following measures of dispersion is used for calculating the consistency between two series?- a)Quartile deviation
- b)Standard Deviation
- c)Coefficient of variation
- d)None of the above
Correct answer is option 'C'. Can you explain this answer?
Which of the following measures of dispersion is used for calculating the consistency between two series?
a)
Quartile deviation
b)
Standard Deviation
c)
Coefficient of variation
d)
None of the above
|
|
Akshat Choudhary answered |
Coefficient of Variation for Consistency between Two Series
The coefficient of variation (CV) is used to measure the consistency between two series. It is a statistical measure of the relative variability or dispersion of a set of data points. The CV is expressed as a percentage and is calculated by dividing the standard deviation of a data set by its mean and then multiplying the result by 100.
Formula for Coefficient of Variation
The formula for calculating the coefficient of variation is:
CV = (standard deviation / mean) x 100%
Interpretation of Coefficient of Variation
A lower CV indicates that the data points are more consistent and have less variability. A higher CV indicates that the data points are less consistent and have more variability.
Uses of Coefficient of Variation
The coefficient of variation is commonly used in fields such as finance, economics, and engineering to compare the variability of different data sets. It is particularly useful when comparing data sets with different units or scales, as it provides a standardized measure of dispersion.
Conclusion
In summary, the coefficient of variation is used for calculating the consistency between two series. It is calculated by dividing the standard deviation of a data set by its mean and multiplying the result by 100. A lower CV indicates more consistency and less variability, while a higher CV indicates less consistency and more variability.
(Dirction 22 - 40) Write down the correct answers. Each question carries two marks.
Q. What is the coefficient of range for the following wages of 8 workers?
Rs.80, Rs.65, Rs.90, Rs.60, Rs.75, Rs.70, Rs.72, Rs.85.
- a)0.5
- b)60
- c)30
- d)0.35
Correct answer is option 'D'. Can you explain this answer?
(Dirction 22 - 40) Write down the correct answers. Each question carries two marks.
Q. What is the coefficient of range for the following wages of 8 workers?
Rs.80, Rs.65, Rs.90, Rs.60, Rs.75, Rs.70, Rs.72, Rs.85.
a)
0.5
b)
60
c)
30
d)
0.35

|
Gowri Chakraborty answered |
Explanation:
- First, we need to find the range of the given data set. Range is calculated by subtracting the smallest value from the largest value.
- Smallest value = Rs.60
- Largest value = Rs.90
- Range = Rs.90 - Rs.60 = Rs.30
- Next, we need to find the mean of the data set. Mean is calculated by adding all the values and dividing by the number of values.
- Sum of all values = Rs.80 + Rs.65 + Rs.90 + Rs.60 + Rs.75 + Rs.70 + Rs.72 + Rs.85 = Rs.597
- Mean = Rs.597 / 8 = Rs.74.625
- Finally, the coefficient of range is calculated by dividing the range by the mean and multiplying by 100 to get a percentage.
- Coefficient of Range = (Range / Mean) * 100 = (30 / 74.625) * 100 ≈ 0.35
The median of following numbers, which are given is ascending order is 25. Find the value of X.11 13 15 19 (x+2) (x+4) 30 35 39 46- a)22
- b)20
- c)15
- d)30
Correct answer is option 'A'. Can you explain this answer?
The median of following numbers, which are given is ascending order is 25. Find the value of X.11 13 15 19 (x+2) (x+4) 30 35 39 46
a)
22
b)
20
c)
15
d)
30
|
|
Maduri. Siva Reddy answered |
GIVEN X:11,13,15,19,x+2,x+4,30,35,39,46
median=25. n=10
median=(m)=(n+1/2)th observation
25=(10+1/2)th observation
25=(11/2)th observation
25=(5.5)th observation
25=(5+0.5(6-5)) observation
25=x+2+0.5(x+4-x-2)
25=x+2+0.5(2)
25=x+2+1
25=x+3
25-3=x
22=x
median=25. n=10
median=(m)=(n+1/2)th observation
25=(10+1/2)th observation
25=(11/2)th observation
25=(5.5)th observation
25=(5+0.5(6-5)) observation
25=x+2+0.5(x+4-x-2)
25=x+2+0.5(2)
25=x+2+1
25=x+3
25-3=x
22=x
What is the value of mean deviation about mean for the following numbers?5, 8, 6, 3, 4.- a)5.20
- b)7.20
- c)1.44
- d)2.23
Correct answer is option 'C'. Can you explain this answer?
What is the value of mean deviation about mean for the following numbers?
5, 8, 6, 3, 4.
a)
5.20
b)
7.20
c)
1.44
d)
2.23

|
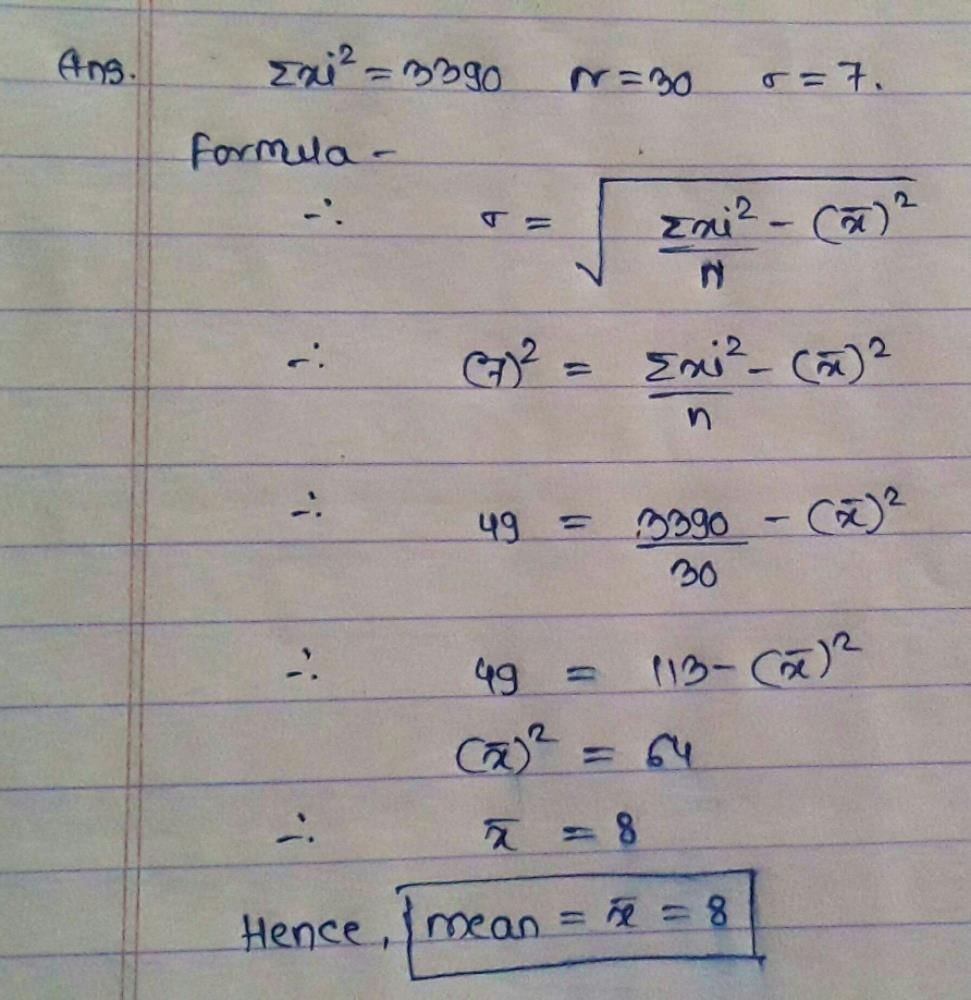
Meera Joshi answered |
Mean Deviation about Mean:
Mean deviation about mean is a measure of variability that indicates the average difference between each data point and the mean of the dataset. It is calculated by taking the absolute value of the difference between each data point and the mean, adding them up, and dividing by the total number of data points.
Formula:
Mean deviation about mean = Σ | Xi - X̄ | / N
Where,
Xi = Data points
X̄ = Mean of the dataset
N = Total number of data points
Calculation:
Given dataset = 5, 8, 6, 3, 4
Step 1: Find the mean of the dataset
Mean (X̄) = (5 + 8 + 6 + 3 + 4) / 5
= 26 / 5
= 5.2
Step 2: Calculate the absolute deviation of each data point from the mean
|5 - 5.2| = 0.2
|8 - 5.2| = 2.8
|6 - 5.2| = 0.8
|3 - 5.2| = 2.2
|4 - 5.2| = 1.2
Step 3: Add up the absolute deviations and divide by the total number of data points
Mean deviation about mean = (0.2 + 2.8 + 0.8 + 2.2 + 1.2) / 5
= 7 / 5
= 1.4
Therefore, the value of mean deviation about mean for the given dataset is 1.44 (Option C).
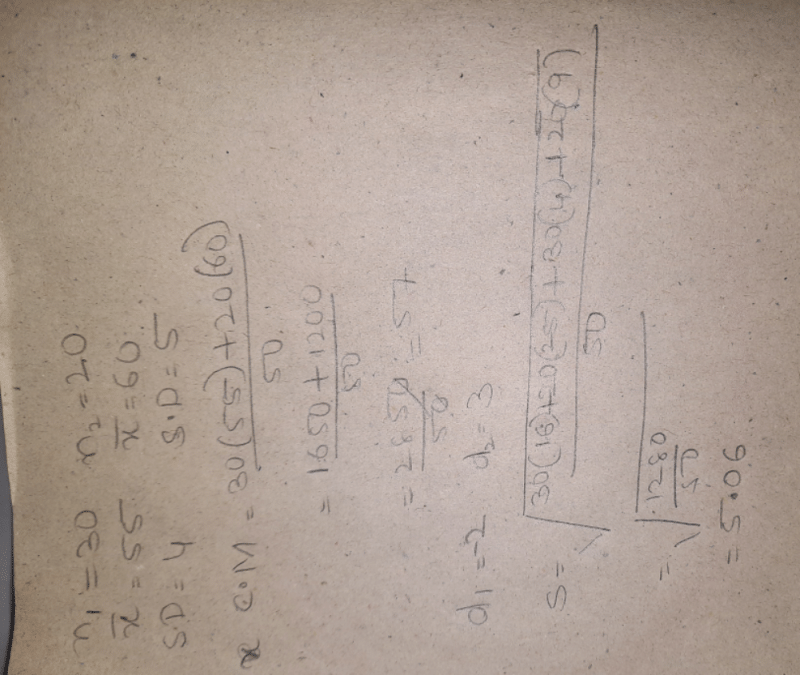
If the SD of the 1st n natural numbers is 2, then the value of n must be- a)2
- b)7
- c)6
- d)5
Correct answer is option 'B'. Can you explain this answer?
If the SD of the 1st n natural numbers is 2, then the value of n must be
a)
2
b)
7
c)
6
d)
5
|
|
Arun Khanna answered |
The standard deviation of n natural numbers = sqrt [1/12 (n^2 - 1)]
Therefore,
sqrt [1/12 (n^2 - 1)] = 2
on squaring both sides
1/12 ( n^2 - 1) = 4
On multiplying both sides by 12
n^2 - 1 = 48
n2 = 48 + 1 = 49
n = sqrt 49 = 7
The value of n = 7
For data on frequency distribution of weights:70, 73, 49, 57, 44, 56, 71, 65, 62, 60, 50, 55, 49, 63 and 45 If we assume class length as 5, the number of class intervals would be - a)5
- b)7
- c)6
- d)8
- e)
Correct answer is option 'C'. Can you explain this answer?
For data on frequency distribution of weights:70, 73, 49, 57, 44, 56, 71, 65, 62, 60, 50, 55, 49, 63 and 45 If we assume class length as 5, the number of class intervals would be
a)
5
b)
7
c)
6
d)
8
e)
|
|
Poonam Reddy answered |
Correct Answer :- c
Explanation : We could choose intervals of 5. We then begin the scale with 44 and end with 73.
Class Interval
44 – 48
49 – 53
54 – 58
59 – 63
64 – 68
69 – 73
Geometric Mean of three observations 40, 50 and X is 10. The value of X is - a)2
- b)4
- c)1/2
- d)None of the above
Correct answer is option 'C'. Can you explain this answer?
Geometric Mean of three observations 40, 50 and X is 10. The value of X is
a)
2
b)
4
c)
1/2
d)
None of the above
|
|
Rishika Kumar answered |
Geometric Mean:
Geometric mean is the nth root of the product of n observations. For example, the geometric mean of two observations a and b is √(a*b).
Given:
Three observations are 40, 50, and X and the geometric mean of these observations is 10.
Solution:
The geometric mean of three observations is given by:
Geometric mean = ∛(40*50*X)
Given, geometric mean = 10
10 = ∛(40*50*X)
Cubing both sides, we get:
1000 = 40*50*X
X = 1000/(40*50)
X = 1/2
Therefore, the value of X is 1/2. Hence, option C is the correct answer.
The mean salary of a group of 50 persons is Rs. 5,850. Later on it is discovered that the salary of one employee has been wrongly taken as Rs.8,000 instead of Rs.7,800. The corrected mean salary is - a)Rs. 5,854
- b)Rs.5,846
- c)Rs.5,650
- d)None of the above
Correct answer is option 'B'. Can you explain this answer?
The mean salary of a group of 50 persons is Rs. 5,850. Later on it is discovered that the salary of one employee has been wrongly taken as Rs.8,000 instead of Rs.7,800. The corrected mean salary is
a)
Rs. 5,854
b)
Rs.5,846
c)
Rs.5,650
d)
None of the above
|
|
Akshat Choudhary answered |
Given information:
- Mean salary of a group of 50 persons = Rs. 5,850
- One employee's salary wrongly recorded as Rs. 8,000 instead of Rs. 7,800
To find: Corrected mean salary
Solution:
Step 1: Calculate the sum of salaries of all 50 persons
Total salary = 50 x 5,850 = Rs. 2,92,500
Step 2: Subtract the wrongly recorded salary (Rs. 8,000) and add the correct salary (Rs. 7,800)
Total salary = 2,92,500 - 8,000 + 7,800 = Rs. 2,92,300
Step 3: Calculate the corrected mean salary
Corrected mean salary = Total salary / Number of persons
Corrected mean salary = 2,92,300 / 50 = Rs. 5,846
Therefore, the corrected mean salary is Rs. 5,846, which is option (b).
Which measure of dispersion is the quickest to compute?- a)Standard deviation
- b)Quartile deviation
- c)Mean deviation
- d)Range
Correct answer is option 'D'. Can you explain this answer?
Which measure of dispersion is the quickest to compute?
a)
Standard deviation
b)
Quartile deviation
c)
Mean deviation
d)
Range
|
|
Nilanjan Saha answered |
Explanation:
Dispersion refers to the spread or variability of a set of data. Dispersion measures include Standard Deviation, Quartile Deviation, Mean Deviation, and Range. The quickest measure of dispersion to compute is the Range.
Range:
Range is the simplest measure of dispersion. It is the difference between the highest and the lowest value in a dataset. It is the quickest to calculate because it involves only two values and simple subtraction. It is often used as a quick measure of spread, especially when the dataset is small and the values are not too spread out.
Standard deviation:
Standard deviation is the most commonly used measure of dispersion. It measures how much the values in a dataset deviate from the mean. It is a more accurate measure of spread than the range, but it is also more complex to calculate. It involves squaring each value, finding the mean of those squared values, and then taking the square root of that mean. It is a useful measure of spread when the dataset is large and the values are spread out.
Quartile deviation:
Quartile deviation is a measure of the spread of a dataset based on the interquartile range. It is less sensitive to outliers than standard deviation. It is calculated by finding the difference between the first and third quartiles of the dataset. It is a useful measure of spread when the dataset is skewed or has outliers.
Mean deviation:
Mean deviation is the average of the absolute deviations of the values in a dataset from the mean. It is less commonly used than standard deviation and quartile deviation. It is calculated by finding the absolute value of the difference between each value and the mean, finding the mean of those absolute values, and then multiplying by a constant. It is a useful measure of spread when the dataset is small and the values are not too spread out.
Conclusion:
In conclusion, the quickest measure of dispersion to compute is the Range. It involves only two values and simple subtraction, making it easy to calculate. However, it is less accurate than standard deviation and quartile deviation, which are more commonly used when the dataset is large and the values are spread out.
For the observations 5,3,6,3,5,10,7,2 , there are —————— modes.
- a)2
- b)3
- c)4
- d)5
Correct answer is option 'A'. Can you explain this answer?
For the observations 5,3,6,3,5,10,7,2 , there are —————— modes.
a)
2
b)
3
c)
4
d)
5
|
|
Devanshi Rane answered |
Finding the Mode of a Set of Observations
To find the mode of a set of observations, we need to determine the value(s) that occur most frequently in the set.
Step 1: Arrange the observations in ascending or descending order.
2, 3, 3, 5, 5, 6, 7, 10
Step 2: Count the frequency of each value in the set.
2 occurs once
3 occurs twice
5 occurs twice
6 occurs once
7 occurs once
10 occurs once
Step 3: Identify the value(s) with the highest frequency.
In this case, the value with the highest frequency is 2, which occurs only once. However, since there are no other values with a frequency greater than one, there are no other modes in this set.
Therefore, the correct answer is option A, 2.
If the mean of a frequency distribution is 100 and coefficient of variation is 45% then standard deviation is:- a)45
- b)0.45
- c)4.5
- d)450
Correct answer is option 'A'. Can you explain this answer?
If the mean of a frequency distribution is 100 and coefficient of variation is 45% then standard deviation is:
a)
45
b)
0.45
c)
4.5
d)
450

|
Srsps answered |
Option (a) 45 is correct.
Explanation :-
Mean is the sum of the sample values divided by the no. Of samples.
Standard deviation expresses by how much the value of a no. diiffers from the mean value.
Here, direct formula is used.
Coefficient of variation= 45/100 = 0.45
Coefficient of variation= standard variation / Mean
Or, 0.45 = standard deviation / 100
Or standard deviation = 100 * 0.45
So, the standard deviation is :- 45
So, the standard deviation is :- 45
Which measure of dispersion is considered for finding a pooled measure of dispersion after combining several groups?- a)Mean deviation
- b)Standard deviation
- c)Quartile deviation
- d)Any of these
Correct answer is option 'B'. Can you explain this answer?
Which measure of dispersion is considered for finding a pooled measure of dispersion after combining several groups?
a)
Mean deviation
b)
Standard deviation
c)
Quartile deviation
d)
Any of these

|
Table Fan answered |
Only in standard deviation, you can find combined sd . whereas in others you can't find combined measure
If the difference between mean and Mode is 63, then the difference between Mean and Median will be ____________.- a)63
- b)31.5
- c)21
- d)None of the above
Correct answer is option 'C'. Can you explain this answer?
If the difference between mean and Mode is 63, then the difference between Mean and Median will be ____________.
a)
63
b)
31.5
c)
21
d)
None of the above
|
|
Deepika Desai answered |
Mean, Mode, and Median are measures of central tendency used to describe the distribution of a set of data. The mean is the average of all the values in a dataset, the mode is the value that appears most frequently, and the median is the middle value when the dataset is arranged in order.
Given that the difference between mean and mode is 63, we can say that:
Mean - Mode = 63
We can also say that the mode is smaller than the mean because the mean is an average of all the values, so it is influenced by larger values in the dataset. Therefore:
Mean > Mode
To find the relationship between the mean and median, we need to consider the distribution of the dataset. If the dataset is symmetrical, the mean and median will be the same. If the dataset is skewed, the mean will be pulled in the direction of the skew, and the median will be closer to the center of the dataset.
In this case, we do not have information about the distribution of the dataset, so we cannot determine whether the mean is greater or less than the median. However, we can use the fact that the mode is less than the mean to make an estimate of the difference between the mean and median.
If the mode is less than the mean, and the difference between the mean and mode is 63, then the median will be closer to the mode than the mean. Therefore, we can estimate that:
Mean - Median > 63/2 = 31.5
So, the difference between the mean and median will be approximately 31.5. Therefore, option (c) is the correct answer.
The average age of 15 students of a class is 15 years. Out of them, the average age of 5 students is 14 years and that of the other 9 students is 16 years. The age of the 15th students is:- a)11 years
- b)14 years
- c)15 years
- d)None of these
Correct answer is option 'A'. Can you explain this answer?
The average age of 15 students of a class is 15 years. Out of them, the average age of 5 students is 14 years and that of the other 9 students is 16 years. The age of the 15th students is:
a)
11 years
b)
14 years
c)
15 years
d)
None of these
|
|
Nandini Patel answered |
Age of the 15th student = [15 * 15 - (14 * 5 + 16 * 9)] = (225-214) = 11 years.
The algebraic sum of deviations of 8,1,6 from the A.M viz.5 is- a)-1
- b)0
- c)1
- d)none
Correct answer is option 'B'. Can you explain this answer?
The algebraic sum of deviations of 8,1,6 from the A.M viz.5 is
a)
-1
b)
0
c)
1
d)
none
|
|
Alok Mehta answered |
The algebraic sum of deviations of 8, 1, 6 from their A.M., viz 5, is:
(8 - 5) + (1 - 5) + (6 - 5) = 3 + (- 4) + 1 = 0.
The coefficient of mean deviation about mean for the first 9 natural numbers is- a)400/9
- b)80
- c)20/9
- d)50
Correct answer is option 'A'. Can you explain this answer?
The coefficient of mean deviation about mean for the first 9 natural numbers is
a)
400/9
b)
80
c)
20/9
d)
50

|
Sai Joshi answered |
To find the coefficient of mean deviation about mean, we need to first find the mean of the given data.
Finding the mean:
The first 9 natural numbers are: 1, 2, 3, 4, 5, 6, 7, 8, 9.
The sum of these numbers is: 1+2+3+4+5+6+7+8+9 = 45
The mean of these numbers is: 45/9 = 5
Finding the mean deviation about mean:
Mean deviation about mean is the average deviation of each data point from the mean.
To find the deviation of each data point from the mean, we subtract the mean from each data point.
Deviation of 1 from mean: 1-5 = -4
Deviation of 2 from mean: 2-5 = -3
Deviation of 3 from mean: 3-5 = -2
Deviation of 4 from mean: 4-5 = -1
Deviation of 5 from mean: 5-5 = 0
Deviation of 6 from mean: 6-5 = 1
Deviation of 7 from mean: 7-5 = 2
Deviation of 8 from mean: 8-5 = 3
Deviation of 9 from mean: 9-5 = 4
To find the mean deviation about mean, we take the absolute value of each deviation, add them up and divide by the number of data points.
Mean deviation about mean = (|-4| + |-3| + |-2| + |-1| + |0| + |1| + |2| + |3| + |4|)/9
= (4+3+2+1+0+1+2+3+4)/9
= 20/9
Finding the coefficient of mean deviation about mean:
The coefficient of mean deviation about mean is the mean deviation about mean divided by the mean.
Coefficient of mean deviation about mean = (20/9)/5
= 20/45
= 4/9
Multiplying this by 100 gives us the answer in percentage form.
Coefficient of mean deviation about mean = (4/9) x 100
= 44.44%
Therefore, the correct answer is option A) 400/9.
Simple average is sometimes called- a)weighted average
- b)unweighted average
- c)relative average
- d)none
Correct answer is option 'B'. Can you explain this answer?
Simple average is sometimes called
a)
weighted average
b)
unweighted average
c)
relative average
d)
none
|
|
Nitin Kumar answered |
Explanation:
Unweighted average or Simple average is a type of average where all the values in a data set are given equal importance or weightage. It is calculated by summing up all the values in the data set and dividing it by the total number of values.
Weighted average, on the other hand, is a type of average where each value in the data set is given a weightage based on its importance or relevance. It is calculated by multiplying each value by its respective weightage, summing up the products, and dividing it by the sum of the weightages.
Relative average is not a commonly used term in statistics or mathematics. It may refer to a type of average that takes into account the relative importance or frequency of each value in the data set. However, it is not a standard term and may have different meanings in different contexts.
Conclusion:
Simple average or Unweighted average is the correct term for an average that gives equal weightage to all values in a data set. Weighted average is used when different values have different levels of importance or relevance. Relative average is not a commonly used term and may have different meanings in different contexts.
If the mode of a data is 18 and mean is 24, then median is _________.- a)18
- b)24
- c)22
- d)21
Correct answer is option 'C'. Can you explain this answer?
If the mode of a data is 18 and mean is 24, then median is _________.
a)
18
b)
24
c)
22
d)
21
|
|
Tanvi Pillai answered |
Given: Mode = 18, Mean = 24
To find: Median
Formula to find Median:
For odd number of observations, Median = value of (n+1)/2th observation in the ordered data set
For even number of observations, Median = average of value of n/2th and (n/2 + 1)th observation in the ordered data set
Let's assume a data set with 5 observations, and the mode is 18. Since mode is the most frequent value in the data set, we can assume that there are two observations with value 18. Let's arrange the data set in ascending order:
18, 18, a, b, c
The mean of the data set is 24. We know that the sum of all observations in the data set divided by the number of observations gives the mean. Therefore, we can write:
(18 + 18 + a + b + c)/5 = 24
Simplifying the equation, we get:
a + b + c = 66
Now, we can use the formula to find the median. Since there are 5 observations in the data set, the median is the value of the 3rd observation, which is 'a'.
To find 'a', we need to use the fact that there are two observations with value 18. Let's consider two cases:
Case 1: If 'a' is also 18
In this case, the data set would be:
18, 18, 18, b, c
Using the equation a + b + c = 66, we get:
54 + b + c = 66
b + c = 12
The median would be the value of the 3rd observation, which is 18.
However, the mode of this data set would be 18, which contradicts the given information that the mode is 18. Therefore, we can discard this case.
Case 2: If 'a' is not 18
In this case, the data set would be:
18, 18, a, b, c
Using the equation a + b + c = 66, we get:
36 + b + c = 66
b + c = 30
Since 'b' and 'c' are both greater than or equal to 18 (otherwise, they would not contribute to the mean of 24), we can say that:
b + c >= 18 + 18 = 36
Therefore, the maximum value of 'a' can be:
a = 66 - 36 = 30
If 'a' is 30, then the data set would be:
18, 18, 30, b, c
The median would be the value of the 3rd observation, which is 30.
Therefore, the answer is option (c) 22.
The mean of the following data is 6.Find the value of 'P'.
x : 2 4 6 10 P+5
f : 3 2 3 1 2- a)4
- b)6
- c)8
- d)7
Correct answer is option 'D'. Can you explain this answer?
The mean of the following data is 6.Find the value of 'P'.
x : 2 4 6 10 P+5
f : 3 2 3 1 2
x : 2 4 6 10 P+5
f : 3 2 3 1 2
a)
4
b)
6
c)
8
d)
7
|
|
Raghav Ghoshal answered |
Given data:
x : 2 4 6 10 P 5
f : 3 2 3 1 2
Mean = 6
To find: Value of P
Solution:
Step 1: Find the sum of the given data
2×3 + 4×2 + 6×3 + 10×1 + P×2 + 5×2 = 6×(3+2+3+1+2)
Step 2: Simplify the above equation
6 + 8 + 18 + 10 + 2P + 10 = 90
2P = 90 - 52
2P = 38
P = 19
Therefore, the value of P is 19.
Answer: Option D
Which measures of dispersions is not affected by the presence of extreme observations?- a)Range
- b)Mean deviation
- c) Standard deviation
- d)Quartile deviation
Correct answer is option 'D'. Can you explain this answer?
Which measures of dispersions is not affected by the presence of extreme observations?
a)
Range
b)
Mean deviation
c)
Standard deviation
d)
Quartile deviation
|
|
Jayant Mishra answered |
The first variety may be preferred since it is more consistent in yield performance. From the above example, it is obvious that a measure of central tendency alone is not sufficient to describe a frequency distribution. In addition to it we should have a measure of scatterness of observations. The scatterness or variation of observations from their average is called the dispersion. There are different measures of dispersion like the range, the quartile deviation, the mean deviation and the standard deviation.
The median of the numbers 11, 10, 12, 13, 9 is- a)12.5
- b)12
- c)10.5
- d)11
Correct answer is option 'D'. Can you explain this answer?
The median of the numbers 11, 10, 12, 13, 9 is
a)
12.5
b)
12
c)
10.5
d)
11
|
|
Jagruti Prajapati answered |
First of all 11,10,12,13&9 set in to ascending order
=9,10,11,12,13
now median =n + 1/2 th observation
n= 5
5 +1/2
=6/2
=3rd observation that is 11
median is 11
=9,10,11,12,13
now median =n + 1/2 th observation
n= 5
5 +1/2
=6/2
=3rd observation that is 11
median is 11
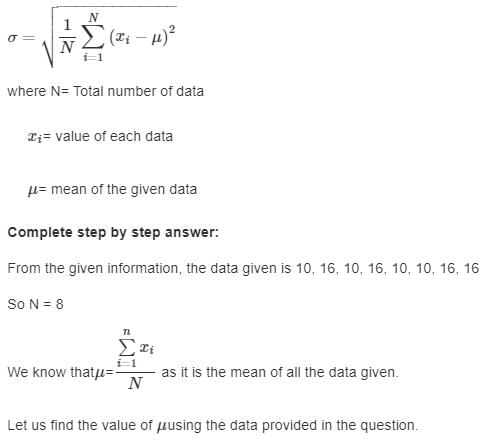
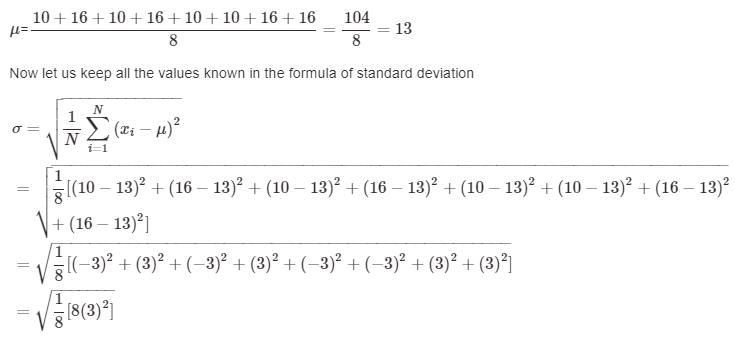
The standard deviation of, 10, 16, 10, 16, 10, 10, 16, 16 is
- a)4
- b)6
- c)3
- d)0
Correct answer is option 'C'. Can you explain this answer?
The standard deviation of, 10, 16, 10, 16, 10, 10, 16, 16 is
a)
4
b)
6
c)
3
d)
0
|
|
Dhruv Mehra answered |
The Standard Deviation is a measure of how spread out numbers are. To calculate the standard deviation of those numbers, we just need to do the following steps.
1. Find the value of Mean of the given numbers(the simple average of the numbers)
2. Then for each number: subtract the Mean and square the result
3. Then work out the mean of those squared differences.
4. Take the square root of the resulted value and we are done.
By converting the above statements into a formula we get
The formula for finding standard deviation(σ) is
= 3.
Therefore the standard deviation of the given numbers 10, 16, 10, 16, 10, 10, 16, 16 is 3.
Therefore the standard deviation of the given numbers 10, 16, 10, 16, 10, 10, 16, 16 is 3.
For any two numbers SD is always- a)Twice the range
- b)Half of the range
- c)Square of the range
- d)None of these
Correct answer is option 'B'. Can you explain this answer?
For any two numbers SD is always
a)
Twice the range
b)
Half of the range
c)
Square of the range
d)
None of these
|
|
Sameer Basu answered |
Explanation:
The given statement is "For any two numbers SD is always"
SD stands for Standard Deviation which is a measure of the dispersion of a set of data values.
The options given are:
a) Twice the range
b) Half of the range
c) Square of the range
d) None of these
Range is the difference between the maximum and minimum values of a set of data.
To understand the relationship between SD and range, we need to know the formula for calculating SD.
Formula for calculating SD:
SD = √[(∑(x - μ)²)/n]
where,
x = data values
μ = mean of the data
n = number of data values
From this formula, we can see that SD depends on the deviation of each data value from the mean.
Now, let's consider the options given:
a) Twice the range:
Range = maximum value - minimum value
SD = √[(∑(x - μ)²)/n]
There is no direct relationship between range and SD. So, option (a) is incorrect.
b) Half of the range:
Range = maximum value - minimum value
SD = √[(∑(x - μ)²)/n]
There is no direct relationship between range and SD. So, option (b) is incorrect.
c) Square of the range:
Range = maximum value - minimum value
SD = √[(∑(x - μ)²)/n]
There is no direct relationship between range and SD. So, option (c) is incorrect.
d) None of these:
As we have seen above, there is no direct relationship between range and SD. So, option (d) could be the correct answer.
Conclusion:
None of the options given is correct. Therefore, the correct answer to the question is "None of these".
The range of 15, 12, 10, 9, 17, 20 is- a)5
- b)12
- c)13
- d)11
Correct answer is option 'D'. Can you explain this answer?
The range of 15, 12, 10, 9, 17, 20 is
a)
5
b)
12
c)
13
d)
11
|
|
Mehul Saini answered |
Finding the range of a set of numbers involves finding the difference between the largest and smallest numbers in the set. In this case, the set of numbers is 15, 12, 10, 9, 17, 20.
Calculating the Range:
1. Find the largest number in the set:
- The largest number in the set is 20.
2. Find the smallest number in the set:
- The smallest number in the set is 9.
3. Subtract the smallest number from the largest number:
- 20 - 9 = 11
Therefore, the range of the set of numbers is 11.
Answer: d) 11
The value of the middlemost item when they are arranged in order of magnitude is called- a)standard deviation
- b)mean
- c)mode
- d)median
Correct answer is option 'D'. Can you explain this answer?
The value of the middlemost item when they are arranged in order of magnitude is called
a)
standard deviation
b)
mean
c)
mode
d)
median

|
Pragati Jadhav answered |
By the definition of median , median means middle value of observation after arranging them in ascending or descending order
G.M of 8, 4,2 is- a)4
- b)2
- c)8
- d)none
Correct answer is option 'A'. Can you explain this answer?
G.M of 8, 4,2 is
a)
4
b)
2
c)
8
d)
none
|
|
Ruchi Mishra answered |
Finding the Geometric Mean (GM) of 8, 4, and 2 involves multiplying the numbers together and then taking the nth root of the product, where n is the number of numbers being multiplied.
Calculation:
- Multiply the numbers together: 8 x 4 x 2 = 64.
- Take the cube root of the product since there are three numbers: ∛64 = 4.
Therefore, the GM of 8, 4, and 2 is 4, which is option A.
Calculation:
- Multiply the numbers together: 8 x 4 x 2 = 64.
- Take the cube root of the product since there are three numbers: ∛64 = 4.
Therefore, the GM of 8, 4, and 2 is 4, which is option A.
Chapter doubts & questions for Measures of Central tendency & Data - Elementary Mathematics for CDS 2025 is part of CDS exam preparation. The chapters have been prepared according to the CDS exam syllabus. The Chapter doubts & questions, notes, tests & MCQs are made for CDS 2025 Exam. Find important definitions, questions, notes, meanings, examples, exercises, MCQs and online tests here.
Chapter doubts & questions of Measures of Central tendency & Data - Elementary Mathematics for CDS in English & Hindi are available as part of CDS exam.
Download more important topics, notes, lectures and mock test series for CDS Exam by signing up for free.
Elementary Mathematics for CDS
174 videos|104 docs|134 tests
|
|
© EduRev
|
Education Revolution
|


|


Signup on EduRev and stay on top of your study goals
10M+ students crushing their study goals daily