All Exams >
ACT >
Mathematics for ACT >
All Questions
All questions of Basic Statistics for ACT Exam
The data given below shows the marks obtained by various students.
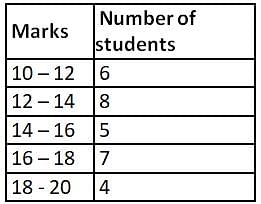
What is the mean marks (Correct up to two decimal places) of given data? - a)13.67
- b)14.67
- c)15.33
- d)13.33
Correct answer is option 'B'. Can you explain this answer?
The data given below shows the marks obtained by various students.

What is the mean marks (Correct up to two decimal places) of given data?

What is the mean marks (Correct up to two decimal places) of given data?
a)
13.67
b)
14.67
c)
15.33
d)
13.33
|
|
Ayesha Joshi answered |

⇒ n = total frequency
∑fx = Sumoftheproductofmid − intervalvaluesandtheircorrespondingfrequency
Mid value of 10 – 12 = (10 + 12)/2 = 11
Mid value of 12 – 14 = (12 + 14 )/2 = 13
Mid value of 14 – 16 = (14 + 16 )/2 = 15
Mid value of 16 – 18 = (16 + 18 )/2 = 17
Mid value of 18 – 20 = (18 + 20 )/2 = 19

⇒ Mean = 14.67

⇒ Mean = 14.67
∴The mean marks of the given data are 14.67
What is the standard deviation of the observations−√6, −√5, −√4, −1, 1, √4, √5, √6?- a)√2
- b)2
- c)2√2
- d)4
Correct answer is option 'B'. Can you explain this answer?
What is the standard deviation of the observations
−√6, −√5, −√4, −1, 1, √4, √5, √6?
a)
√2
b)
2
c)
2√2
d)
4
|
|
Dominic Stewart answered |
Calculating the Standard Deviation:
To calculate the standard deviation of a set of observations, we first need to find the mean of the observations. Once we have the mean, we can then find the squared differences between each observation and the mean, sum these squared differences, divide by the total number of observations, and take the square root of the result to get the standard deviation.
Given Observations:
- √6, -√5, -√4, -1, 1, √4, √5, √6
Finding the Mean:
1. Add all the observations together: √6 + (-√5) + (-√4) + (-1) + 1 + √4 + √5 + √6 = 2√6
2. Divide by the total number of observations (8): 2√6 / 8 = √6 / 4 = √6 / 4
Calculating the Squared Differences:
1. Subtract the mean from each observation and square the result:
- (√6 - √6 / 4)^2 = (3√6 / 4)^2 = 9 / 16 * 6 = 9 / 4
- (-√5 - √6 / 4)^2 = (-5√4 / 4)^2 = 25 / 16 * 4 = 25 / 4
- and so on for all observations
Sum of Squared Differences:
Add up all the squared differences: 9 / 4 + 25 / 4 + ... = 56
Calculating the Standard Deviation:
1. Divide the sum of squared differences by the total number of observations (8): 56 / 8 = 7
2. Take the square root of the result: √7 ≈ 2.65
Therefore, the standard deviation of the given observations is approximately 2.65, which is closest to option B: 2.
Comprehension:Direction: Based on the following information, answer the questions.For an experiment, a sample of 25 observations from normal distribution with mean 98.6 and s.d. 17.2 was selected. Answer the following questions:What is the standard error of mean, for the population size to be 100?- a)2.993
- b)2.15
- c)4.12
- d)5
Correct answer is option 'A'. Can you explain this answer?
Comprehension:
Direction: Based on the following information, answer the questions.
For an experiment, a sample of 25 observations from normal distribution with mean 98.6 and s.d. 17.2 was selected. Answer the following questions:
What is the standard error of mean, for the population size to be 100?
a)
2.993
b)
2.15
c)
4.12
d)
5
|
|
Victoria Walsh answered |
Standard Error of Mean:
- The standard error of the mean (SEM) is a measure of the variability in the sample mean. It tells us how accurately the sample mean represents the population mean.
- It is calculated by dividing the standard deviation of the sample by the square root of the sample size.
- The formula for calculating the SEM is SEM = σ / √n, where σ represents the standard deviation and n represents the sample size.
Given Information:
- Mean of the population (μ) = 98.6
- Standard deviation of the population (σ) = 17.2
- Sample size (n) = 25
Calculating the Standard Error of Mean:
- To calculate the standard error of the mean, we need to find the standard deviation (σ) of the sample.
- Since we don't have the individual data points, we use the formula σ = σ / √n, where σ represents the standard deviation of the population and n represents the sample size.
- Plugging in the values, we get σ = 17.2 / √25 = 17.2 / 5 = 3.44.
Answer and Explanation:
- The standard error of the mean for a population size of 100 is given by σ / √n, where σ is the standard deviation of the sample and n is the sample size.
- Plugging in the values, we get SEM = 3.44 / √100 = 3.44 / 10 = 0.344.
- However, the options provided for the answer are not in decimal form. So, we need to convert 0.344 to the nearest whole number.
- Rounding 0.344 to the nearest whole number, we get 0.34.
- Since the options provided are in whole numbers, we can conclude that the correct answer is option 'A': 2.993 (rounded to the nearest whole number).
- Therefore, the standard error of the mean for a population size of 100 is approximately 2.993.
Note: The answer could be rounded differently depending on the rounding rule used. However, option 'A' is the closest whole number to the calculated value.
What is the mean of the range, mode and median of the data given below?5, 10, 3, 6, 4, 8, 9, 3, 15, 2, 9, 4, 19, 11, 4- a)10
- b)12
- c)8
- d)9
Correct answer is option 'D'. Can you explain this answer?
What is the mean of the range, mode and median of the data given below?
5, 10, 3, 6, 4, 8, 9, 3, 15, 2, 9, 4, 19, 11, 4
a)
10
b)
12
c)
8
d)
9
|
|
Ayesha Joshi answered |
Given:
The given data is 5, 10, 3, 6, 4, 8, 9, 3, 15, 2, 9, 4, 19, 11, 4
Concept used:
The mode is the value that appears most frequently in a data set
At the time of finding Median
First, arrange the given data in the ascending order and then find the term
Formula used:
Mean = Sum of all the terms/Total number of terms
Median = {(n + 1)/2}th term when n is odd
Median = 1/2[(n/2)th term + {(n/2) + 1}th] term when n is even
Range = Maximum value – Minimum value
Calculation:
Arranging the given data in ascending order
2, 3, 3, 4, 4, 4, 5, 6, 8, 9, 9, 10, 11, 15, 19
Here, Most frequent data is 4 so
Mode = 4
Total terms in the given data, (n) = 15 (It is odd)
Median = {(n + 1)/2}th term when n is odd
⇒ {(15 + 1)/2}th term
⇒ (8)th term
⇒ 6
Now, Range = Maximum value – Minimum value
⇒ 19 – 2 = 17
Mean of Range, Mode and median = (Range + Mode + Median)/3
⇒ (17 + 4 + 6)/3
⇒ 27/3 = 9
∴ The mean of the Range, Mode and Median is 9
If the mean of a frequency distribution is 100 and the coefficient of variation is 45%, then what is the value of the variance?- a)2025
- b)450
- c)45
- d)4.5
Correct answer is option 'A'. Can you explain this answer?
If the mean of a frequency distribution is 100 and the coefficient of variation is 45%, then what is the value of the variance?
a)
2025
b)
450
c)
45
d)
4.5
|
|
Ayesha Joshi answered |
Concept:
Coefficient of variation = Standard Deviation/Mean
Variance = (Standard Deviation)2
Calculation:
Given coefficient of variation = 45% = 0.45
And mean = 100
As Coefficient of variation = Standard Deviation/Mean
0.45 = Standard Deviation/100
Standard Deviation = 100 × 0.45
SD = 45
∴ Variance = 452 = 2025
Comprehension:Direction: Based on the following information, answer the questions.For an experiment, a sample of 25 observations from normal distribution with mean 98.6 and s.d. 17.2 was selected. Answer the following questions:What is the standard error of mean?- a)3.44
- b)4.15
- c)17.2
- d)3
Correct answer is option 'A'. Can you explain this answer?
Comprehension:
Direction: Based on the following information, answer the questions.
For an experiment, a sample of 25 observations from normal distribution with mean 98.6 and s.d. 17.2 was selected. Answer the following questions:
What is the standard error of mean?
a)
3.44
b)
4.15
c)
17.2
d)
3

|
Orion Classes answered |
Concept:
The standard error of mean:


Calculation:
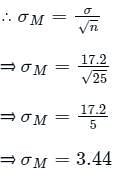
We have σ = 17.2
Sample size, n = 25

Find the mean of given data:

- a)39.95
- b)35.70
- c)43.95
- d)23.95
Correct answer is option 'B'. Can you explain this answer?
Find the mean of given data:


a)
39.95
b)
35.70
c)
43.95
d)
23.95

|
Orion Classes answered |
Formula used:
The mean of grouped data is given by,


Xi = mean of ith class
fi = frequency corresponding to ith class
Given:


Calculation:
Now, to calculate the mean of data will have to find ∑fiXi and ∑fi as below,
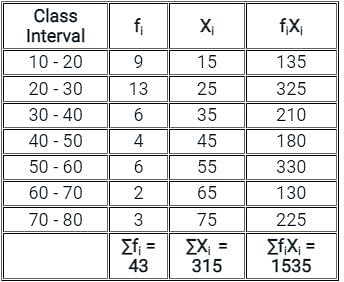

Then,
We know that, mean of grouped data is given by


= 35.7
Hence, the mean of the grouped data is 35.7
Consider the following distribution:
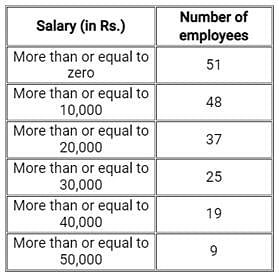
The frequency of class interval 30,000 - 40,000 is:- a)25
- b)12
- c)6
- d)19
Correct answer is option 'C'. Can you explain this answer?
Consider the following distribution:

The frequency of class interval 30,000 - 40,000 is:

The frequency of class interval 30,000 - 40,000 is:
a)
25
b)
12
c)
6
d)
19

|
Orion Classes answered |
Concept:
- Frequency of any class = cumulative frequency of class - cumulative frequency of preceding class
- Cumulative frequency is the sum of all the previous frequencies up to the current point.
Calculation:
We are already having the cumulative frequencies. Let's find out the frequencies:
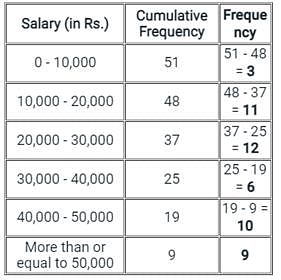
Hence, the frequency of class intervals 30,000 - 40,000 is 6.

Hence, the frequency of class intervals 30,000 - 40,000 is 6.
Find the median of the given set of numbers 2, 6, 6, 8, 4, 2, 7, 9- a)6
- b)8
- c)4
- d)5
Correct answer is option 'A'. Can you explain this answer?
Find the median of the given set of numbers 2, 6, 6, 8, 4, 2, 7, 9
a)
6
b)
8
c)
4
d)
5
|
|
Evelyn Rivera answered |
Median:
The median is the middle value in a set of numbers when they are arranged in order. To find the median, we need to arrange the numbers in ascending order.
Given set of numbers:
2, 6, 6, 8, 4, 2, 7, 9
Arranging the numbers in ascending order:
2, 2, 4, 6, 6, 7, 8, 9
Finding the middle value:
Since there are 8 numbers in the set, the middle value will be the average of the two middle numbers when arranged in ascending order. In this case, the two middle numbers are 6 and 6. Therefore, the median is (6 + 6) / 2 = 12 / 2 = 6.
Hence, the correct answer is option A) 6.
Comprehension:Direction: Based on the following information, answer the questions.For an experiment, a sample of 25 observations from normal distribution with mean 98.6 and s.d. 17.2 was selected. Answer the following questions:Find the corresponding probability given a sample of 36- a)0.8723
- b)0.8
- c)0.745
- d)0.8892
Correct answer is option 'A'. Can you explain this answer?
Comprehension:
Direction: Based on the following information, answer the questions.
For an experiment, a sample of 25 observations from normal distribution with mean 98.6 and s.d. 17.2 was selected. Answer the following questions:
Find the corresponding probability given a sample of 36
a)
0.8723
b)
0.8
c)
0.745
d)
0.8892

|
Orion Classes answered |
Concept:
If a random sample of size n is taken from a population with mean μ and s.d. σ, then the sample distribution of X (sample mean) has a mean equal to population mean i.e., μ and a s.d. σM
Therefore, follows standard normal distribution.
Therefore,
 follows standard normal distribution.
Calculation:
We have μ = 98.6, σM=2.86

⇒ - 2.3 < Z < 1.19

= P(- 2.3 < Z < 1.19)
= FZ(1.19) − FZ(−2.3)
= 0.4843 + 0.3830
= 0.8723
If the standard deviation of 0, 1, 2, 3 ______ 9 is K, then the standard deviation of 10, 11, 12, 13 _____ 19 will be:- a)K + 1
- b)K
- c)K + 4
- d)K + 8
Correct answer is option 'B'. Can you explain this answer?
If the standard deviation of 0, 1, 2, 3 ______ 9 is K, then the standard deviation of 10, 11, 12, 13 _____ 19 will be:
a)
K + 1
b)
K
c)
K + 4
d)
K + 8
|
|
Ayesha Joshi answered |
Formula Used∶
- σ2 = ∑(xi – x)2/n
- Standard deviation is same when each element is increased by the same constant
Calculation:
Since each data increases by 10,
There will be no change in standard deviation because (xi – x) remains same.
∴ The standard deviation of 10, 11, 12, 13 _____ 19 will be will be K.
Comprehension:Direction: Based on the following information, answer the questions.For an experiment, a sample of 25 observations from normal distribution with mean 98.6 and s.d. 17.2 was selected. Answer the following questions:What is the standard error of mean for a sample size n = 36?- a)2.86
- b)3.123
- c)4
- d)0.478
Correct answer is option 'A'. Can you explain this answer?
Comprehension:
Direction: Based on the following information, answer the questions.
For an experiment, a sample of 25 observations from normal distribution with mean 98.6 and s.d. 17.2 was selected. Answer the following questions:
What is the standard error of mean for a sample size n = 36?
a)
2.86
b)
3.123
c)
4
d)
0.478
|
|
Evan Parker answered |
Standard Error of Mean:
The standard error of the mean (SEM) is a measure of the precision of the sample mean as an estimate of the population mean. It indicates the average amount of variability or dispersion in the sample means across multiple samples.
Given Information:
- Sample size (n) = 25
- Mean (μ) = 98.6
- Standard deviation (σ) = 17.2
Formula:
The standard error of the mean can be calculated using the formula:
SEM = σ / √n
where σ is the standard deviation and n is the sample size.
Calculating Standard Error of Mean:
In this case, we are given a sample size of 25. However, we need to calculate the standard error of the mean for a sample size of 36.
Using the formula, we can calculate the standard error of the mean as follows:
SEM = 17.2 / √36
= 17.2 / 6
= 2.86
Answer:
Therefore, the standard error of the mean for a sample size of 36 is 2.86.
Summary:
- The standard error of the mean (SEM) is a measure of the precision of the sample mean as an estimate of the population mean.
- It is calculated using the formula SEM = σ / √n, where σ is the standard deviation and n is the sample size.
- In this case, the standard error of the mean for a sample size of 36 is 2.86.
The mean of four numbers is 37. The mean of the smallest three of them is 34. If the range of the data is 15, what is the mean of the largest three?- a)41
- b)38
- c)40
- d)39
Correct answer is option 'D'. Can you explain this answer?
The mean of four numbers is 37. The mean of the smallest three of them is 34. If the range of the data is 15, what is the mean of the largest three?
a)
41
b)
38
c)
40
d)
39
|
|
Ayesha Joshi answered |
Calculation:
Let the numbers be x1, x2, x3, x4.
The mean of four numbers x1, x2, x3, x4 = 37
The sum of four numbers x1, x2, x3, x4 = 37 × 4 = 148.
The mean of the smallest three numbers x1, x2, x3 = 34
The sum of the smallest three numbers x1, x2, x3 = 34 × 3 = 102.
∴ The value of the largest number x4 = 148 – 102 = 46.
The Range (Difference between largest and smallest value) x4 – x1 = 15.
∴ Smallest number x1 = 46 – 15 = 31.
Now,
The sum of x2, x3 = Total sum – (sum of smallest and largest number).
⇒ 148 – (46 + 31)
⇒ 148 – 77
⇒ 71
Now,
The mean of the Largest three numbers x2, x3, x4 = (71 + 46)/3 = 117/3 = 39
Comprehension:Direction: Based on the following information, answer the questions.For an experiment, a sample of 25 observations from normal distribution with mean 98.6 and s.d. 17.2 was selected. Answer the following questions:
What is P(92 <  < 102)?
- a)0.8115
- b)0.8741
- c)0.7856
- d)0.8834
Correct answer is option 'A'. Can you explain this answer?
Comprehension:
Direction: Based on the following information, answer the questions.
For an experiment, a sample of 25 observations from normal distribution with mean 98.6 and s.d. 17.2 was selected. Answer the following questions:
What is P(92 < < 102)?
What is P(92 <
 < 102)?
a)
0.8115
b)
0.8741
c)
0.7856
d)
0.8834
|
|
Ayesha Joshi answered |
Concept:
If a random sample of size n is taken from a population with mean μ and s.d. σ, then the sample distribution of X (sample mean) has a mean equal to population mean i.e., μ and a s.d. σM
Therefore, follows standard normal distribution.
Therefore,
 follows standard normal distribution.
Calculation:
We have μ = 98.6, σM=2.86

⇒ - 1.918 < Z < 0.988

= P(- 1.918 < Z < 0.988)
= FZ(0.988) − FZ(−1.918)
= 0.3389 + 0.4726
= 0.8115
If mean and mode of some data are 4 & 10 respectively, its median will be:- a)1.5
- b)5.3
- c)16
- d)6
Correct answer is option 'D'. Can you explain this answer?
If mean and mode of some data are 4 & 10 respectively, its median will be:
a)
1.5
b)
5.3
c)
16
d)
6
|
|
Ayesha Joshi answered |
Concept:
Mean: The mean or average of a data set is found by adding all numbers in the data set and then dividing by the number of values in the set.
Mode: The mode is the value that appears most frequently in a data set.
Median: The median is a numeric value that separates the higher half of a set from the lower half.
Relation b/w mean, mode and median:
Mode = 3(Median) - 2(Mean)
Calculation:
Given that,
mean of data = 4 and mode of data = 10
We know that
Mode = 3(Median) - 2(Mean)
⇒ 10 = 3(median) - 2(4)
⇒ 3(median) = 18
⇒ median = 6
Hence, the median of data will be 6.
Chapter doubts & questions for Basic Statistics - Mathematics for ACT 2025 is part of ACT exam preparation. The chapters have been prepared according to the ACT exam syllabus. The Chapter doubts & questions, notes, tests & MCQs are made for ACT 2025 Exam. Find important definitions, questions, notes, meanings, examples, exercises, MCQs and online tests here.
Chapter doubts & questions of Basic Statistics - Mathematics for ACT in English & Hindi are available as part of ACT exam.
Download more important topics, notes, lectures and mock test series for ACT Exam by signing up for free.
Mathematics for ACT
144 videos|100 docs|61 tests
|
Signup to see your scores go up within 7 days!
Study with 1000+ FREE Docs, Videos & Tests
10M+ students study on EduRev

Contact Support
Our team is online on weekdays between 10 AM - 7 PM
Typical reply within 3 hours
|
Free Exam Preparation
at your Fingertips!
Access Free Study Material - Test Series, Structured Courses, Free Videos & Study Notes and Prepare for Your Exam With Ease

 Join the 10M+ students on EduRev
|

|
Forgot Password
OR
Signup to see your scores
go up within 7 days!
Access 1000+ FREE Docs, Videos and Tests
Takes less than 10 seconds to signup


