All Exams >
ACT >
Science for ACT >
All Questions
All questions of Data Representation for ACT Exam
A student was interested in determining the relationship between the current, voltage, and resistance in a direct circuit, such as those exemplified by batteries connected to light bulbs. The student built the circuit presented in Figure 1 using a 2 ohm resistor.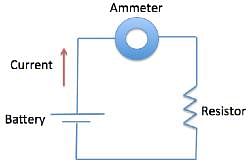
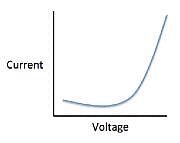
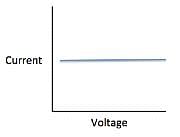
The current that flows through the circuit can be calculated using the equation V=IR, where V is the voltage of the battery, I is the current flowing through the circuit, and R is the resistance of the resistor.The student used a 2 ohm resistor and batteries of various voltages to obtain the results in Table 1. The currents shown in the table are NOT calculated using the formula V=IR, but instead directly measured from the circuit using an ammeter. It is important to note that the measured current will only exactly equal the calculated current if the system contains no internal resistance.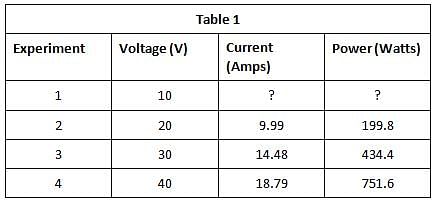 Q. Which of the following shows a possible graphical relationship between current and voltage?
- a)
- b)
- c)
- d)
Correct answer is option 'B'. Can you explain this answer?
A student was interested in determining the relationship between the current, voltage, and resistance in a direct circuit, such as those exemplified by batteries connected to light bulbs. The student built the circuit presented in Figure 1 using a 2 ohm resistor.

The current that flows through the circuit can be calculated using the equation V=IR, where V is the voltage of the battery, I is the current flowing through the circuit, and R is the resistance of the resistor.
The student used a 2 ohm resistor and batteries of various voltages to obtain the results in Table 1. The currents shown in the table are NOT calculated using the formula V=IR, but instead directly measured from the circuit using an ammeter. It is important to note that the measured current will only exactly equal the calculated current if the system contains no internal resistance.

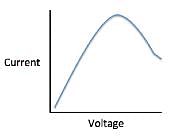
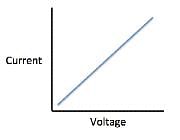
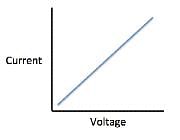
Q. Which of the following shows a possible graphical relationship between current and voltage?
a)

b)

c)

d)

|
|
Ayesha Joshi answered |
Using the formula V=IR, we see that voltage and current are directly related, meaning that as one increases, the other increases proportionally. The only graph that gives us this linear relationship is
A student was interested in determining the relationship between the current, voltage, and resistance in a direct circuit, such as those exemplified by batteries connected to light bulbs. The student built the circuit presented in Figure 1 using a 2 ohm resistor.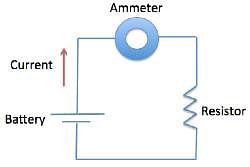
The current that flows through the circuit can be calculated using the equation V=IR, where V is the voltage of the battery, I is the current flowing through the circuit, and R is the resistance of the resistor.The student used a 2 ohm resistor and batteries of various voltages to obtain the results in Table 1. The currents shown in the table are NOT calculated using the formula V=IR, but instead directly measured from the circuit using an ammeter. It is important to note that the measured current will only exactly equal the calculated current if the system contains no internal resistance.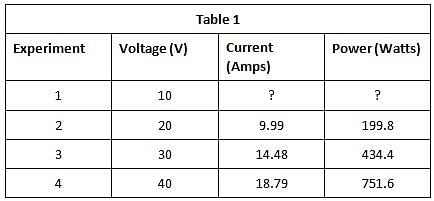 Q. In Experiment 1, how much current is most likely flowing through the circuit?
- a)10 amps
- b)1 amps
- c)12 amps
- d)5 amps
Correct answer is option 'D'. Can you explain this answer?
A student was interested in determining the relationship between the current, voltage, and resistance in a direct circuit, such as those exemplified by batteries connected to light bulbs. The student built the circuit presented in Figure 1 using a 2 ohm resistor.

The current that flows through the circuit can be calculated using the equation V=IR, where V is the voltage of the battery, I is the current flowing through the circuit, and R is the resistance of the resistor.
The student used a 2 ohm resistor and batteries of various voltages to obtain the results in Table 1. The currents shown in the table are NOT calculated using the formula V=IR, but instead directly measured from the circuit using an ammeter. It is important to note that the measured current will only exactly equal the calculated current if the system contains no internal resistance.

Q. In Experiment 1, how much current is most likely flowing through the circuit?
a)
10 amps
b)
1 amps
c)
12 amps
d)
5 amps

|
Orion Classes answered |
The passage provides us with a formula to calculate the amount of current running through the circuit, V=IR. We are told the voltage in Experiment 1 is 10 V and the resistor is 2 ohms, so


The Ideal Gas Law is as follows:PV=nRT P is pressure as measured in Pascals, V is volume as measured in cubic meters, n is the number of moles of the gas, R is the gas constant known as 8.314 Joules per mole times Kelvin, and T is the temperature measured in Kelvin.A class of students began studying the Ideal Gas Law and how the Pressure and the Volume relate to one another. They took 20 moles of a sample gas and kept the room at a temperature of 300 Kelvin. They then used different sized containers of the gas to limit and expand the volume. At each different volume, they measure the pressure of the gas on its container. The table they made from their results is seen in table 1.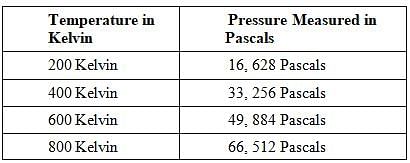 TABLE 1
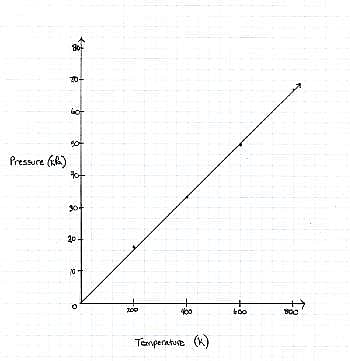 FIGURE 1The graph the students made based on the data is seen in Figure 1.Pressure is created by the movement of the gas molecules pushing against a container. 0 Kelvin is known as absolute 0, the temperature at which all molecule movement theoretically stops.Q. Describe the relationship between the temperature and the pressure.
- a)They are inversely related. As temperature decreases, pressure increases.
- b)They are unrelated.
- c)They are directly related. As temperature increases, so does pressure.
- d)The pressure remains the same no matter the temperature.
Correct answer is option 'C'. Can you explain this answer?
The Ideal Gas Law is as follows:
PV=nRT
P is pressure as measured in Pascals, V is volume as measured in cubic meters, n is the number of moles of the gas, R is the gas constant known as 8.314 Joules per mole times Kelvin, and T is the temperature measured in Kelvin.
A class of students began studying the Ideal Gas Law and how the Pressure and the Volume relate to one another. They took 20 moles of a sample gas and kept the room at a temperature of 300 Kelvin. They then used different sized containers of the gas to limit and expand the volume. At each different volume, they measure the pressure of the gas on its container. The table they made from their results is seen in table 1.

TABLE 1

FIGURE 1
The graph the students made based on the data is seen in Figure 1.
Pressure is created by the movement of the gas molecules pushing against a container. 0 Kelvin is known as absolute 0, the temperature at which all molecule movement theoretically stops.
Q. Describe the relationship between the temperature and the pressure.
a)
They are inversely related. As temperature decreases, pressure increases.
b)
They are unrelated.
c)
They are directly related. As temperature increases, so does pressure.
d)
The pressure remains the same no matter the temperature.

|
Orion Classes answered |
For every increase in temperature, there is a definite increase in pressure that can be found in the Ideal Gas Law equation. When the equation is solved for pressure

it can be thought of as the slope-intercept form of a line, with the y-intercept as 0 and the  as the slope in front of the x-coordinate, which in this case is temperature.
 as the slope in front of the x-coordinate, which in this case is temperature.
 Current high levels of fossil fuel use, including coal-burning power plants and gasoline-powered automobiles, have helped contribute to the high concentrations of sulfur trioxide, SO3, found in the atmosphere. When sulfur trioxide and water interact, they can undergo the following chemical reaction to produce sulfuric acid, which is the main contributor to acid rain worldwide: SO3 + H2O ⇌ H2SO4 Acid rain showers are particularly common near coal-burning power plants and large cities. These showers are responsible for significant economic damage to sidewalks, roads, and buildings. Scientists interested in studying the effects of acid rain often use basic substances like calcium carbonate, the main component of limestone buildings, and expose them to varying volumes of acid rain to determine what volume of acid rain is necessary to begin to erode a building. A sample graph of one scientist’s experiment is replicated below: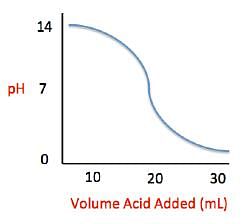 Measuring acid and base levels is commonly done with a scale called pH, which uses the concentration of hydrogen ions to determine the acidity. Hydrogen ions are in a balance with hydroxide ions to give a scale with a range from 0 to 14. Values equal to or between 0 and 6.9 represent the acidic range where hydrogen ions predominate and values equal to or ranging from 7.1 and 14 represent the basic range where hydroxide ions predominate. Thus, the more hydrogen ions present, the more acidic the solution.Scientists can tell when a titration (pH) experiment passes a certain pH using compounds called indicators. Indicators are usually colorless at pH levels below that of their specified color change. A table of indicators used by the above scientists and the pH at which they change colors is presented below.
  Q. The relationship between pH and volume of acid added can best be described as which of the following?
- a)Indirectly Proportional
- b)Directly Proportional
- c)Inversely Proportional
- d)Sigmoidal (S-shaped)
Correct answer is option 'D'. Can you explain this answer?
Current high levels of fossil fuel use, including coal-burning power plants and gasoline-powered automobiles, have helped contribute to the high concentrations of sulfur trioxide, SO3, found in the atmosphere. When sulfur trioxide and water interact, they can undergo the following chemical reaction to produce sulfuric acid, which is the main contributor to acid rain worldwide:
SO3 + H2O ⇌ H2SO4
Acid rain showers are particularly common near coal-burning power plants and large cities. These showers are responsible for significant economic damage to sidewalks, roads, and buildings. Scientists interested in studying the effects of acid rain often use basic substances like calcium carbonate, the main component of limestone buildings, and expose them to varying volumes of acid rain to determine what volume of acid rain is necessary to begin to erode a building. A sample graph of one scientist’s experiment is replicated below:

Measuring acid and base levels is commonly done with a scale called pH, which uses the concentration of hydrogen ions to determine the acidity. Hydrogen ions are in a balance with hydroxide ions to give a scale with a range from 0 to 14. Values equal to or between 0 and 6.9 represent the acidic range where hydrogen ions predominate and values equal to or ranging from 7.1 and 14 represent the basic range where hydroxide ions predominate. Thus, the more hydrogen ions present, the more acidic the solution.
Scientists can tell when a titration (pH) experiment passes a certain pH using compounds called indicators. Indicators are usually colorless at pH levels below that of their specified color change. A table of indicators used by the above scientists and the pH at which they change colors is presented below.

Q. The relationship between pH and volume of acid added can best be described as which of the following?
a)
Indirectly Proportional
b)
Directly Proportional
c)
Inversely Proportional
d)
Sigmoidal (S-shaped)
|
|
Ayesha Joshi answered |
In general, the ACT asks students to identify four different types of graphs - directly proportional, inversely proportional, indirectly proportional, and sigmoidal. As the name implies sigmoidal graphs have an "S" shape. Directly proportional graphs are presented as a positive-slope straight line, while the opposite is true for inversely proportional. Indirectly proportional graphs do not present the relationship between two variables as a straight line. Instead the line may be exponential or logarithmic.
Current high levels of fossil fuel use, including coal-burning power plants and gasoline-powered automobiles, have helped contribute to the high concentrations of sulfur trioxide, SO3, found in the atmosphere. When sulfur trioxide and water interact, they can undergo the following chemical reaction to produce sulfuric acid, which is the main contributor to acid rain worldwide: SO3 + H2O ⇌ H2SO4 Acid rain showers are particularly common near coal-burning power plants and large cities. These showers are responsible for significant economic damage to sidewalks, roads, and buildings. Scientists interested in studying the effects of acid rain often use basic substances like calcium carbonate, the main component of limestone buildings, and expose them to varying volumes of acid rain to determine what volume of acid rain is necessary to begin to erode a building. A sample graph of one scientist’s experiment is replicated below: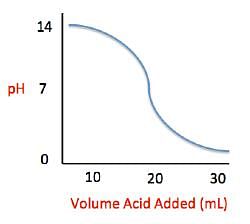 Measuring acid and base levels is commonly done with a scale called pH, which uses the concentration of hydrogen ions to determine the acidity. Hydrogen ions are in a balance with hydroxide ions to give a scale with a range from 0 to 14. Values equal to or between 0 and 6.9 represent the acidic range where hydrogen ions predominate and values equal to or ranging from 7.1 and 14 represent the basic range where hydroxide ions predominate. Thus, the more hydrogen ions present, the more acidic the solution.Scientists can tell when a titration (pH) experiment passes a certain pH using compounds called indicators. Indicators are usually colorless at pH levels below that of their specified color change. A table of indicators used by the above scientists and the pH at which they change colors is presented below.
  Q. What is the pH of a solution containing calcium carbonate and sulfuric acid when 20 mL of sulfuric acid have been added?
- a)7
- b)10
- c)2
- d)12
Correct answer is option 'A'. Can you explain this answer?
Current high levels of fossil fuel use, including coal-burning power plants and gasoline-powered automobiles, have helped contribute to the high concentrations of sulfur trioxide, SO3, found in the atmosphere. When sulfur trioxide and water interact, they can undergo the following chemical reaction to produce sulfuric acid, which is the main contributor to acid rain worldwide:
SO3 + H2O ⇌ H2SO4
Acid rain showers are particularly common near coal-burning power plants and large cities. These showers are responsible for significant economic damage to sidewalks, roads, and buildings. Scientists interested in studying the effects of acid rain often use basic substances like calcium carbonate, the main component of limestone buildings, and expose them to varying volumes of acid rain to determine what volume of acid rain is necessary to begin to erode a building. A sample graph of one scientist’s experiment is replicated below:

Measuring acid and base levels is commonly done with a scale called pH, which uses the concentration of hydrogen ions to determine the acidity. Hydrogen ions are in a balance with hydroxide ions to give a scale with a range from 0 to 14. Values equal to or between 0 and 6.9 represent the acidic range where hydrogen ions predominate and values equal to or ranging from 7.1 and 14 represent the basic range where hydroxide ions predominate. Thus, the more hydrogen ions present, the more acidic the solution.
Scientists can tell when a titration (pH) experiment passes a certain pH using compounds called indicators. Indicators are usually colorless at pH levels below that of their specified color change. A table of indicators used by the above scientists and the pH at which they change colors is presented below.

Q. What is the pH of a solution containing calcium carbonate and sulfuric acid when 20 mL of sulfuric acid have been added?
a)
7
b)
10
c)
2
d)
12
|
|
Ayesha Joshi answered |
This question asks us to use the provided figure to determine the average pH of a solution in the titration explained in the passage. We can see that when 20 mL of sulfuric acid have been added to the calcium carbonate solution, the resulting pH falls in the middle of the sigmoidal curve at a pH of around 7. These problems are important to understand because the ACT tends to test the interpretation of figures and charts heavily.
Sound waves travel through a medium by mechanically disturbing the particles of that medium. As particles in the medium are displaced by the sound wave, they in turn act upon neighboring particles. In this fashion, the wave travels through the medium through a parallel series of disturbed particles. Like in other forms of motion, the rate at which the sound wave travels can be measured by dividing the distance over which the wave travels by the time required for it to do so. Study 1
A group of students hypothesizes that the velocity of sound is dependent upon the density of the medium through which it passes. They propose that with more matter in a given space, each particle needs to travel a shorter distance to disturb the adjacent particles. Using two microphones and a high speed recording device, the students measured the delay from the first microphone to the second. They chose a variety of media, shown in Table 1, and measured the velocity of sound through each using their two-microphone setup. The results are found in Table 1.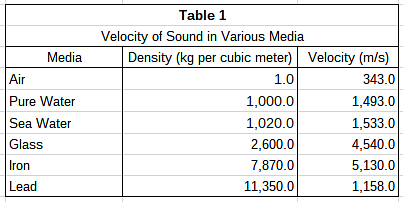 Study 2
The students wanted to test their hypothesis by using the same medium at different densities. To do this, they heated pure water to various temperatures and repeated the procedure described in Study 1. Their results can be found in Table 2.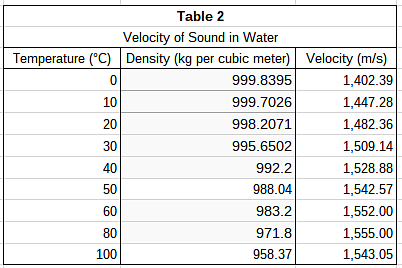 In Study 1, which medium tested had the greatest density?
- a)Iron
- b)Lead
- c)Sea Water
- d)Glass
Correct answer is option 'B'. Can you explain this answer?
Sound waves travel through a medium by mechanically disturbing the particles of that medium. As particles in the medium are displaced by the sound wave, they in turn act upon neighboring particles. In this fashion, the wave travels through the medium through a parallel series of disturbed particles. Like in other forms of motion, the rate at which the sound wave travels can be measured by dividing the distance over which the wave travels by the time required for it to do so.
Study 1
A group of students hypothesizes that the velocity of sound is dependent upon the density of the medium through which it passes. They propose that with more matter in a given space, each particle needs to travel a shorter distance to disturb the adjacent particles. Using two microphones and a high speed recording device, the students measured the delay from the first microphone to the second. They chose a variety of media, shown in Table 1, and measured the velocity of sound through each using their two-microphone setup. The results are found in Table 1.
A group of students hypothesizes that the velocity of sound is dependent upon the density of the medium through which it passes. They propose that with more matter in a given space, each particle needs to travel a shorter distance to disturb the adjacent particles. Using two microphones and a high speed recording device, the students measured the delay from the first microphone to the second. They chose a variety of media, shown in Table 1, and measured the velocity of sound through each using their two-microphone setup. The results are found in Table 1.

Study 2
The students wanted to test their hypothesis by using the same medium at different densities. To do this, they heated pure water to various temperatures and repeated the procedure described in Study 1. Their results can be found in Table 2.
The students wanted to test their hypothesis by using the same medium at different densities. To do this, they heated pure water to various temperatures and repeated the procedure described in Study 1. Their results can be found in Table 2.

In Study 1, which medium tested had the greatest density?
a)
Iron
b)
Lead
c)
Sea Water
d)
Glass
|
|
Ayesha Joshi answered |
The densities for the media in Study 1 can be found in Table 1. In the second column of Table 1, the densities are listed in ascending order. Lead has the highest number in that column and therefore has the greatest density.
Sound waves travel through a medium by mechanically disturbing the particles of that medium. As particles in the medium are displaced by the sound wave, they in turn act upon neighboring particles. In this fashion, the wave travels through the medium through a parallel series of disturbed particles. Like in other forms of motion, the rate at which the sound wave travels can be measured by dividing the distance over which the wave travels by the time required for it to do so. Study 1
A group of students hypothesizes that the velocity of sound is dependent upon the density of the medium through which it passes. They propose that with more matter in a given space, each particle needs to travel a shorter distance to disturb the adjacent particles. Using two microphones and a high speed recording device, the students measured the delay from the first microphone to the second. They chose a variety of media, shown in Table 1, and measured the velocity of sound through each using their two-microphone setup. The results are found in Table 1. Study 2
The students wanted to test their hypothesis by using the same medium at different densities. To do this, they heated pure water to various temperatures and repeated the procedure described in Study 1. Their results can be found in Table 2. According to Study 2, over what temperature interval does velocity begin to decrease as water temperature rises?
- a)50∘C to 60∘C
- b)60∘C to 80°C
- c)0∘C to 10∘C
- d)80°C to 100∘C
Correct answer is option 'D'. Can you explain this answer?
Sound waves travel through a medium by mechanically disturbing the particles of that medium. As particles in the medium are displaced by the sound wave, they in turn act upon neighboring particles. In this fashion, the wave travels through the medium through a parallel series of disturbed particles. Like in other forms of motion, the rate at which the sound wave travels can be measured by dividing the distance over which the wave travels by the time required for it to do so.
Study 1
A group of students hypothesizes that the velocity of sound is dependent upon the density of the medium through which it passes. They propose that with more matter in a given space, each particle needs to travel a shorter distance to disturb the adjacent particles. Using two microphones and a high speed recording device, the students measured the delay from the first microphone to the second. They chose a variety of media, shown in Table 1, and measured the velocity of sound through each using their two-microphone setup. The results are found in Table 1.
A group of students hypothesizes that the velocity of sound is dependent upon the density of the medium through which it passes. They propose that with more matter in a given space, each particle needs to travel a shorter distance to disturb the adjacent particles. Using two microphones and a high speed recording device, the students measured the delay from the first microphone to the second. They chose a variety of media, shown in Table 1, and measured the velocity of sound through each using their two-microphone setup. The results are found in Table 1.

Study 2
The students wanted to test their hypothesis by using the same medium at different densities. To do this, they heated pure water to various temperatures and repeated the procedure described in Study 1. Their results can be found in Table 2.
The students wanted to test their hypothesis by using the same medium at different densities. To do this, they heated pure water to various temperatures and repeated the procedure described in Study 1. Their results can be found in Table 2.

According to Study 2, over what temperature interval does velocity begin to decrease as water temperature rises?
a)
50∘C to 60∘C
b)
60∘C to 80°C
c)
0∘C to 10∘C
d)
80°C to 100∘C
|
|
Ayesha Joshi answered |
Table 2 lists velocity of sound in its third column. As you move down the column, each value corresponds to increasing temperatures. The velocity values increase over each interval until they drop from 1,555 m/s to 1543.05 m/s. This decrease in velocity occurs between 80°C and 100°C according to the corresponding values in the first column of the table.
The graph below depicts the position of three different cars over a 15-second time interval.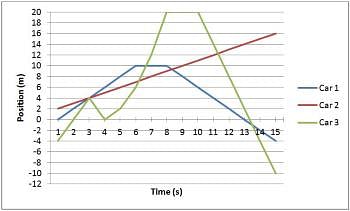 At the point where all three cars meet, which car is traveling the fastest?
- a)They are all traveling at the same speed.
- b)Car 2
- c)Car 3
- d)Cannot be determined.
Correct answer is option 'C'. Can you explain this answer?
The graph below depicts the position of three different cars over a 15-second time interval.

At the point where all three cars meet, which car is traveling the fastest?
a)
They are all traveling at the same speed.
b)
Car 2
c)
Car 3
d)
Cannot be determined.
|
|
Ayesha Joshi answered |
The three cars intersect at time = 3s. At this point, one can determine the speed (or velocity) of each car by looking how many meters the car travels per second. At time = 3, car 1 is traveling 1 m per second, car 2 is traveling 2 m per second, and car 3 is traveling 4 m per second. Another way of determining which car is the fastest is by looking at the slopes of each line. The car with the greatest slope is traveling the quickest.
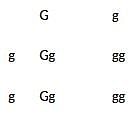 Scientist’s believe they have found the gene accountable for intelligence. The allele “G” is dominant, and the allele “g” is recessive. The intelligence gene is optimally expressed in the homozygous recessive form. The chart above shows the trait in the heterozygous form and the homozygous form. The form “gg” is from the mother, and “Gg” is from the father. The parents want to know what the gene might look like in their child.Q. What form of the gene expresses optimal intelligence?
- a)gG
- b)GG
- c)Gg
- d)gg
- e)none of the above
Correct answer is option 'D'. Can you explain this answer?

Scientist’s believe they have found the gene accountable for intelligence. The allele “G” is dominant, and the allele “g” is recessive. The intelligence gene is optimally expressed in the homozygous recessive form. The chart above shows the trait in the heterozygous form and the homozygous form. The form “gg” is from the mother, and “Gg” is from the father. The parents want to know what the gene might look like in their child.
Q. What form of the gene expresses optimal intelligence?
a)
gG
b)
GG
c)
Gg
d)
gg
e)
none of the above
|
|
Ayesha Joshi answered |
The prompt states the intelligence gene is "optimally expressed in the homozygous recessive form." Therefore, this is the "gg" form.
In a specific region, a scientist recorded the rainfall, in inches, during the months of May, June, July and August. The scientist recorded this data in the same spot each month over four years. The purpose of this study was to see how the new factories built in the area impacted the rainfall in that location.  What trend can be noticed in the data?
- a)As the year increases so does the rainfall for that year; August has the most rain of any month per a year
- b)As the year increases, the rainfall for that year decreases; July has the most rain of any month per year
- c)As the year increases so does the rainfall for that year; July has the most rain of a month per year
- d)As the year increases, the rainfall for that year decreases; August has the most rain of any month per year
Correct answer is option 'C'. Can you explain this answer?
In a specific region, a scientist recorded the rainfall, in inches, during the months of May, June, July and August. The scientist recorded this data in the same spot each month over four years. The purpose of this study was to see how the new factories built in the area impacted the rainfall in that location.

What trend can be noticed in the data?
a)
As the year increases so does the rainfall for that year; August has the most rain of any month per a year
b)
As the year increases, the rainfall for that year decreases; July has the most rain of any month per year
c)
As the year increases so does the rainfall for that year; July has the most rain of a month per year
d)
As the year increases, the rainfall for that year decreases; August has the most rain of any month per year

|
Orion Classes answered |
Looking at the month with the most rainfall, one will notice in year 1 that July has the most rainfall with 3.8", in year 2 it is also July with 4.1" and so on. Therefore in any year of the given data the month with the most rain is always July. In year 1 the total rainfall for the months was 11.8", in year 2 it was 13.8", in year 3 it was 15.4" and in year 4 it was 18.5" indicating that the rainfall increases each year.
A new drug is in its clinical trial phase. The graph below shows the data for participants sleep patterns before medication use and then after using the medication for three months. Series 1 shows the average hours slept a night for each participant prior to medication. Series 2 shows the average hours slept a night for each participant after three months of use. The average hours slept a night was obtained by recording sleep every night for one month, and then finding the average. Patients one through five took a placebo pil, not the actual Moonlight medication. Note: The y-axis is measured in hours slept a night, while the x-axis lists each anonymous patient numerically. 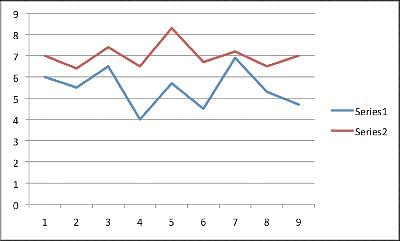 Q. What information would strengthen the experiment?
 - a)Patient 4 and patient 5 both had family deaths occur during the first month of testing.
- b)Another experiment using the medication that shows only female patients saw an increase in hours slept a night.
- c)Data comparing the number of times a patient wakes up in the middle of the night prior to and after medication usage.
- d)Statistical data results showing those on the placebo had the same increase in hours slept a night as those taking the medication.
- e)All of the answers listed would strengthen the experiment.
Correct answer is option 'C'. Can you explain this answer?
A new drug is in its clinical trial phase. The graph below shows the data for participants sleep patterns before medication use and then after using the medication for three months. Series 1 shows the average hours slept a night for each participant prior to medication. Series 2 shows the average hours slept a night for each participant after three months of use. The average hours slept a night was obtained by recording sleep every night for one month, and then finding the average. Patients one through five took a placebo pil, not the actual Moonlight medication. Note: The y-axis is measured in hours slept a night, while the x-axis lists each anonymous patient numerically.

Q. What information would strengthen the experiment?
a)
Patient 4 and patient 5 both had family deaths occur during the first month of testing.
b)
Another experiment using the medication that shows only female patients saw an increase in hours slept a night.
c)
Data comparing the number of times a patient wakes up in the middle of the night prior to and after medication usage.
d)
Statistical data results showing those on the placebo had the same increase in hours slept a night as those taking the medication.
e)
All of the answers listed would strengthen the experiment.
|
|
Ayesha Joshi answered |
This experiment takes into account the total average hours slept each night. While the medication seems to improve the total hours slept, it leaves out how consecutive the hours. An individual who sleeps a total of seven hours a night but wakes up five times a night will not show an improvement based on the way the results are measured.
 The table above shows measurements for tumor size growth over time within three different possible treatment methods. Each tumor was first documented at an initial size of 2 inches. Every month each tumor was measured, for a total of five measurements of each tumor. Q. What information would be most important to know before drawing conclusions based on this data?
 - a)all of the information is important
- b)patient history
- c)the stage, location, and growth rate of the cancer using each treatment
- d)the gender of each patient
- e)none of the information is important
Correct answer is option 'C'. Can you explain this answer?

The table above shows measurements for tumor size growth over time within three different possible treatment methods. Each tumor was first documented at an initial size of 2 inches. Every month each tumor was measured, for a total of five measurements of each tumor.
Q. What information would be most important to know before drawing conclusions based on this data?
a)
all of the information is important
b)
patient history
c)
the stage, location, and growth rate of the cancer using each treatment
d)
the gender of each patient
e)
none of the information is important
|
|
Ayesha Joshi answered |
The key is here the phrase most important. The location and stage of the cancer would play the biggest role in terms of treatment results. All of the other information would be helpful, but the question asks to prioritize which is the most important.
 The table above shows measurements for tumor size growth over time within three different possible treatment methods. Each tumor was first documented at an initial size of 2 inches. Every month each tumor was measured, for a total of five measurements of each tumor. Q. Looking at the "Surgery and Chemotherapy" treatment column, where could one infer that chemotherapy was performed?
 - a)2 inches to 0.05 inches
- b)0.05 to 0.09 inches
- c)0.05 to 0.03 inches
- d)0.09 inches to 0.05 inches
- e)Nothing can be inferred.
Correct answer is option 'D'. Can you explain this answer?

The table above shows measurements for tumor size growth over time within three different possible treatment methods. Each tumor was first documented at an initial size of 2 inches. Every month each tumor was measured, for a total of five measurements of each tumor.
Q. Looking at the "Surgery and Chemotherapy" treatment column, where could one infer that chemotherapy was performed?
a)
2 inches to 0.05 inches
b)
0.05 to 0.09 inches
c)
0.05 to 0.03 inches
d)
0.09 inches to 0.05 inches
e)
Nothing can be inferred.
|
|
Ayesha Joshi answered |
ne would think that surgery as opposed to chemotherapy resulted in a drastic reduction of tumor size; therefore, the smaller reduction of size can be attributed to chemotherapy (0.09 to 0.05).
 The table above shows measurements for tumor size growth over time within three different possible treatment methods. Each tumor was first documented at an initial size of 2 inches. Every month each tumor was measured, for a total of five measurements of each tumor. Q. Based on the chart above, what conclusion could be drawn about the "no treatment" option?
 - a)The best option is to always treat cancer, whether it be surgery or chemotherapy.
- b)Nothing can be concluded.
- c)Tumor size increases upon no treatment.
- d)When no treatment is done, cancer tends to grow at a steady exponential rate.
- e)Surgery and Chemotherapy together is the best treatment option.
Correct answer is option 'C'. Can you explain this answer?

The table above shows measurements for tumor size growth over time within three different possible treatment methods. Each tumor was first documented at an initial size of 2 inches. Every month each tumor was measured, for a total of five measurements of each tumor.
Q. Based on the chart above, what conclusion could be drawn about the "no treatment" option?
a)
The best option is to always treat cancer, whether it be surgery or chemotherapy.
b)
Nothing can be concluded.
c)
Tumor size increases upon no treatment.
d)
When no treatment is done, cancer tends to grow at a steady exponential rate.
e)
Surgery and Chemotherapy together is the best treatment option.
|
|
Ayesha Joshi answered |
Based on the data, the only conclusion that can be drawn is the tumor size increases. One might be tempted to draw the conclusion out further and say that some treatment is always better than no treatment; however, that is a circumstantial conclusion based on the individual patient cases, and cannot be concluded from the data shown.
Researchers have discovered a new planet, Planet Z. This planet is orbited by several comets, A, B, C and D. Researchers have calculated the time it takes each comet to orbit Planet Z, the closest the comet gets to Planet Z and the diameter of the comet. What is the relationship between comet diameter and orbit time?
 - a)There is no relationship between diameter and orbit time
- b)The larger the diameter, the shorter the orbit time
- c)The smaller the diameter, the longer the orbit time
- d)The larger the comet's diameter, the longer the orbit time
Correct answer is option 'D'. Can you explain this answer?
Researchers have discovered a new planet, Planet Z. This planet is orbited by several comets, A, B, C and D. Researchers have calculated the time it takes each comet to orbit Planet Z, the closest the comet gets to Planet Z and the diameter of the comet.

What is the relationship between comet diameter and orbit time?
a)
There is no relationship between diameter and orbit time
b)
The larger the diameter, the shorter the orbit time
c)
The smaller the diameter, the longer the orbit time
d)
The larger the comet's diameter, the longer the orbit time

|
Orion Classes answered |
Comet A has the largest diameter at 11.3km and the longest orbit time at 82.3 years. This suggests a direct relationship. Comet B has the shortest diameter of 5.2km and the shortest orbit time at 47.8 years. This also suggests a direct relationship and this trend can be seen in the other two comets. The correct answer is the larger the diameter, the longer the orbit time.
In a specific region, a scientist recorded the rainfall, in inches, during the months of May, June, July and August. The scientist recorded this data in the same spot each month over four years. The purpose of this study was to see how the new factories built in the area impacted the rainfall in that location.  How have the factories impacted the rainfall that was recorded each year?
- a)Each year rainfall has increased
- b)Rainfall increased from Year 1 to Year 2, but decreased afterwards
- c)Cannot be determined from the given information
- d)Each year rainfall has decrease
Correct answer is option 'C'. Can you explain this answer?
In a specific region, a scientist recorded the rainfall, in inches, during the months of May, June, July and August. The scientist recorded this data in the same spot each month over four years. The purpose of this study was to see how the new factories built in the area impacted the rainfall in that location.

How have the factories impacted the rainfall that was recorded each year?
a)
Each year rainfall has increased
b)
Rainfall increased from Year 1 to Year 2, but decreased afterwards
c)
Cannot be determined from the given information
d)
Each year rainfall has decrease

|
Orion Classes answered |
It is true that the rainfall recorded increases each year. However there is nothing that indicates what is causing this increase. Furthermore it is not noted when the factories were built so it is not possible to determine how the factories affected the rainfall. The answer cannot be determined from the given information.
A new drug is in its clinical trial phase. The graph below shows the data for participants sleep patterns before medication use and then after using the medication for three months. Series 1 shows the average hours slept a night for each participant prior to medication. Series 2 shows the average hours slept a night for each participant after three months of use. The average hours slept a night was obtained by recording sleep every night for one month, and then finding the average. Patients one through five took a placebo pil, not the actual Moonlight medication. Note: The y-axis is measured in hours slept a night, while the x-axis lists each anonymous patient numerically. 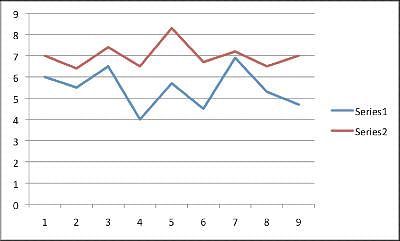 Q. The overall trend when comparing sleep before and after mediciation use is __________.
 - a)There was not a difference in the average hours slept a night by a patient before the medication use and after the medication use.
- b)Patients who slept the most prior to the medication saw the least increase in hours slept when on the medication.
- c)Patients who slept the most prior to the medication saw the greatest increase in hours slept when on the medication.
- d)Patients who slept the least prior to the medication saw the greatest increase in hours slept when on the medication.
- e)All patients experienced an increase in hours slept when on the medication, except those taking the placebo.
Correct answer is option 'D'. Can you explain this answer?
A new drug is in its clinical trial phase. The graph below shows the data for participants sleep patterns before medication use and then after using the medication for three months. Series 1 shows the average hours slept a night for each participant prior to medication. Series 2 shows the average hours slept a night for each participant after three months of use. The average hours slept a night was obtained by recording sleep every night for one month, and then finding the average. Patients one through five took a placebo pil, not the actual Moonlight medication. Note: The y-axis is measured in hours slept a night, while the x-axis lists each anonymous patient numerically.

Q. The overall trend when comparing sleep before and after mediciation use is __________.
a)
There was not a difference in the average hours slept a night by a patient before the medication use and after the medication use.
b)
Patients who slept the most prior to the medication saw the least increase in hours slept when on the medication.
c)
Patients who slept the most prior to the medication saw the greatest increase in hours slept when on the medication.
d)
Patients who slept the least prior to the medication saw the greatest increase in hours slept when on the medication.
e)
All patients experienced an increase in hours slept when on the medication, except those taking the placebo.
|
|
Ayesha Joshi answered |
Looking at the graph, one will see the patients who slept the least before medication usage (patients 4, 6, and 9), had the largest increase in hours slept. Further, patient 7 and patient 3 had the greatest amount of hours slept prior to medication usage. These two patients had the smallest increase in average sleeping hours.
Current high levels of fossil fuel use, including coal-burning power plants and gasoline-powered automobiles, have helped contribute to the high concentrations of sulfur trioxide, SO3, found in the atmosphere. When sulfur trioxide and water interact, they can undergo the following chemical reaction to produce sulfuric acid, which is the main contributor to acid rain worldwide: SO3 + H2O ⇌ H2SO4 Acid rain showers are particularly common near coal-burning power plants and large cities. These showers are responsible for significant economic damage to sidewalks, roads, and buildings. Scientists interested in studying the effects of acid rain often use basic substances like calcium carbonate, the main component of limestone buildings, and expose them to varying volumes of acid rain to determine what volume of acid rain is necessary to begin to erode a building. A sample graph of one scientist’s experiment is replicated below: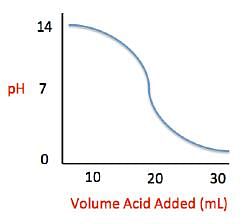 Measuring acid and base levels is commonly done with a scale called pH, which uses the concentration of hydrogen ions to determine the acidity. Hydrogen ions are in a balance with hydroxide ions to give a scale with a range from 0 to 14. Values equal to or between 0 and 6.9 represent the acidic range where hydrogen ions predominate and values equal to or ranging from 7.1 and 14 represent the basic range where hydroxide ions predominate. Thus, the more hydrogen ions present, the more acidic the solution.Scientists can tell when a titration (pH) experiment passes a certain pH using compounds called indicators. Indicators are usually colorless at pH levels below that of their specified color change. A table of indicators used by the above scientists and the pH at which they change colors is presented below.
  Q. What is the pH of a solution containing calcium carbonate and sulfuric acid when 29 mL of sulfuric acid have been added?
 - a)0
- b)3
- c)7
- d)12
Correct answer is option 'A'. Can you explain this answer?
Current high levels of fossil fuel use, including coal-burning power plants and gasoline-powered automobiles, have helped contribute to the high concentrations of sulfur trioxide, SO3, found in the atmosphere. When sulfur trioxide and water interact, they can undergo the following chemical reaction to produce sulfuric acid, which is the main contributor to acid rain worldwide:
SO3 + H2O ⇌ H2SO4
Acid rain showers are particularly common near coal-burning power plants and large cities. These showers are responsible for significant economic damage to sidewalks, roads, and buildings. Scientists interested in studying the effects of acid rain often use basic substances like calcium carbonate, the main component of limestone buildings, and expose them to varying volumes of acid rain to determine what volume of acid rain is necessary to begin to erode a building. A sample graph of one scientist’s experiment is replicated below:

Measuring acid and base levels is commonly done with a scale called pH, which uses the concentration of hydrogen ions to determine the acidity. Hydrogen ions are in a balance with hydroxide ions to give a scale with a range from 0 to 14. Values equal to or between 0 and 6.9 represent the acidic range where hydrogen ions predominate and values equal to or ranging from 7.1 and 14 represent the basic range where hydroxide ions predominate. Thus, the more hydrogen ions present, the more acidic the solution.
Scientists can tell when a titration (pH) experiment passes a certain pH using compounds called indicators. Indicators are usually colorless at pH levels below that of their specified color change. A table of indicators used by the above scientists and the pH at which they change colors is presented below.

Q. What is the pH of a solution containing calcium carbonate and sulfuric acid when 29 mL of sulfuric acid have been added?
a)
0
b)
3
c)
7
d)
12
|
|
Ayesha Joshi answered |
In this question, we are asked to determine the relationship between pH and volume of sulfuric acid added to the basic solution. This is best done by using the graph provided in the passage. We can see that, as we add more sulfuric acid, the pH of the solution decreases. Around an addition of 30 mL, we can see that the pH of the solution is beginning to approach 0. Given the range of answer choices provided, we can estimate that addition of 29 mL would give a pH of around 0.
Sound waves travel through a medium by mechanically disturbing the particles of that medium. As particles in the medium are displaced by the sound wave, they in turn act upon neighboring particles. In this fashion, the wave travels through the medium through a parallel series of disturbed particles. Like in other forms of motion, the rate at which the sound wave travels can be measured by dividing the distance over which the wave travels by the time required for it to do so. Study 1
A group of students hypothesizes that the velocity of sound is dependent upon the density of the medium through which it passes. They propose that with more matter in a given space, each particle needs to travel a shorter distance to disturb the adjacent particles. Using two microphones and a high speed recording device, the students measured the delay from the first microphone to the second. They chose a variety of media, shown in Table 1, and measured the velocity of sound through each using their two-microphone setup. The results are found in Table 1. Study 2
The students wanted to test their hypothesis by using the same medium at different densities. To do this, they heated pure water to various temperatures and repeated the procedure described in Study 1. Their results can be found in Table 2. According to Study 2, water at which of the following temperatures yields the greatest velocity of sound?
- a)60∘C
- b)100∘C
- c)0∘C`
- d)80∘C
Correct answer is option 'D'. Can you explain this answer?
Sound waves travel through a medium by mechanically disturbing the particles of that medium. As particles in the medium are displaced by the sound wave, they in turn act upon neighboring particles. In this fashion, the wave travels through the medium through a parallel series of disturbed particles. Like in other forms of motion, the rate at which the sound wave travels can be measured by dividing the distance over which the wave travels by the time required for it to do so.
Study 1
A group of students hypothesizes that the velocity of sound is dependent upon the density of the medium through which it passes. They propose that with more matter in a given space, each particle needs to travel a shorter distance to disturb the adjacent particles. Using two microphones and a high speed recording device, the students measured the delay from the first microphone to the second. They chose a variety of media, shown in Table 1, and measured the velocity of sound through each using their two-microphone setup. The results are found in Table 1.
A group of students hypothesizes that the velocity of sound is dependent upon the density of the medium through which it passes. They propose that with more matter in a given space, each particle needs to travel a shorter distance to disturb the adjacent particles. Using two microphones and a high speed recording device, the students measured the delay from the first microphone to the second. They chose a variety of media, shown in Table 1, and measured the velocity of sound through each using their two-microphone setup. The results are found in Table 1.

Study 2
The students wanted to test their hypothesis by using the same medium at different densities. To do this, they heated pure water to various temperatures and repeated the procedure described in Study 1. Their results can be found in Table 2.
The students wanted to test their hypothesis by using the same medium at different densities. To do this, they heated pure water to various temperatures and repeated the procedure described in Study 1. Their results can be found in Table 2.

According to Study 2, water at which of the following temperatures yields the greatest velocity of sound?
a)
60∘C
b)
100∘C
c)
0∘C`
d)
80∘C
|
|
Ayesha Joshi answered |
Velocities of sound in water can be found in the third column of Table 2. The highest velocity listed in the table is 1,555 m/s. Temperatures are listed in the first column; this sound velocity occurs in water that is 80°C.
Scientists have recorded data in Region A, Region B, Region C and Region D. The data collected include the average daily temperature, the annual rainfall for the past year and the number of fresh water reservoirs. The scientists want to perform an experiment on wild life migration patterns.  What is the relationship between average annual temperature and the number of fresh water reservoirs?
 - a)As the temperature increases, the number of water reservoirs increases
- b)As the temperature increases, the number of water reservoirs decreases
- c)There is no relationship
- d)As the temperature decreases, the number of water reservoirs increases
Correct answer is option 'C'. Can you explain this answer?
Scientists have recorded data in Region A, Region B, Region C and Region D. The data collected include the average daily temperature, the annual rainfall for the past year and the number of fresh water reservoirs. The scientists want to perform an experiment on wild life migration patterns.

What is the relationship between average annual temperature and the number of fresh water reservoirs?
a)
As the temperature increases, the number of water reservoirs increases
b)
As the temperature increases, the number of water reservoirs decreases
c)
There is no relationship
d)
As the temperature decreases, the number of water reservoirs increases

|
Orion Classes answered |
Region A has the highest average temperature at 102.4 Fahrenheit, while Region C has the lowest average temperature at 0.4 Fahrenheit. Both of these regions have zero fresh water reservoirs. Since Region A has the highest temperature with zero reservoirs and Region C has the lowest temperature with zero reservoirs there is no clear relationship between the temperature and number of fresh water reservoirs in given data.
Researchers have discovered a new planet, Planet Z. This planet is orbited by several comets, A, B, C and D. Researchers have calculated the time it takes each comet to orbit Planet Z, the closest the comet gets to Planet Z and the diameter of the comet. Another comet that orbits Planet Z was found and the comet has a diameter of 4.6km. Which of the following would be the best estimate of orbit time around Planet Z in Earth years?
- a)91.3
- b)80.2
- c)41.3
- d)64.7
Correct answer is option 'C'. Can you explain this answer?
Researchers have discovered a new planet, Planet Z. This planet is orbited by several comets, A, B, C and D. Researchers have calculated the time it takes each comet to orbit Planet Z, the closest the comet gets to Planet Z and the diameter of the comet.

Another comet that orbits Planet Z was found and the comet has a diameter of 4.6km. Which of the following would be the best estimate of orbit time around Planet Z in Earth years?
a)
91.3
b)
80.2
c)
41.3
d)
64.7

|
Orion Classes answered |
It can be seen in the data that the smaller the diameter, the shorter the orbit time of each comet. The smallest comet previously observed was Comet B that had a diameter of 5.2km and an orbit time of 47.8 years. Since the new found comet has a smaller diameter than Comet B, it should be estimated that the new comet has a shorter orbit time than Comet B. In other words, the new comet's orbit time should be less than 47.8 years. The correct answer is 41.3 years.
The chart below depicts the average rainfall by location on the Earth. Zero degrees latitude corresponds to the equator. Positive latitudes are north of the equator, while negative latitudes are south of the equator. A latitude with a magnitude of 90 degrees correlates with one of Earth's poles.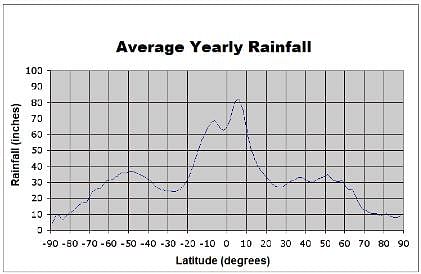 Which best describes the rainfall trend between thirty and sixty degrees latitude?
- a)Rainfall decreases as latitude increases
- b)None of these
- c)Rainfall increases as latitude increases
- d)Rainfall is approximately equal for these latitudes
Correct answer is option 'D'. Can you explain this answer?
The chart below depicts the average rainfall by location on the Earth. Zero degrees latitude corresponds to the equator. Positive latitudes are north of the equator, while negative latitudes are south of the equator. A latitude with a magnitude of 90 degrees correlates with one of Earth's poles.

Which best describes the rainfall trend between thirty and sixty degrees latitude?
a)
Rainfall decreases as latitude increases
b)
None of these
c)
Rainfall increases as latitude increases
d)
Rainfall is approximately equal for these latitudes

|
Orion Classes answered |
Examining the curve of the graph between 20 and 60 degrees, we see that, even though there is slight variation, rainfall hovers around 30 inches. Therefore, we can conclude that these latitudes experiences equal approximate rainfall.
The graph below depicts the position of three different cars over a 15-second time interval.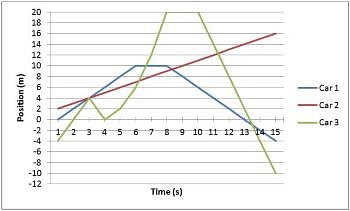 What is the speed of Car 1 at time = 7s?
- a)0 m/s
- b)2 m/s
- c)4 m/s
- d)1 m/s
Correct answer is option 'A'. Can you explain this answer?
The graph below depicts the position of three different cars over a 15-second time interval.

What is the speed of Car 1 at time = 7s?
a)
0 m/s
b)
2 m/s
c)
4 m/s
d)
1 m/s
|
|
Ayesha Joshi answered |
At time = 7 s, Car 1 holds the same position as it did at 6 and 8 seconds, indicating that the car is not moving. If the car is not moving, then it has a speed of 0/s. One helpful method of determining the speed of a car on this graph, or any similar problem you may encounter, is to look at the slope of the graph. A slope of 0 means the car is not moving. A positive or negative slope indicates the car is in fact moving.
Chemists can model how solids, liquids, and gases behave at different temperatures and pressures with a graph called a phase diagram. When the pressure and temperature are simultaneously known, a scientist can predict whether the material will be in a specific state. The diagram is divided into sections depending on the phase and the lines between sections represent phase transitions occurring between two or more separate phases.In general, solids of neatly stacked molecules exist when temperatures are low and pressures are intermediate. These values decrease the kinetic energy of the molecules enough to allow for attractive forces to begin the stacking process. Liquids, by contrast, are found at intermediate pressures and temperatures. The temperature is high enough to impart enough kinetic energy to prevent solid formation and the pressure is high enough to prevent the liquid from becoming a gas. Finally, a gas forms at low pressures and high temperatures. The high level of kinetic energy prevents molecules from associating with one another.Materials can undergo processes called phase transitions, meaning they can transition from one phase to another. The transition from a solid to a liquid is called melting, while the reverse transition is called freezing. Vaporization occurs when a liquid becomes a gas, while condensation occurs when a gas becomes a liquid. Finally, in a process called sublimation, a solid can directly become a gas without passing through a liquid phase. Additionally, when a gas directly becomes a solid, this is known as deposition. 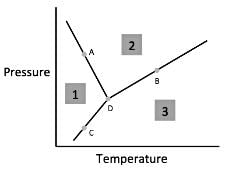 Q. According to the figure, the material represented by area three is in what phase?
- a)Gas
- b)Liquid
- c)Solid
- d)Cannot Be Determined
Correct answer is option 'A'. Can you explain this answer?
Chemists can model how solids, liquids, and gases behave at different temperatures and pressures with a graph called a phase diagram. When the pressure and temperature are simultaneously known, a scientist can predict whether the material will be in a specific state. The diagram is divided into sections depending on the phase and the lines between sections represent phase transitions occurring between two or more separate phases.
In general, solids of neatly stacked molecules exist when temperatures are low and pressures are intermediate. These values decrease the kinetic energy of the molecules enough to allow for attractive forces to begin the stacking process. Liquids, by contrast, are found at intermediate pressures and temperatures. The temperature is high enough to impart enough kinetic energy to prevent solid formation and the pressure is high enough to prevent the liquid from becoming a gas. Finally, a gas forms at low pressures and high temperatures. The high level of kinetic energy prevents molecules from associating with one another.
Materials can undergo processes called phase transitions, meaning they can transition from one phase to another. The transition from a solid to a liquid is called melting, while the reverse transition is called freezing. Vaporization occurs when a liquid becomes a gas, while condensation occurs when a gas becomes a liquid. Finally, in a process called sublimation, a solid can directly become a gas without passing through a liquid phase. Additionally, when a gas directly becomes a solid, this is known as deposition.

Q. According to the figure, the material represented by area three is in what phase?
a)
Gas
b)
Liquid
c)
Solid
d)
Cannot Be Determined
|
|
Ayesha Joshi answered |
According to paragraph two, gas exists at low pressures and high temperatures. Looking for area three on the figure, we see that this region corresponds to low pressures and high temperatures and thus must represent the gaseous state.
Current high levels of fossil fuel use, including coal-burning power plants and gasoline-powered automobiles, have helped contribute to the high concentrations of sulfur trioxide, SO3, found in the atmosphere. When sulfur trioxide and water interact, they can undergo the following chemical reaction to produce sulfuric acid, which is the main contributor to acid rain worldwide: SO3 + H2O ⇌ H2SO4 Acid rain showers are particularly common near coal-burning power plants and large cities. These showers are responsible for significant economic damage to sidewalks, roads, and buildings. Scientists interested in studying the effects of acid rain often use basic substances like calcium carbonate, the main component of limestone buildings, and expose them to varying volumes of acid rain to determine what volume of acid rain is necessary to begin to erode a building. A sample graph of one scientist’s experiment is replicated below: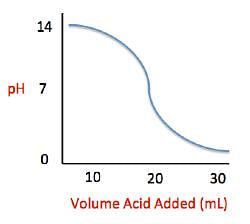 Measuring acid and base levels is commonly done with a scale called pH, which uses the concentration of hydrogen ions to determine the acidity. Hydrogen ions are in a balance with hydroxide ions to give a scale with a range from 0 to 14. Values equal to or between 0 and 6.9 represent the acidic range where hydrogen ions predominate and values equal to or ranging from 7.1 and 14 represent the basic range where hydroxide ions predominate. Thus, the more hydrogen ions present, the more acidic the solution.Scientists can tell when a titration (pH) experiment passes a certain pH using compounds called indicators. Indicators are usually colorless at pH levels below that of their specified color change. A table of indicators used by the above scientists and the pH at which they change colors is presented below.
  Q. Solutions A, B, and C each contain a different number of hydrogen ions. Solution A has a pH of 6.9, solution B has a pH of 7.3, and solution C has a pH of 1.3. Place the solutions in order of increasing number of hydrogen ions.
- a)A < B < C
- b)C < A < B
- c)B < A < C
- d)B < C < A
Correct answer is option 'C'. Can you explain this answer?
Current high levels of fossil fuel use, including coal-burning power plants and gasoline-powered automobiles, have helped contribute to the high concentrations of sulfur trioxide, SO3, found in the atmosphere. When sulfur trioxide and water interact, they can undergo the following chemical reaction to produce sulfuric acid, which is the main contributor to acid rain worldwide:
SO3 + H2O ⇌ H2SO4
Acid rain showers are particularly common near coal-burning power plants and large cities. These showers are responsible for significant economic damage to sidewalks, roads, and buildings. Scientists interested in studying the effects of acid rain often use basic substances like calcium carbonate, the main component of limestone buildings, and expose them to varying volumes of acid rain to determine what volume of acid rain is necessary to begin to erode a building. A sample graph of one scientist’s experiment is replicated below:

Measuring acid and base levels is commonly done with a scale called pH, which uses the concentration of hydrogen ions to determine the acidity. Hydrogen ions are in a balance with hydroxide ions to give a scale with a range from 0 to 14. Values equal to or between 0 and 6.9 represent the acidic range where hydrogen ions predominate and values equal to or ranging from 7.1 and 14 represent the basic range where hydroxide ions predominate. Thus, the more hydrogen ions present, the more acidic the solution.
Scientists can tell when a titration (pH) experiment passes a certain pH using compounds called indicators. Indicators are usually colorless at pH levels below that of their specified color change. A table of indicators used by the above scientists and the pH at which they change colors is presented below.

Q. Solutions A, B, and C each contain a different number of hydrogen ions. Solution A has a pH of 6.9, solution B has a pH of 7.3, and solution C has a pH of 1.3. Place the solutions in order of increasing number of hydrogen ions.
a)
A < B < C
b)
C < A < B
c)
B < A < C
d)
B < C < A
|
|
Ayesha Joshi answered |
The passage describes that pH indicates the relative number of hydrogen ions present in a solution. We know that more ions are present when the pH is the lowest. Thus, using the pH values provided in the question along with the information contained in the passage, we can place the solutions in decending order with respect to their pH, which is equivalent to listing them in increasing hydrogen number.
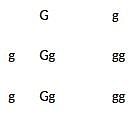 Scientist’s believe they have found the gene accountable for intelligence. The allele “G” is dominant, and the allele “g” is recessive. The intelligence gene is optimally expressed in the homozygous recessive form. The chart above shows the trait in the heterozygous form and the homozygous form. The form “gg” is from the mother, and “Gg” is from the father. The parents want to know what the gene might look like in their child.Q. According to the data given, what could one infer about the phenotype for "Gg?"
 - a)Individuals with the form "Gg" will be above the normal level of intelligence, but only partially.
- b)Individuals with the form "Gg" could exhibit two possible phenotypes. One phenotype is optimal intelligence; the other phenotype is average intelligence.
- c)One cannot infer any phenotypic information about the form "Gg."
- d)Individuals with the form "Gg" will exhibit below optimal intelligence.
- e)Individuals with the form "Gg" will not exhibt any intelligence above the average.
Correct answer is option 'C'. Can you explain this answer?

Scientist’s believe they have found the gene accountable for intelligence. The allele “G” is dominant, and the allele “g” is recessive. The intelligence gene is optimally expressed in the homozygous recessive form. The chart above shows the trait in the heterozygous form and the homozygous form. The form “gg” is from the mother, and “Gg” is from the father. The parents want to know what the gene might look like in their child.
Q. According to the data given, what could one infer about the phenotype for "Gg?"
a)
Individuals with the form "Gg" will be above the normal level of intelligence, but only partially.
b)
Individuals with the form "Gg" could exhibit two possible phenotypes. One phenotype is optimal intelligence; the other phenotype is average intelligence.
c)
One cannot infer any phenotypic information about the form "Gg."
d)
Individuals with the form "Gg" will exhibit below optimal intelligence.
e)
Individuals with the form "Gg" will not exhibt any intelligence above the average.
|
|
Ayesha Joshi answered |
The prompt does not tell what the phenotype of "Gg" is, it just mentions the phenotype for "gg" is optimal intelligence.
Sound waves travel through a medium by mechanically disturbing the particles of that medium. As particles in the medium are displaced by the sound wave, they in turn act upon neighboring particles. In this fashion, the wave travels through the medium through a parallel series of disturbed particles. Like in other forms of motion, the rate at which the sound wave travels can be measured by dividing the distance over which the wave travels by the time required for it to do so. Study 1
A group of students hypothesizes that the velocity of sound is dependent upon the density of the medium through which it passes. They propose that with more matter in a given space, each particle needs to travel a shorter distance to disturb the adjacent particles. Using two microphones and a high speed recording device, the students measured the delay from the first microphone to the second. They chose a variety of media, shown in Table 1, and measured the velocity of sound through each using their two-microphone setup. The results are found in Table 1. Study 2
The students wanted to test their hypothesis by using the same medium at different densities. To do this, they heated pure water to various temperatures and repeated the procedure described in Study 1. Their results can be found in Table 2. According to the data in Study 1, as density increases, what happens to the velocity of sound?
- a)It either increases or decreases.
- b)It does not change.
- c)It decreases.
- d)It increases.
Correct answer is option 'A'. Can you explain this answer?
Sound waves travel through a medium by mechanically disturbing the particles of that medium. As particles in the medium are displaced by the sound wave, they in turn act upon neighboring particles. In this fashion, the wave travels through the medium through a parallel series of disturbed particles. Like in other forms of motion, the rate at which the sound wave travels can be measured by dividing the distance over which the wave travels by the time required for it to do so.
Study 1
A group of students hypothesizes that the velocity of sound is dependent upon the density of the medium through which it passes. They propose that with more matter in a given space, each particle needs to travel a shorter distance to disturb the adjacent particles. Using two microphones and a high speed recording device, the students measured the delay from the first microphone to the second. They chose a variety of media, shown in Table 1, and measured the velocity of sound through each using their two-microphone setup. The results are found in Table 1.
A group of students hypothesizes that the velocity of sound is dependent upon the density of the medium through which it passes. They propose that with more matter in a given space, each particle needs to travel a shorter distance to disturb the adjacent particles. Using two microphones and a high speed recording device, the students measured the delay from the first microphone to the second. They chose a variety of media, shown in Table 1, and measured the velocity of sound through each using their two-microphone setup. The results are found in Table 1.

Study 2
The students wanted to test their hypothesis by using the same medium at different densities. To do this, they heated pure water to various temperatures and repeated the procedure described in Study 1. Their results can be found in Table 2.
The students wanted to test their hypothesis by using the same medium at different densities. To do this, they heated pure water to various temperatures and repeated the procedure described in Study 1. Their results can be found in Table 2.

According to the data in Study 1, as density increases, what happens to the velocity of sound?
a)
It either increases or decreases.
b)
It does not change.
c)
It decreases.
d)
It increases.
|
|
Ayesha Joshi answered |
The velocity of sound in different media is listed in the third column of Table 1. Density of the media increases as you move down the column. Velocity increases along with density except between iron and lead. This means that no direct relationship between density and velocity can be drawn; the velocity of sound can either increase or decrease as density increases.
 The table above shows measurements for tumor size growth over time within three different possible treatment methods. Each tumor was first documented at an initial size of 2 inches. Every month each tumor was measured, for a total of five measurements of each tumor. Q. Based on the table above, which single method is most effective at reducing tumor size in the shortest period of time?
- a)chemotherapy
- b)surgery and chemotherapy
- c)no treatment
- d)surgery
- e)cannot be answered
Correct answer is option 'D'. Can you explain this answer?

The table above shows measurements for tumor size growth over time within three different possible treatment methods. Each tumor was first documented at an initial size of 2 inches. Every month each tumor was measured, for a total of five measurements of each tumor.
Q. Based on the table above, which single method is most effective at reducing tumor size in the shortest period of time?
a)
chemotherapy
b)
surgery and chemotherapy
c)
no treatment
d)
surgery
e)
cannot be answered
|
|
Ayesha Joshi answered |
The tumor size decrease from surgery alone was 2 to 0.05 inches, the largest decrease on the chart. Don't be tricked into answering "Surgery and Chemotherapy" because the questions asks for which single method is most effective.
 The table above shows measurements for tumor size growth over time within three different possible treatment methods. Each tumor was first documented at an initial size of 2 inches. Every month each tumor was measured, for a total of five measurements of each tumor. Q. What conclusion CANNOT be reached based on the data shown above?
- a)None of these conclusions can be reached based on the data above.
- b)All three tumors started being observed when they were 2 inches in size.
- c)All of these conclusions can be reached based on the data above.
- d)All three tumors observed grew at the same rate.
- e)Each tumor was measured 5 times.
Correct answer is option 'D'. Can you explain this answer?

The table above shows measurements for tumor size growth over time within three different possible treatment methods. Each tumor was first documented at an initial size of 2 inches. Every month each tumor was measured, for a total of five measurements of each tumor.
Q. What conclusion CANNOT be reached based on the data shown above?
a)
None of these conclusions can be reached based on the data above.
b)
All three tumors started being observed when they were 2 inches in size.
c)
All of these conclusions can be reached based on the data above.
d)
All three tumors observed grew at the same rate.
e)
Each tumor was measured 5 times.
|
|
Ayesha Joshi answered |
There is not enough information in the data to know that the cancer cells in all three groups grew at the same rate. Cancer cells can grow at different rates depending on size, stage, and other factors.
The rate of a reversible chemical reaction depends on many factors, including concentrations of the reactants and products, temperature, and presence of enzymes called catalysts. In the forward reaction, two reactants combine to form one product. However, in a reverse reaction, the product is broken down into the two reactants.In order for a forward reaction to occur, the reactants moving around in the test tube must physically interact with each other. The more often reactants interact with each other, the more produce is formed in the same amount of time. The speed at which reactants combine into products (the rate of the reaction) can be calculated by dividing the amount of a chemical produced in a reaction (often measured in moles) by the time it takes to produce that amount.In order to determine the effects of reactant and product concentration, temperature, and presence of catalysts on the rate of a reaction, a scientist studied the following reaction: The scientist varied the conditions of the experiment and measured the rate of the reaction. The results are outlined in Table 1. The units of concentration are moles per liter.
 Q. If the moles of acid convertase were doubled, how would the rate of reaction change?
- a)Quadruple
- b)Double
- c)Triple
- d)Remain the Same
Correct answer is option 'B'. Can you explain this answer?
The rate of a reversible chemical reaction depends on many factors, including concentrations of the reactants and products, temperature, and presence of enzymes called catalysts. In the forward reaction, two reactants combine to form one product. However, in a reverse reaction, the product is broken down into the two reactants.
In order for a forward reaction to occur, the reactants moving around in the test tube must physically interact with each other. The more often reactants interact with each other, the more produce is formed in the same amount of time. The speed at which reactants combine into products (the rate of the reaction) can be calculated by dividing the amount of a chemical produced in a reaction (often measured in moles) by the time it takes to produce that amount.
In order to determine the effects of reactant and product concentration, temperature, and presence of catalysts on the rate of a reaction, a scientist studied the following reaction:

The scientist varied the conditions of the experiment and measured the rate of the reaction. The results are outlined in Table 1. The units of concentration are moles per liter.

Q. If the moles of acid convertase were doubled, how would the rate of reaction change?
a)
Quadruple
b)
Double
c)
Triple
d)
Remain the Same
|
|
Ayesha Joshi answered |
According to Table 1, Experiments 2 and 3 show the moles of acid convertase doubling. The rate of the reaction, according to the final column, changes from 40 to 80, thus doubling.
The rate of a reversible chemical reaction depends on many factors, including concentrations of the reactants and products, temperature, and presence of enzymes called catalysts. In the forward reaction, two reactants combine to form one product. However, in a reverse reaction, the product is broken down into the two reactants.In order for a forward reaction to occur, the reactants moving around in the test tube must physically interact with each other. The more often reactants interact with each other, the more produce is formed in the same amount of time. The speed at which reactants combine into products (the rate of the reaction) can be calculated by dividing the amount of a chemical produced in a reaction (often measured in moles) by the time it takes to produce that amount.In order to determine the effects of reactant and product concentration, temperature, and presence of catalysts on the rate of a reaction, a scientist studied the following reaction: The scientist varied the conditions of the experiment and measured the rate of the reaction. The results are outlined in Table 1. The units of concentration are moles per liter.
 Q. What is a possible unit of a rate of reaction?
- a)Seconds/Mole
- b)Moles/Moles
- c)Moles/Second
- d)Moles/Liter
Correct answer is option 'C'. Can you explain this answer?
The rate of a reversible chemical reaction depends on many factors, including concentrations of the reactants and products, temperature, and presence of enzymes called catalysts. In the forward reaction, two reactants combine to form one product. However, in a reverse reaction, the product is broken down into the two reactants.
In order for a forward reaction to occur, the reactants moving around in the test tube must physically interact with each other. The more often reactants interact with each other, the more produce is formed in the same amount of time. The speed at which reactants combine into products (the rate of the reaction) can be calculated by dividing the amount of a chemical produced in a reaction (often measured in moles) by the time it takes to produce that amount.
In order to determine the effects of reactant and product concentration, temperature, and presence of catalysts on the rate of a reaction, a scientist studied the following reaction:

The scientist varied the conditions of the experiment and measured the rate of the reaction. The results are outlined in Table 1. The units of concentration are moles per liter.

Q. What is a possible unit of a rate of reaction?
a)
Seconds/Mole
b)
Moles/Moles
c)
Moles/Second
d)
Moles/Liter
|
|
Ayesha Joshi answered |
The passage describes that the reaction rate can be found by dividing the amount of chemicals produced in a reaction (moles) by the time it takes to produce them (seconds/minutes/hours/etc). The only answer choice that fits this pattern is moles/second. The other answer choices do contain the amount of chemicals produced but do not contain the time it takes to produce them.
Chemists can model how solids, liquids, and gases behave at different temperatures and pressures with a graph called a phase diagram. When the pressure and temperature are simultaneously known, a scientist can predict whether the material will be in a specific state. The diagram is divided into sections depending on the phase and the lines between sections represent phase transitions occurring between two or more separate phases.In general, solids of neatly stacked molecules exist when temperatures are low and pressures are intermediate. These values decrease the kinetic energy of the molecules enough to allow for attractive forces to begin the stacking process. Liquids, by contrast, are found at intermediate pressures and temperatures. The temperature is high enough to impart enough kinetic energy to prevent solid formation and the pressure is high enough to prevent the liquid from becoming a gas. Finally, a gas forms at low pressures and high temperatures. The high level of kinetic energy prevents molecules from associating with one another.Materials can undergo processes called phase transitions, meaning they can transition from one phase to another. The transition from a solid to a liquid is called melting, while the reverse transition is called freezing. Vaporization occurs when a liquid becomes a gas, while condensation occurs when a gas becomes a liquid. Finally, in a process called sublimation, a solid can directly become a gas without passing through a liquid phase. Additionally, when a gas directly becomes a solid, this is known as deposition. 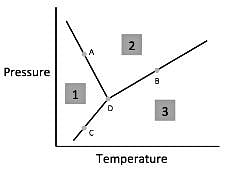 Q. According to the figure, the material represented by Area 1 is in what phase?
- a)Liquid
- b)Gas
- c)Solid
- d)Cannot Be Determined
Correct answer is option 'C'. Can you explain this answer?
Chemists can model how solids, liquids, and gases behave at different temperatures and pressures with a graph called a phase diagram. When the pressure and temperature are simultaneously known, a scientist can predict whether the material will be in a specific state. The diagram is divided into sections depending on the phase and the lines between sections represent phase transitions occurring between two or more separate phases.
In general, solids of neatly stacked molecules exist when temperatures are low and pressures are intermediate. These values decrease the kinetic energy of the molecules enough to allow for attractive forces to begin the stacking process. Liquids, by contrast, are found at intermediate pressures and temperatures. The temperature is high enough to impart enough kinetic energy to prevent solid formation and the pressure is high enough to prevent the liquid from becoming a gas. Finally, a gas forms at low pressures and high temperatures. The high level of kinetic energy prevents molecules from associating with one another.
Materials can undergo processes called phase transitions, meaning they can transition from one phase to another. The transition from a solid to a liquid is called melting, while the reverse transition is called freezing. Vaporization occurs when a liquid becomes a gas, while condensation occurs when a gas becomes a liquid. Finally, in a process called sublimation, a solid can directly become a gas without passing through a liquid phase. Additionally, when a gas directly becomes a solid, this is known as deposition.

Q. According to the figure, the material represented by Area 1 is in what phase?
a)
Liquid
b)
Gas
c)
Solid
d)
Cannot Be Determined
|
|
Ayesha Joshi answered |
According to paragraph two, solids are sets of neatly stacked molecules and exist when temperatures are low and pressures are intermediate. Looking at our figure, we can see that at low temperatures (towards the origin) and intermediate pressures, we are looking at area one. Thus, area one must be in the solid phase.
Chemists can model how solids, liquids, and gases behave at different temperatures and pressures with a graph called a phase diagram. When the pressure and temperature are simultaneously known, a scientist can predict whether the material will be in a specific state. The diagram is divided into sections depending on the phase and the lines between sections represent phase transitions occurring between two or more separate phases.In general, solids of neatly stacked molecules exist when temperatures are low and pressures are intermediate. These values decrease the kinetic energy of the molecules enough to allow for attractive forces to begin the stacking process. Liquids, by contrast, are found at intermediate pressures and temperatures. The temperature is high enough to impart enough kinetic energy to prevent solid formation and the pressure is high enough to prevent the liquid from becoming a gas. Finally, a gas forms at low pressures and high temperatures. The high level of kinetic energy prevents molecules from associating with one another.Materials can undergo processes called phase transitions, meaning they can transition from one phase to another. The transition from a solid to a liquid is called melting, while the reverse transition is called freezing. Vaporization occurs when a liquid becomes a gas, while condensation occurs when a gas becomes a liquid. Finally, in a process called sublimation, a solid can directly become a gas without passing through a liquid phase. Additionally, when a gas directly becomes a solid, this is known as deposition. 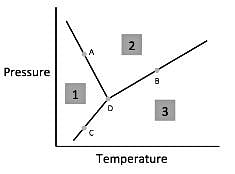 Q. According to the figure, the material represented by area two is in what phase?
- a)Solid
- b)Liquid
- c)Gas
- d)Cannot Be Determined
Correct answer is option 'B'. Can you explain this answer?
Chemists can model how solids, liquids, and gases behave at different temperatures and pressures with a graph called a phase diagram. When the pressure and temperature are simultaneously known, a scientist can predict whether the material will be in a specific state. The diagram is divided into sections depending on the phase and the lines between sections represent phase transitions occurring between two or more separate phases.
In general, solids of neatly stacked molecules exist when temperatures are low and pressures are intermediate. These values decrease the kinetic energy of the molecules enough to allow for attractive forces to begin the stacking process. Liquids, by contrast, are found at intermediate pressures and temperatures. The temperature is high enough to impart enough kinetic energy to prevent solid formation and the pressure is high enough to prevent the liquid from becoming a gas. Finally, a gas forms at low pressures and high temperatures. The high level of kinetic energy prevents molecules from associating with one another.
Materials can undergo processes called phase transitions, meaning they can transition from one phase to another. The transition from a solid to a liquid is called melting, while the reverse transition is called freezing. Vaporization occurs when a liquid becomes a gas, while condensation occurs when a gas becomes a liquid. Finally, in a process called sublimation, a solid can directly become a gas without passing through a liquid phase. Additionally, when a gas directly becomes a solid, this is known as deposition.

Q. According to the figure, the material represented by area two is in what phase?
a)
Solid
b)
Liquid
c)
Gas
d)
Cannot Be Determined
|
|
Ayesha Joshi answered |
According to paragraph two, liquids are found at intermediate pressures and temperatures. The only section on the graph that corresponds to intermediate pressures and temperatures is area two.
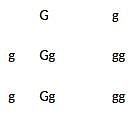 Scientist’s believe they have found the gene accountable for intelligence. The allele “G” is dominant, and the allele “g” is recessive. The intelligence gene is optimally expressed in the homozygous recessive form. The chart above shows the trait in the heterozygous form and the homozygous form. The form “gg” is from the mother, and “Gg” is from the father. The parents want to know what the gene might look like in their child.Q. According to the chart above, what are the chances of the child inheriting the optimal form of the gene?
 - a)100%
- b)25%
- c)0%
- d)50%
- e)75%
Correct answer is option 'D'. Can you explain this answer?

Scientist’s believe they have found the gene accountable for intelligence. The allele “G” is dominant, and the allele “g” is recessive. The intelligence gene is optimally expressed in the homozygous recessive form. The chart above shows the trait in the heterozygous form and the homozygous form. The form “gg” is from the mother, and “Gg” is from the father. The parents want to know what the gene might look like in their child.
Q. According to the chart above, what are the chances of the child inheriting the optimal form of the gene?
a)
100%
b)
25%
c)
0%
d)
50%
e)
75%
|
|
Ayesha Joshi answered |
The optimal form of the gene is the homozygous reccesive "gg," which has a 50 percent chance of resulting from the parental cross.
Scientists have recorded data in Region A, Region B, Region C and Region D. The data collected include the average daily temperature, the annual rainfall for the past year and the number of fresh water reservoirs. The scientists want to perform an experiment on wild life migration patterns. If another region was found to have 20 fresh water reservoirs, what could be the amount of annual rainfall for that region in inches?
 - a)64.3
- b)51.3
- c)43.1
- d)41.6
Correct answer is option 'A'. Can you explain this answer?
Scientists have recorded data in Region A, Region B, Region C and Region D. The data collected include the average daily temperature, the annual rainfall for the past year and the number of fresh water reservoirs. The scientists want to perform an experiment on wild life migration patterns.

If another region was found to have 20 fresh water reservoirs, what could be the amount of annual rainfall for that region in inches?
a)
64.3
b)
51.3
c)
43.1
d)
41.6

|
Orion Classes answered |
There is a trend in the data between the number of fresh water reservoirs and annual rainfall. As the amount of annual rainfall increases, so does the number of fresh water reservoirs. In Region B the annual rainfall was 51.3 inches and has the most reservoirs with 16. Since we are looking at region with 20 reservoirs and there is a direct relationship, the possible amount of annual rainfall must be larger than 51.3 inches. The correct answer is 64.3 inches. Note that Region C has more rainfall than Region A, but both have zero fresh water reservoirs. This can be do to that fact that there may be a minimum value of annual rainfall to maintain a fresh water reservoir.
The chart below depicts the average rainfall by location on the Earth. Zero degrees latitude corresponds to the equator. Positive latitudes are north of the equator, while negative latitudes are south of the equator. A latitude with a magnitude of 90 degrees correlates with one of Earth's poles.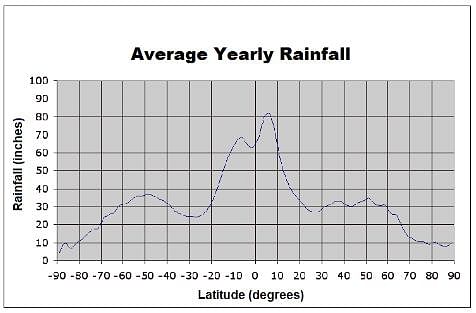 The Tropic of Capricorn is about 23.5 degrees south of the equator. Approximately how many more inches of rain does this latitude experience than the North Pole?
- a)10 inches
- b)20 inches
- c)15 inches
- d)25 inches
Correct answer is option 'C'. Can you explain this answer?
The chart below depicts the average rainfall by location on the Earth. Zero degrees latitude corresponds to the equator. Positive latitudes are north of the equator, while negative latitudes are south of the equator. A latitude with a magnitude of 90 degrees correlates with one of Earth's poles.

The Tropic of Capricorn is about 23.5 degrees south of the equator. Approximately how many more inches of rain does this latitude experience than the North Pole?
a)
10 inches
b)
20 inches
c)
15 inches
d)
25 inches

|
Orion Classes answered |
To find out the difference in amount of rainfall between these two latitudes, locate −23.5 degrees on the x-axis and find the corresponding amount of rainfall on the y-axis (25 inches). Next, find the latitude of the North Pole (90 degrees) and its corresponding amount of rainfall (10 inches). Finally, subtract the two to find how much more rain the Tropic of Capricorn receives: 25−10 = 15 in
Explorers have discovered a new planet, Planet K. It is known that Planet K has magnetic poles to similar to those of Earth, so the explorers decide that using a compass to navigate is possible. When navigating Planet K's surface, it is discovered that the compass points north for a distance then flips so that it points north in the opposite direction for a distance, before returning to pointing north in the original direction. It is known that the magnetic poles of the planet flip every 100 years. Weather is recorded on the planet for 250 years.  How does the flipping of the magnetic poles affect the weather on Planet K?
- a)Cannot be determined from the given information
- b)It causes a sharp temperature decrease and a reduction in precipitation
- c)It causes the temperature to increase, but the precipitation to decrease
- d)It causes the temperature to decrease, but the precipitation to increase
Correct answer is option 'B'. Can you explain this answer?
Explorers have discovered a new planet, Planet K. It is known that Planet K has magnetic poles to similar to those of Earth, so the explorers decide that using a compass to navigate is possible. When navigating Planet K's surface, it is discovered that the compass points north for a distance then flips so that it points north in the opposite direction for a distance, before returning to pointing north in the original direction. It is known that the magnetic poles of the planet flip every 100 years. Weather is recorded on the planet for 250 years.

How does the flipping of the magnetic poles affect the weather on Planet K?
a)
Cannot be determined from the given information
b)
It causes a sharp temperature decrease and a reduction in precipitation
c)
It causes the temperature to increase, but the precipitation to decrease
d)
It causes the temperature to decrease, but the precipitation to increase

|
Orion Classes answered |
It can be seen in the data table that in the years 0, 100 and 200 the temperature is well below zero and the precipitation is much less than that recorded in the years 50, 150 and 250. Since the poles flip direction every 100 years it is reasonable to assume that the flipping of the poles causes a decrease in temperature and a reduction in the precipitation.
A scientist has observed a new planet, Planet H. It was discovered that Planet H has water on its surface. As a result, it is being investigated to determine if it is possible for Planet H to sustain human life. Futhermore, observations revealed that Planet H has four moons: Moon J, Moon K, Moon L, and Moon M. Each moon's radius, distance to Planet H, and time to orbit Planet H have been recorded in the provided table.  On Earth the moon has a large effect on ocean tides. If it was found that the moons have a tidal affect on Planet H, then which of Planet H's moons would have the largest affect on its oceans?
 - a)Moon L
- b)Moon K
- c)Moon J
- d)It cannot be determined from the given information
Correct answer is option 'D'. Can you explain this answer?
A scientist has observed a new planet, Planet H. It was discovered that Planet H has water on its surface. As a result, it is being investigated to determine if it is possible for Planet H to sustain human life. Futhermore, observations revealed that Planet H has four moons: Moon J, Moon K, Moon L, and Moon M. Each moon's radius, distance to Planet H, and time to orbit Planet H have been recorded in the provided table.

On Earth the moon has a large effect on ocean tides. If it was found that the moons have a tidal affect on Planet H, then which of Planet H's moons would have the largest affect on its oceans?
a)
Moon L
b)
Moon K
c)
Moon J
d)
It cannot be determined from the given information

|
Orion Classes answered |
It is not stated what causes moons to affect the tides on the planet's oceans. The mass of the moon, radius of the moon and distance from Planet H to each moon could impact the affect on the oceans due to the moons. However, it is not stated how each parameter will affect each moon's impact on the tides on Planet H. For example, the mass of the moon could be the largest determining factor or the distance from planet H to each moon could be the largest determining factor on the impact of each moon's affect on the tides. Therefore, the answer cannot be determined from the given information.
A physicist wishes to study the trajectory of a ball launched horizontally. She varies parameters such as the launching velocity, starting height, and mass of the ball. For each trajectory, she records the time of flight (in seconds) and horizontal displacement (in meters). She assumes air resistance is negligible.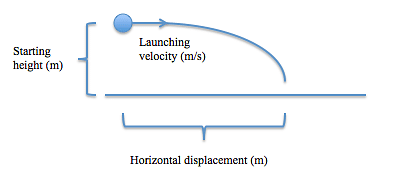 Using all of the data she collects, she constructs the following table:
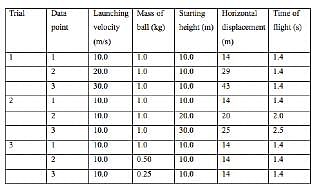
If all of trial 3 were redone with a launching velocity of 20 m/s instead of 10 m/s, then compared to the data for trial 3 presented in the table, the horizontal displacement for all data points would be which of the following?- a)Greater
- b)Smaller
- c)The same
- d)Cannot be determined
Correct answer is option 'A'. Can you explain this answer?
A physicist wishes to study the trajectory of a ball launched horizontally. She varies parameters such as the launching velocity, starting height, and mass of the ball. For each trajectory, she records the time of flight (in seconds) and horizontal displacement (in meters). She assumes air resistance is negligible.

Using all of the data she collects, she constructs the following table:

If all of trial 3 were redone with a launching velocity of 20 m/s instead of 10 m/s, then compared to the data for trial 3 presented in the table, the horizontal displacement for all data points would be which of the following?
a)
Greater
b)
Smaller
c)
The same
d)
Cannot be determined
|
|
Ayesha Joshi answered |
Trial 3 shows us that the mass of the ball does not affect horizontal displacement, so mass can be ignored for this question. Trial 1 shows us that horizontal displacement increases with launching velocity, so we can reason that a higher launching velocity in Trial 3 would result in increased horizontal displacement.
A physicist wishes to study the trajectory of a ball launched horizontally. She varies parameters such as the launching velocity, starting height, and mass of the ball. For each trajectory, she records the time of flight (in seconds) and horizontal displacement (in meters). She assumes air resistance is negligible. Using all of the data she collects, she constructs the following table:
In Trial 1, if a fourth data point were collected in which the ball was thrown with a launching velocity of 40 m/s, what would be the approximate horizontal displacement in meters?- a)48
- b)52
- c)63
- d)57
Correct answer is option 'D'. Can you explain this answer?
A physicist wishes to study the trajectory of a ball launched horizontally. She varies parameters such as the launching velocity, starting height, and mass of the ball. For each trajectory, she records the time of flight (in seconds) and horizontal displacement (in meters). She assumes air resistance is negligible.

Using all of the data she collects, she constructs the following table:

In Trial 1, if a fourth data point were collected in which the ball was thrown with a launching velocity of 40 m/s, what would be the approximate horizontal displacement in meters?
a)
48
b)
52
c)
63
d)
57
|
|
Ayesha Joshi answered |
Looking at the table, we see that as the launching velocity is increased by 10 m/s in Trial 1, the horizontal displacement increases by about 14 meters.
Chapter doubts & questions for Data Representation - Science for ACT 2025 is part of ACT exam preparation. The chapters have been prepared according to the ACT exam syllabus. The Chapter doubts & questions, notes, tests & MCQs are made for ACT 2025 Exam. Find important definitions, questions, notes, meanings, examples, exercises, MCQs and online tests here.
Chapter doubts & questions of Data Representation - Science for ACT in English & Hindi are available as part of ACT exam.
Download more important topics, notes, lectures and mock test series for ACT Exam by signing up for free.
Science for ACT
486 videos|517 docs|337 tests
|
Signup to see your scores go up within 7 days!
Study with 1000+ FREE Docs, Videos & Tests
10M+ students study on EduRev

Contact Support
Our team is online on weekdays between 10 AM - 7 PM
Typical reply within 3 hours
|
Free Exam Preparation
at your Fingertips!
Access Free Study Material - Test Series, Structured Courses, Free Videos & Study Notes and Prepare for Your Exam With Ease

 Join the 10M+ students on EduRev
|

|
Forgot Password
OR
Signup to see your scores
go up within 7 days!
Access 1000+ FREE Docs, Videos and Tests
Takes less than 10 seconds to signup


