


All Exams >
Grade 6 >
Mathematics for Grade 6 >
All Questions
All questions of Coordinates and Graphs for Grade 6 Exam


In which quadrant does the point Q (-2, -6) lie?- a)I
- b)II
- c)IV
- d)III
Correct answer is option 'D'. Can you explain this answer?
In which quadrant does the point Q (-2, -6) lie?
a)
I
b)
II
c)
IV
d)
III
|
|
Shubham Sharma answered |
The third quadrant is the quadrant where x and y are negative. Hence (-2,-6) lie in 3rd quadrant
In which quadrant does the point P (-5, -1) lie?- a)First quadrant
- b) Second Quadrant
- c)Third Quadrant
- d)Fourth quadrant
Correct answer is option 'C'. Can you explain this answer?
In which quadrant does the point P (-5, -1) lie?
a)
First quadrant
b)
Second Quadrant
c)
Third Quadrant
d)
Fourth quadrant
|
|
Ananya Das answered |
In first quadrant we have (+,+) in second quadrant we have (-,+) in third quadrant we have (-,-) and in 4quadrant we have (+,-)so (-5,-1)lies in 3rd quadrant.

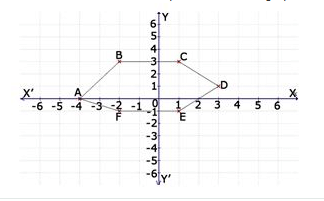
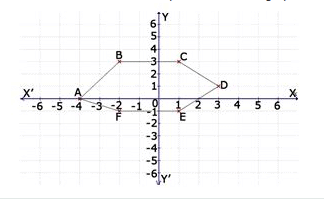
Find the coordinates of the point B from the graph. 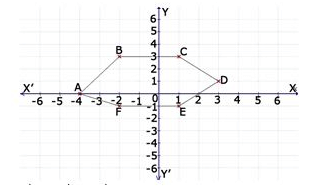
- a)(-2, 3)
- b)(0, -4)
- c)(-4, 5)
- d)none of these
Correct answer is option 'A'. Can you explain this answer?
Find the coordinates of the point B from the graph.
a)
(-2, 3)
b)
(0, -4)
c)
(-4, 5)
d)
none of these
|
|
Ananya Das answered |
The point is -2 units from x-coordinate and 3 units from y coordinate, hence the coordinates of the point is (-2,3).
Find the coordinates of the point A from the graph. 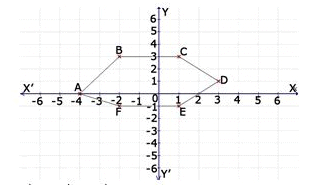
- a)(-4, 5)
- b)(-4, 0)
- c)(0, -4)
- d)none of these
Correct answer is option 'B'. Can you explain this answer?
Find the coordinates of the point A from the graph.
a)
(-4, 5)
b)
(-4, 0)
c)
(0, -4)
d)
none of these
|
|
Glory Lobulu answered |
In reading or writing coordinates of points we start by reading the X-axis then followed by the Y-axis, therefore the X-axis of A is -4 and its Y-axis is 0 hence the answer will be (-4,0)
On which axis does the point (0, 5) lie?- a)origin
- b)x-axis
- c)y-axis
- d)None of these
Correct answer is option 'C'. Can you explain this answer?
On which axis does the point (0, 5) lie?
a)
origin
b)
x-axis
c)
y-axis
d)
None of these
|
|
Rajesh Basu answered |
ANSWER :- c
Solution :- The point (0,5) lies on Y- axis.
Hence, x=0, y=5

A ________ is a bar graph that shows data in intervals.- a)Bar-graph
- b)Histograph
- c)Pie-chart
- d)Line Graph
Correct answer is option 'B'. Can you explain this answer?
A ________ is a bar graph that shows data in intervals.
a)
Bar-graph
b)
Histograph
c)
Pie-chart
d)
Line Graph

|
Divyansh Chaudhary answered |
Understanding Histograms
A histogram is a graphical representation of data that organizes a group of data points into specified ranges or intervals. It is particularly useful for displaying the distribution of numerical data.
Key Features of Histograms:
- Data in Intervals: Unlike regular bar graphs, histograms display data in continuous intervals. Each bar represents the frequency of data points within a specific range.
- Continuous Data: Histograms are ideal for continuous data, such as heights, weights, or test scores, where the values fall within a range rather than being discrete.
- Bars Touching: In a histogram, the bars are adjacent to each other, indicating that the intervals are connected. This contrasts with bar graphs, where bars represent distinct categories and are separated.
How Histograms Work:
- Interval Creation: The data set is divided into intervals called "bins." For example, if you're measuring test scores, you might create bins for scores 0-10, 11-20, and so on.
- Frequency Count: The height of each bar represents the number of data points falling within that interval. This allows for quick visual interpretation of how data is distributed.
- Shape Interpretation: The shape of the histogram can reveal patterns, such as normal distribution, skewness, or bimodality, helping to identify trends in the data.
Conclusion:
In summary, a histogram is a specialized type of bar graph designed to show data in intervals, making it an essential tool for statistical analysis and data visualization. Understanding how to read and interpret histograms is crucial for effectively analyzing data patterns and distributions.
(o, y) are the co-ordinates of a point lying on which of the following?- a)origin
- b)y-axis
- c)x-axis
- d)none of these.
Correct answer is option 'B'. Can you explain this answer?
(o, y) are the co-ordinates of a point lying on which of the following?
a)
origin
b)
y-axis
c)
x-axis
d)
none of these.
|
|
Meera Kumar answered |
As we don’t have any units for x-coordinate the ,so the point lies on the y-axis.
Find the coordinates of the point D from the graph. 
- a) (0, -4)
- b) (-4, 5)
- c) (3, 1)
- d) None of these
Correct answer is option 'C'. Can you explain this answer?
Find the coordinates of the point D from the graph.
a)
(0, -4)
b)
(-4, 5)
c)
(3, 1)
d)
None of these

|
Avneet Aulakh answered |
That is because coordinations are written like this:(x,y)That means that the X value will come first because it is independent value and after that the Y value will come because it is a dependent value.
The point (0, 4) lies on which of the following:- a)x-axis
- b)y-axis
- c)origin
- d)none of these.
Correct answer is option 'B'. Can you explain this answer?
The point (0, 4) lies on which of the following:
a)
x-axis
b)
y-axis
c)
origin
d)
none of these.

|
EduRev Class 8 answered |
There are no units for x-coordinate and 5 units of y- coordinate . So the point lies on the y-axis.
On which axis does the point (5, 0) lie?- a)origin
- b)y-axis
- c)x-axis
- d)None of these
Correct answer is option 'C'. Can you explain this answer?
On which axis does the point (5, 0) lie?
a)
origin
b)
y-axis
c)
x-axis
d)
None of these
|
|
Srestha Dey answered |
Understanding Coordinate Points
When dealing with coordinate points in a two-dimensional plane, each point is represented by an ordered pair (x, y). The first number, x, indicates the horizontal position, while the second number, y, denotes the vertical position.
Analyzing the Point (5, 0)
The point (5, 0) has the following characteristics:
- x-coordinate: 5
- y-coordinate: 0
This means that the point is located 5 units to the right of the origin (0,0) along the x-axis and has no vertical displacement since the y-coordinate is 0.
Identifying the Axes
To understand where the point lies, we can look at the definitions of the axes:
- Origin: The point (0, 0) where the x-axis and y-axis intersect.
- y-axis: The vertical line where x is always 0 (points like (0, 1), (0, -2)).
- x-axis: The horizontal line where y is always 0 (points like (1, 0), (-2, 0)).
Conclusion
Since the y-coordinate of the point (5, 0) is zero, it indicates that the point lies directly on the x-axis.
- Therefore, the correct answer is option 'C': the point (5, 0) lies on the x-axis.
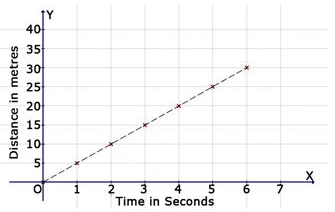
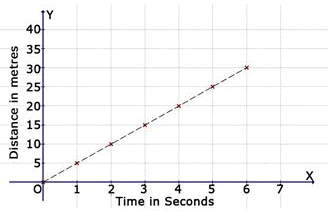
Find the distance covered in 5 seconds. 
- a)25 m
- b)10 m
- c)20 m
- d)none of these
Correct answer is option 'A'. Can you explain this answer?
Find the distance covered in 5 seconds.
a)
25 m
b)
10 m
c)
20 m
d)
none of these

|
Get Idea answered |
- To find the distance covered in 5 seconds:Assume a constant speed as shown in the image.
- Using the formula: Distance = Speed × Time.
If speed is 5 m/s, then:
Distance = 5 m/s × 5 s = 25 m.
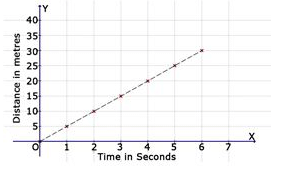
Find the distance covered in 7 seconds by observing the graph.
- a)30 m
- b)25 m
- c)35 m
- d)20 m
Correct answer is option 'C'. Can you explain this answer?
Find the distance covered in 7 seconds by observing the graph.
a)
30 m
b)
25 m
c)
35 m
d)
20 m
|
|
Get Idea answered |
As the graph is straight-line, we can observe that in each second, the distance covered is 5 metres. Thus we can conclude that in 7 seconds the distance covered will be 7 x 5 = 35 metres
The point (4,0) lies on which of the following?- a)x-axis
- b)y-axis
- c)origin
- d)None of the above
Correct answer is option 'A'. Can you explain this answer?
The point (4,0) lies on which of the following?
a)
x-axis
b)
y-axis
c)
origin
d)
None of the above
|
|
Rutuja Kumar answered |
Explanation:
To understand why the point (4,0) lies on the x-axis, we need to understand the Cartesian coordinate system.
Cartesian Coordinate System:
The Cartesian coordinate system is a grid system used to represent points in a plane. It consists of two perpendicular lines called the x-axis and y-axis. The point where these two axes intersect is called the origin.
X-Axis:
The x-axis is the horizontal line on the coordinate plane. It is the line where the y-coordinate is always zero. In other words, any point on the x-axis will have a y-coordinate of zero.
Y-Axis:
The y-axis is the vertical line on the coordinate plane. It is the line where the x-coordinate is always zero. In other words, any point on the y-axis will have an x-coordinate of zero.
Origin:
The origin is the point (0,0) where the x-axis and y-axis intersect. It serves as the reference point for all other points on the coordinate plane.
Point (4,0) on the Coordinate Plane:
Now, let's consider the point (4,0). This point has an x-coordinate of 4 and a y-coordinate of 0.
If we plot this point on the coordinate plane, we can see that it lies on the x-axis. The x-coordinate is positive (4), but the y-coordinate is zero. Therefore, the point (4,0) lies on the x-axis.
Conclusion:
In conclusion, the point (4,0) lies on the x-axis.


Chapter doubts & questions for Coordinates and Graphs - Mathematics for Grade 6 2025 is part of Grade 6 exam preparation. The chapters have been prepared according to the Grade 6 exam syllabus. The Chapter doubts & questions, notes, tests & MCQs are made for Grade 6 2025 Exam. Find important definitions, questions, notes, meanings, examples, exercises, MCQs and online tests here.
Chapter doubts & questions of Coordinates and Graphs - Mathematics for Grade 6 in English & Hindi are available as part of Grade 6 exam.
Download more important topics, notes, lectures and mock test series for Grade 6 Exam by signing up for free.
Mathematics for Grade 6
142 videos|210 docs|58 tests
|
|
© EduRev
|
Education Revolution
|


|


Signup to see your scores
go up within 7 days!
Access 1000+ FREE Docs, Videos and Tests
Takes less than 10 seconds to signup