


All Exams >
Bank Exams >
IBPS Clerk Prelims 2024 Preparation >
All Questions
All questions of 3. Line Charts for Bank Exams Exam
The following line graph gives the percent profit earned by two Companies X and Y during the period 1996 - 2001.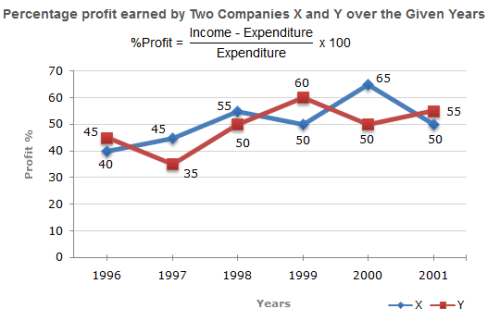 The expenditure of Company X in the year 1998 was Rs. 200 crores and the income of company X in 1998 was the same as its expenditure in 2001. The income of Company X in 2001 was ?
- a)Rs. 465 crores
- b)Rs. 385 crores
- c)Rs. 335 crores
- d)Rs. 295 crores
Correct answer is option 'A'. Can you explain this answer?
The following line graph gives the percent profit earned by two Companies X and Y during the period 1996 - 2001.
The expenditure of Company X in the year 1998 was Rs. 200 crores and the income of company X in 1998 was the same as its expenditure in 2001. The income of Company X in 2001 was ?
a)
Rs. 465 crores
b)
Rs. 385 crores
c)
Rs. 335 crores
d)
Rs. 295 crores
|
|
Viraj Srivastava answered |
Expenditure of Company x in 1998 is 200cr profit of Company x in 1998 is 55% So, income of Company x in 1998 = 200cr×55/100+200cr= 310cr Now it is given in question that income in 1998=expenditure in 2001 Expenditure in 2001 is 310cr Profit of Company x is 50 percent Now income of company x in 2001 310cr×50/100+310cr = 465cr Hence income of company x in 465cr
| 1 Crore+ students have signed up on EduRev. Have you? Download the App |
The following line graph gives the ratio of the amounts of imports by a company to the amount of exports from that company over the period from 1995 to 2001.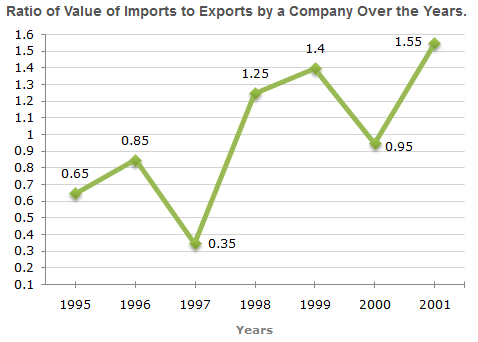 What was the percentage increase in imports from 1997 to 1998 ?
- a)72
- b)56
- c)28
- d)Data inadequate
Correct answer is option 'D'. Can you explain this answer?
The following line graph gives the ratio of the amounts of imports by a company to the amount of exports from that company over the period from 1995 to 2001.
What was the percentage increase in imports from 1997 to 1998 ?
a)
72
b)
56
c)
28
d)
Data inadequate

|
Master Training Institute answered |
The graph gives only the ratio of imports to exports for different years. To find the percentage increase in imports from 1997 to 1998, we require more details such as the value of imports or exports during these years.
Hence, the data is inadequate to answer this question.
The following line graph gives the percent profit earned by two Companies X and Y during the period 1996 - 2001.The incomes of two Companies X and Y in 2000 were in the ratio of 3:4 respectively. What was the respective ratio of their expenditures in 2000 ?- a)7:22
- b)14:19
- c)15:22
- d)27:35
Correct answer is option 'C'. Can you explain this answer?
The following line graph gives the percent profit earned by two Companies X and Y during the period 1996 - 2001.
The incomes of two Companies X and Y in 2000 were in the ratio of 3:4 respectively. What was the respective ratio of their expenditures in 2000 ?
a)
7:22
b)
14:19
c)
15:22
d)
27:35

|
Ishani Rane answered |

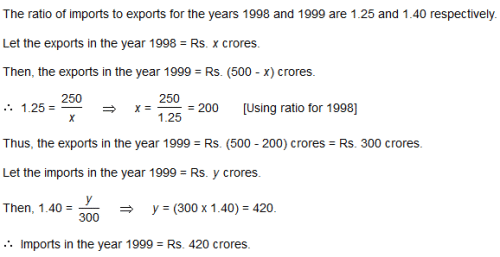
Practice Quiz or MCQ (Multiple Choice Questions) with solutions are available for Practice, which would help you prepare for "Line Charts" under LR and DI. You can practice these practice quizzes as per your speed and improvise the topic. The same topic is covered under various competitive examinations like - CAT, GMAT, Bank PO, SSC and other competitive examinations.Q.The following line graph gives the ratio of the amounts of imports by a company to the amount of exports from that company over the period from 1995 to 2001.If the imports in 1998 was Rs. 250 crores and the total exports in the years 1998 and 1999 together was Rs. 500 crores, then the imports in 1999 was ?- a)Rs. 250 crores
- b)Rs. 300 crores
- c)Rs. 357 crores
- d)Rs. 420 crores
Correct answer is option 'D'. Can you explain this answer?
Practice Quiz or MCQ (Multiple Choice Questions) with solutions are available for Practice, which would help you prepare for "Line Charts" under LR and DI. You can practice these practice quizzes as per your speed and improvise the topic. The same topic is covered under various competitive examinations like - CAT, GMAT, Bank PO, SSC and other competitive examinations.
Q.
The following line graph gives the ratio of the amounts of imports by a company to the amount of exports from that company over the period from 1995 to 2001.
If the imports in 1998 was Rs. 250 crores and the total exports in the years 1998 and 1999 together was Rs. 500 crores, then the imports in 1999 was ?
a)
Rs. 250 crores
b)
Rs. 300 crores
c)
Rs. 357 crores
d)
Rs. 420 crores

|
Anjana Banerjee answered |
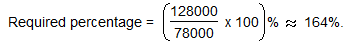
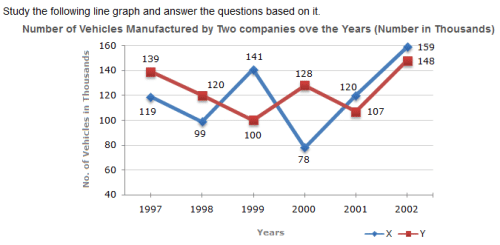 What is the difference between the number of vehicles manufactured by Company Y in 2000 and 2001 ?
- a)50000
- b)42000
- c)33000
- d)21000
Correct answer is option 'D'. Can you explain this answer?
What is the difference between the number of vehicles manufactured by Company Y in 2000 and 2001 ?
a)
50000
b)
42000
c)
33000
d)
21000
|
|
Priya Reddy answered |
Required difference = (128000 - 107000) = 21000.
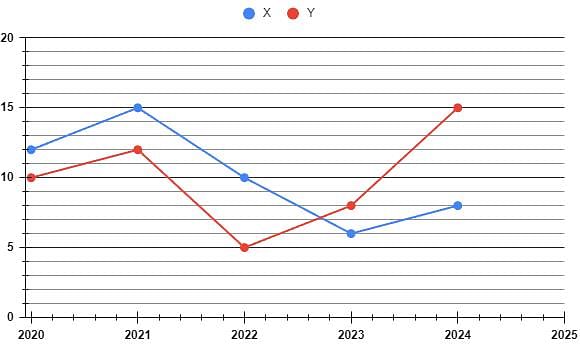
Directions: The following line graph shows the data of rate of interests provided by company X and Y in the following 5 years, 2020, 2021, 2022, 2023,and 2024. (all the interest rates are simple interest rate)
 A person invests an amount of Rs. 50000 in company Y in 2023 for 1 year. After one year, from the total amount received, he bought a Television worth of Rs. 20000 and invested the remaining amount in company X for one year. Find the interest received by him from the investment.
- a)Rs. 2520
- b)Rs. 2620
- c)Rs. 2800
- d)Rs. 2820
Correct answer is option 'C'. Can you explain this answer?
Directions: The following line graph shows the data of rate of interests provided by company X and Y in the following 5 years, 2020, 2021, 2022, 2023,and 2024. (all the interest rates are simple interest rate)
A person invests an amount of Rs. 50000 in company Y in 2023 for 1 year. After one year, from the total amount received, he bought a Television worth of Rs. 20000 and invested the remaining amount in company X for one year. Find the interest received by him from the investment.
a)
Rs. 2520
b)
Rs. 2620
c)
Rs. 2800
d)
Rs. 2820

|
Aim It Academy answered |
Given:
A person invests an amount of Rs. 50000 in company Y in 2023 for 1 year
He bought a Television worth of Rs. 20000 in the next year with the amount received
He invested the remaining amount in company X for one year
Concept Used:
Simple interest (SI) = (P × R × T)/100
Where, P = principal amount, R = rate of interest, and T = time of investment
Calculation:
Amount received after 1 year from Y = 50000 + (50000 × 8)/100 = Rs. 54000
Remaining amount after buying television = 54000 - 20000 = Rs. 34000
Interest received on Rs. 34000 in the next year from X = (34000 × 8)/100 = Rs. 2720
∴ The correct answer is option 3
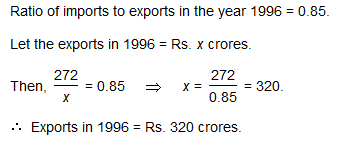
The following line graph gives the ratio of the amounts of imports by a company to the amount of exports from that company over the period from 1995 to 2001.If the imports of the company in 1996 was Rs. 272 crores, the exports from the company in 1996 was ?- a)Rs. 370 crores
- b)Rs. 320 crores
- c)Rs. 280 crores
- d)Rs. 275 crores
Correct answer is option 'B'. Can you explain this answer?
The following line graph gives the ratio of the amounts of imports by a company to the amount of exports from that company over the period from 1995 to 2001.
If the imports of the company in 1996 was Rs. 272 crores, the exports from the company in 1996 was ?
a)
Rs. 370 crores
b)
Rs. 320 crores
c)
Rs. 280 crores
d)
Rs. 275 crores
|
|
Anjana Banerjee answered |
Directions: The following line graph shows the data of rate of interests provided by company X and Y in the following 5 years, 2020, 2021, 2022, 2023,and 2024. (all the interest rates are simple interest rate)
 Two different amounts in the ratio 8 : 15 are invested in X and Y respectively in 2022. Then find the ratio of the amount received after 1 year for X to Y.
- a)167 : 315
- b)176 : 315
- c)176 : 351
- d)167 : 351
Correct answer is option 'B'. Can you explain this answer?
Directions: The following line graph shows the data of rate of interests provided by company X and Y in the following 5 years, 2020, 2021, 2022, 2023,and 2024. (all the interest rates are simple interest rate)
Two different amounts in the ratio 8 : 15 are invested in X and Y respectively in 2022. Then find the ratio of the amount received after 1 year for X to Y.
a)
167 : 315
b)
176 : 315
c)
176 : 351
d)
167 : 351

|
Spectrum Coaching Institute answered |
Given:
Two different amounts in the ratio 8 : 15 are invested in X and Y respectively in 2022
Concept Used:
Simple interest (SI) = (P × R × T)/100
Where, P = principal amount, R = rate of interest, and T = time of investment
Calculation:
Let, the amount invested in X is = 8a, and in Y is = 15a in 2022
The amount received from X = 8a + (8a × 10)/100 = Rs. (88a/10)
The amount received from Y = 15a + (15a × 5)/100 = Rs. (63a/4)
The respective ratio of amount received from X and Y is
⇒ (88a/10) : (63a/4) = 176 : 315
∴ The correct answer is option 2
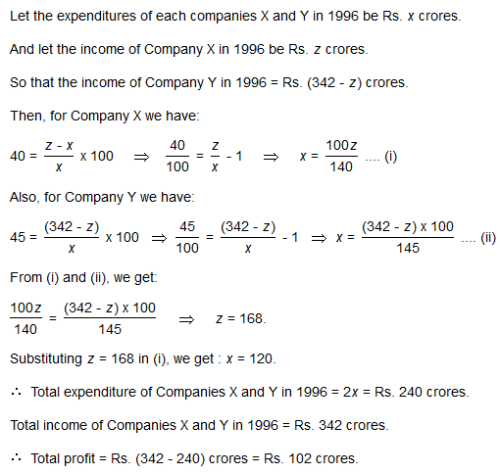
The following line graph gives the percent profit earned by two Companies X and Y during the period 1996 - 2001.If the expenditures of Company X and Y in 1996 were equal and the total income of the two Companies in 1996 was Rs. 342 crores, what was the total profit of the two Companies together in 1996 ? (Profit = Income - Expenditure)- a)Rs. 240 crores
- b)Rs. 171 crores
- c)Rs. 120 crores
- d)Rs. 102 crores
Correct answer is option 'D'. Can you explain this answer?
The following line graph gives the percent profit earned by two Companies X and Y during the period 1996 - 2001.
If the expenditures of Company X and Y in 1996 were equal and the total income of the two Companies in 1996 was Rs. 342 crores, what was the total profit of the two Companies together in 1996 ? (Profit = Income - Expenditure)
a)
Rs. 240 crores
b)
Rs. 171 crores
c)
Rs. 120 crores
d)
Rs. 102 crores

|
Naveen Jain answered |
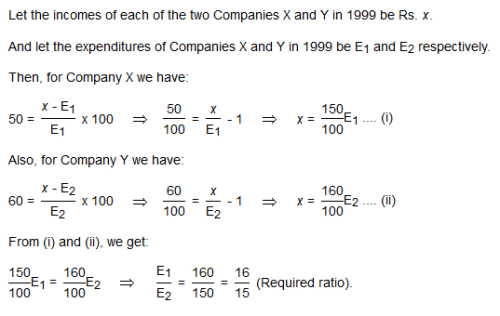
The following line graph gives the percent profit earned by two Companies X and Y during the period 1996 - 2001If the incomes of two Comapanies were equal in 1999, then what was the ratio of expenditure of Company X to that of Company Y in 1999 ?- a)6:5
- b)5:6
- c)11:6
- d)16:15
Correct answer is option 'D'. Can you explain this answer?
The following line graph gives the percent profit earned by two Companies X and Y during the period 1996 - 2001
If the incomes of two Comapanies were equal in 1999, then what was the ratio of expenditure of Company X to that of Company Y in 1999 ?
a)
6:5
b)
5:6
c)
11:6
d)
16:15
|
|
Gowri Dasgupta answered |
The following line graph gives the ratio of the amounts of imports by a company to the amount of exports from that company over the period from 1995 to 2001.In how many of the given years were the exports more than the imports ?- a)1
- b)2
- c)3
- d)4
Correct answer is option 'D'. Can you explain this answer?
The following line graph gives the ratio of the amounts of imports by a company to the amount of exports from that company over the period from 1995 to 2001.
In how many of the given years were the exports more than the imports ?
a)
1
b)
2
c)
3
d)
4
|
|
Surbhi Joshi answered |
The exports are more than the imports imply that the ratio of value of imports to exports is less than 1.
Now, this ratio is less than 1 in years 1995, 1996, 1997 and 2000.
Thus, there are four such years.
Directions: The following line graph shows the data of rate of interests provided by company X and Y in the following 5 years, 2020, 2021, 2022, 2023,and 2024. (all the interest rates are simple interest rate)
 A person invested Rs. 12,500 in company X in the year 2020 for 1 year. If he had invested the same amount in company Y for one year in 2020, how much less amount would he earn than?
- a)Rs. 200
- b)Rs. 250
- c)Rs. 500
- d)Rs. 550
Correct answer is option 'B'. Can you explain this answer?
Directions: The following line graph shows the data of rate of interests provided by company X and Y in the following 5 years, 2020, 2021, 2022, 2023,and 2024. (all the interest rates are simple interest rate)
A person invested Rs. 12,500 in company X in the year 2020 for 1 year. If he had invested the same amount in company Y for one year in 2020, how much less amount would he earn than?
a)
Rs. 200
b)
Rs. 250
c)
Rs. 500
d)
Rs. 550

|
Wizius Careers answered |
Given:
A person invested Rs. 12,500 in company X in the year 2020 for 1 year
Concept Used:
Simple interest (SI) = (P × R × T)/100
Where, P = principal amount, R = rate of interest, and T = time of investment
Calculation:
The interest received from X = (12500 × 12)/100 = Rs. 1500
The interest received from Y = (12500 × 10)/100 = Rs. 1250
He would earn (1500 - 1250) = Rs. 250 less from Y than X
∴ The correct answer is option 2
Directions: The following line graph shows the data of rate of interests provided by company X and Y in the following 5 years, 2020, 2021, 2022, 2023,and 2024. (all the interest rates are simple interest rate)
 In 2023, a part of Rs. 45,000 is invested in company X and the rest was invested in company Y for 1 year. If the total interest received is Rs. 3100, then what was the amount invested in company X?
- a)Rs. 20000
- b)Rs. 25000
- c)Rs. 15000
- d)Rs. 30000
Correct answer is option 'B'. Can you explain this answer?
Directions: The following line graph shows the data of rate of interests provided by company X and Y in the following 5 years, 2020, 2021, 2022, 2023,and 2024. (all the interest rates are simple interest rate)
In 2023, a part of Rs. 45,000 is invested in company X and the rest was invested in company Y for 1 year. If the total interest received is Rs. 3100, then what was the amount invested in company X?
a)
Rs. 20000
b)
Rs. 25000
c)
Rs. 15000
d)
Rs. 30000
|
|
Learnpro Institute answered |
Given:
In 2023, a part of Rs. 45,000 is invested in company X
The rest was invested in company Y for 1 year
The total interest received is Rs. 3100
Concept Used:
Simple interest (SI) = (P × R × T)/100
Where, P = principal amount, R = rate of interest, and T = time of investment
Calculation:
Let, Rs. a is invested in X and Rs. (45000 - a) is invested in Y
According to the question,
(6a/100) + (45000 - a) × 8/100 = 3100
⇒ 6a + 360000 - 8a = 310000
⇒ 2a = 50000
⇒ a = 25000
∴ The amount invested in X was Rs. 25000
In which of the following years, the difference between the productions of Companies X and Y was the maximum among the given years ?- a)1997
- b)1998
- c)1999
- d)2000
Correct answer is option 'D'. Can you explain this answer?
In which of the following years, the difference between the productions of Companies X and Y was the maximum among the given years ?
a)
1997
b)
1998
c)
1999
d)
2000
|
|
Devansh Majumdar answered |
The difference between the productions of Companies X and Y in various years are:
For 1997 (139000 - 119000) = 20000.
For 1998 (120000 - 99000) = 21000.
For 1999 (141000 - 100000) = 41000.
For 2000 (128000 - 78000) = 50000.
For 2001 (120000 - 107000) = 13000.
For 2002 (159000 - 148000) = 11000.
Clearly, maximum difference was in 2000.
Directions: The following line graph shows the data of rate of interests provided by company X and Y in the following 5 years, 2020, 2021, 2022, 2023,and 2024. (all the interest rates are simple interest rate)
 In 2024, an amount of 1 Lac is invested in company X for 1 year and after that the total amount received is invested in company Y for 1 year in 2025. Find the total amount received after these two years. (The interest rate of 2025 for Y is the same as 2024)
- a)Rs. 124000
- b)Rs. 124200
- c)Rs. 123200
- d)Rs. 124500
Correct answer is option 'B'. Can you explain this answer?
Directions: The following line graph shows the data of rate of interests provided by company X and Y in the following 5 years, 2020, 2021, 2022, 2023,and 2024. (all the interest rates are simple interest rate)
In 2024, an amount of 1 Lac is invested in company X for 1 year and after that the total amount received is invested in company Y for 1 year in 2025. Find the total amount received after these two years. (The interest rate of 2025 for Y is the same as 2024)
a)
Rs. 124000
b)
Rs. 124200
c)
Rs. 123200
d)
Rs. 124500

|
Aspire Academy answered |
Given:
In 2024, an amount of 1 Lac is invested in company X for 1 year
The total amount received is invested in company Y for 1 year in 2025
The interest rate of 2025 for Y is the same as 2024
Concept Used:
Simple interest (SI) = (P × R × T)/100
Where, P = principal amount, R = rate of interest, and T = time of investment
Calculation:
Amount received from X in 1 year = 100000 + (100000 × 8)/100 = Rs. 108000
Amount received from Y in 2025 = 108000 + (108000 × 15)/100 = Rs. 124200
∴ The correct answer is option 2
What is the difference between the total productions of the two Companies in the given years ?- a)19000
- b)22000
- c)26000
- d)28000
Correct answer is option 'C'. Can you explain this answer?
What is the difference between the total productions of the two Companies in the given years ?
a)
19000
b)
22000
c)
26000
d)
28000
|
|
Priya Reddy answered |
From the line-graph it is clear that the productions of Company X in the years 1997, 1998, 1999, 2000, 2001 and 2002 are 119000, 99000, 141000, 78000, 120000 and 159000 and those of Company Y are 139000, 120000,100000, 128000, 107000 and 148000 respectively.
Total production of Company X from 1997 to 2002
= 119000 + 99000 + 141000 + 78000 + 120000 + 159000
= 716000.
and total production of Company Y from 1997 to 2002
= 139000 + 120000 + 100000 + 128000 + 107000 + 148000
= 742000.
Difference = (742000 - 716000) = 26000.
The following line graph gives the ratio of the amounts of imports by a company to the amount of exports from that company over the period from 1995 to 2001.The imports were minimum proportionate to the exports of the company in the year ?- a)1995
- b)1996
- c)1997
- d)2000
Correct answer is option 'C'. Can you explain this answer?
The following line graph gives the ratio of the amounts of imports by a company to the amount of exports from that company over the period from 1995 to 2001.
The imports were minimum proportionate to the exports of the company in the year ?
a)
1995
b)
1996
c)
1997
d)
2000
|
|
Shreya Rane answered |
The imports are minimum proportionate to the exports implies that the ratio of the value of imports to exports has the minimum value.
Now, this ratio has a minimum value 0.35 in 1997, i.e., the imports are minimum proportionate to the exports in 1997.
Chapter doubts & questions for 3. Line Charts - IBPS Clerk Prelims 2024 Preparation 2024 is part of Bank Exams exam preparation. The chapters have been prepared according to the Bank Exams exam syllabus. The Chapter doubts & questions, notes, tests & MCQs are made for Bank Exams 2024 Exam. Find important definitions, questions, notes, meanings, examples, exercises, MCQs and online tests here.
Chapter doubts & questions of 3. Line Charts - IBPS Clerk Prelims 2024 Preparation in English & Hindi are available as part of Bank Exams exam.
Download more important topics, notes, lectures and mock test series for Bank Exams Exam by signing up for free.
IBPS Clerk Prelims 2024 Preparation
296 videos|297 docs|179 tests
|
Signup to see your scores go up within 7 days!
Study with 1000+ FREE Docs, Videos & Tests
10M+ students study on EduRev
|
© EduRev
|
Education Revolution
|


Follow Us
|


Signup to see your scores
go up within 7 days!
Access 1000+ FREE Docs, Videos and Tests
Takes less than 10 seconds to signup