


All questions of Signals & Systems for Electronics and Communication Engineering (ECE) Exam


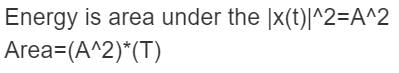
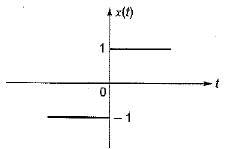
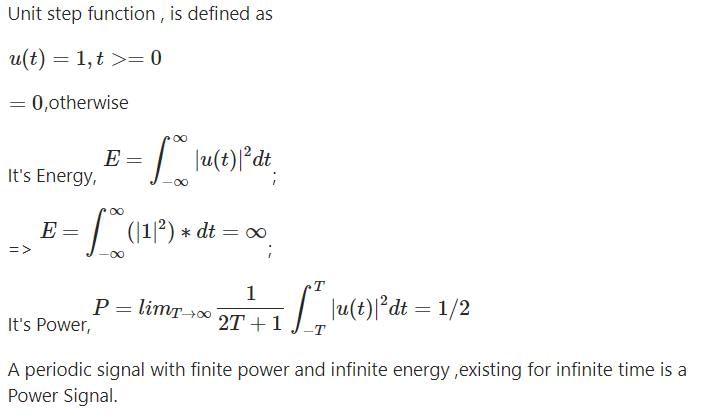
The function x(t) is shown in the figure. Even and odd parts of a unit step function u(t) are respectively
- a)

- b)

- c)

- d)

Correct answer is option 'A'. Can you explain this answer?
The function x(t) is shown in the figure. Even and odd parts of a unit step function u(t) are respectively
a)
b)
c)
d)

|
Crack Gate answered |
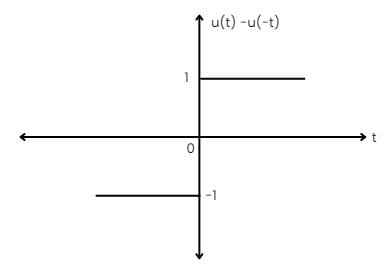
x(t) = u(t) - u(-t)
u(t) = 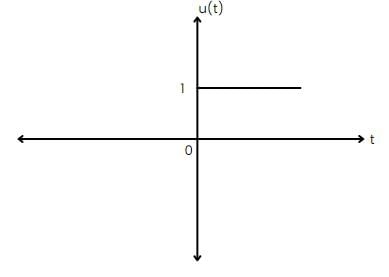
u(-t) =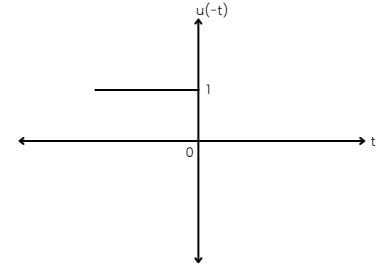
-u(-t) = 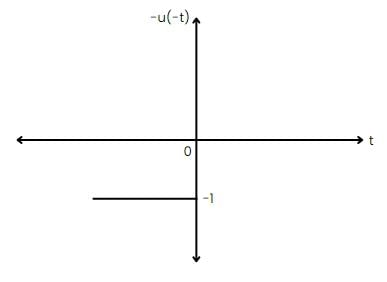
Hence,
x(t) = u(t) - u(-t)
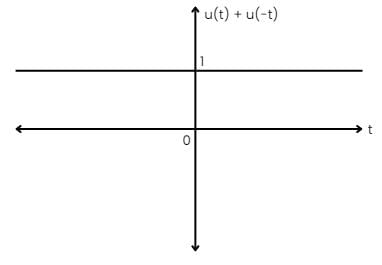
even part = [u(t) + u(-t)] / 2 = 1/2
odd part = [u(t) - u(-t)] / 2 = 1/2[x(t)]


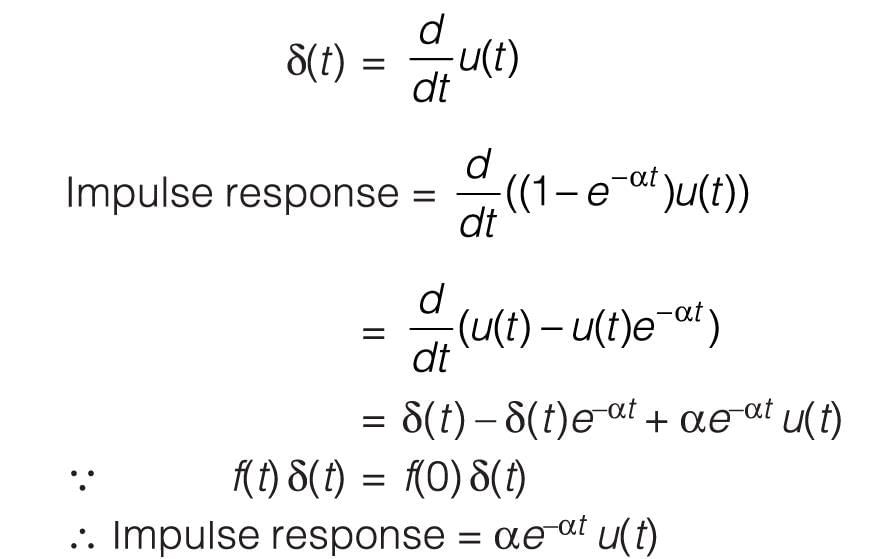
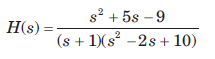
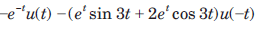
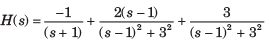
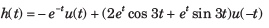
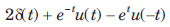
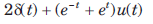
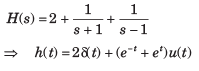
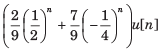
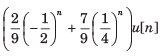
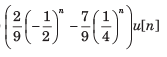
The transform function H(s) of a causal system is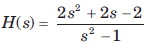 The impulse response is
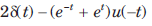
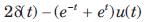
- a)
- b)
- c)
- d)
Correct answer is option 'D'. Can you explain this answer?
The transform function H(s) of a causal system is
The impulse response is
a)
b)
c)
d)
|
|
Rhea Reddy answered |
For a causal system h(t) = 0 for t < 0


 .
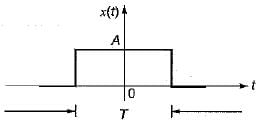
.The signal x(t) = A cos(ωt + φ) is- a)an energy signal
- b)a power signal
- c)an energy as well as a power signal
- d)neither an energy nor a power signal
Correct answer is option 'B'. Can you explain this answer?
The signal x(t) = A cos(ωt + φ) is
a)
an energy signal
b)
a power signal
c)
an energy as well as a power signal
d)
neither an energy nor a power signal
|
|
Avinash Sharma answered |
All bounded periodic signals are power signals, because they do not converge to a finite value so their energy is infinite and their power is finite.

If a function f(t) u(t) is shifted to the right side by t0, then the function can be expressed as- a)f(t - t0) u(t)
- b)f(t) u(t - t0)
- c)f(t - t0) u(t - t0)
- d)f(t + t0) u(t + t0)
Correct answer is option 'C'. Can you explain this answer?
If a function f(t) u(t) is shifted to the right side by t0, then the function can be expressed as
a)
f(t - t0) u(t)
b)
f(t) u(t - t0)
c)
f(t - t0) u(t - t0)
d)
f(t + t0) u(t + t0)
|
|
Swati Nambiar answered |
Explanation:
When a function f(t) u(t) is shifted to the right side by t0, it means that the function starts at t0 instead of t=0. Therefore, we need to shift the entire function to the right by t0.
Option A: f(t - t0) u(t)
This option shifts the function to the right by t0, but it still starts at t=0. Therefore, it is incorrect.
Option B: f(t) u(t -t0)
This option delays the function by t0, but it does not shift it to the right. Therefore, it is incorrect.
Option C: f(t - t0) u(t - t0)
This option shifts the entire function to the right by t0 and also delays it by t0. Therefore, it is the correct answer.
Option D: f(t + t0) u(t + t0)
This option shifts the entire function to the left by t0 instead of to the right. Therefore, it is incorrect.
In summary, the correct option for expressing a function f(t) u(t) shifted to the right side by t0 is f(t - t0) u(t - t0).
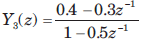
Figure I and Figure II, shows the input x(t) to a linear time invariant system and the impulse response h(t) of the system
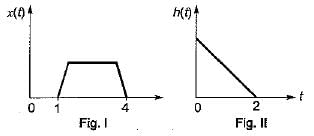
the output of the system is zero everywhere except for the time interval.- a)0 < t < 4
- b)1 < t < 6
- c)1 < t < 5
- d)0 < t < 5
Correct answer is option 'B'. Can you explain this answer?
Figure I and Figure II, shows the input x(t) to a linear time invariant system and the impulse response h(t) of the system
the output of the system is zero everywhere except for the time interval.
the output of the system is zero everywhere except for the time interval.
a)
0 < t < 4
b)
1 < t < 6
c)
1 < t < 5
d)
0 < t < 5

|
Gate Funda answered |
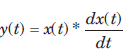
Given x(t) and h(t) y(t) = x(t) * h(t)
y(t) = ∞x(τ) h(t – τ)dτ– ∞
∞x(τ) h(t – τ)dτ– ∞Thus, we conclude that the output of the system is zero everywhere except for the time interval.
1 < t < 5
1 < t < 5

The fourier transform of a conjugate symmetric function is always- a)Imaginary
- b)Conjugate anti-symmetric
- c)Conjugate symmetric
- d)Real
Correct answer is option 'C'. Can you explain this answer?
The fourier transform of a conjugate symmetric function is always
a)
Imaginary
b)
Conjugate anti-symmetric
c)
Conjugate symmetric
d)
Real
|
|
Ravi Singh answered |
The correct answer is option (d) real
Explanation
In time domain, the nature of the signal is conjugate symmetric. Now, we have to find the nature of signal in frequency domain.
For example - Consider the duality property. Lets take a rectangle rect(t). Here sinc(f) is the forehead transform. According to the duality property, we can interchange these two, that is for sinc(t), the forehead transform will be rect (f).
In a similar manner, according to the standard definition, whenever signal is real, the forehead transform is conjugate symmetric. Now apply duality property on it, this means for conjugate symmetric function, the forehead transform is real.
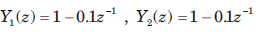
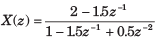
The transfer function of a system is given as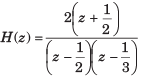 Consider the two statementsStatement(i) : System is causal and stable.
Statement(ii) : Inverse system is causal and stable.The correct option is- a)(i) is true
- b)(ii) is true
- c)Both (i) and (ii) are true
- d)Both are false
Correct answer is option 'C'. Can you explain this answer?
The transfer function of a system is given as
Consider the two statements
Statement(i) : System is causal and stable.
Statement(ii) : Inverse system is causal and stable.
Statement(ii) : Inverse system is causal and stable.
The correct option is
a)
(i) is true
b)
(ii) is true
c)
Both (i) and (ii) are true
d)
Both are false

|
Moumita Kulkarni answered |
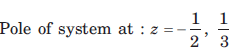
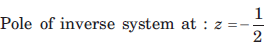
For this system and inverse system all poles are inside |z| = 1. So both system are both causal and stable.


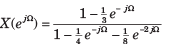
Let P be linearity, Q be time invariance, R be causality and S be stability. In question discrete time input x[n] and output y[n] relationship has been given. In the option properties of system has been given. Choose the option which match the properties for system.y[n] = nx[n]- a)P, Q, R, S
- b)Q, R, S
- c)P, R
- d)Q, S
Correct answer is option 'C'. Can you explain this answer?
Let P be linearity, Q be time invariance, R be causality and S be stability. In question discrete time input x[n] and output y[n] relationship has been given. In the option properties of system has been given. Choose the option which match the properties for system.
y[n] = nx[n]
a)
P, Q, R, S
b)
Q, R, S
c)
P, R
d)
Q, S

|
Anshu Kumar answered |
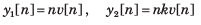
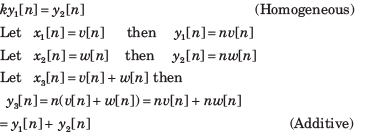
Since the system is homogeneous and additive, it is also linear.

At any discrete time, n = no the response depends only on the excitation at that same time. (Causal)
If the excitation is a constant, the response is unbounded as n approaches infinity. (Unstable)

The highest frequency component of a speech signal needed for telephonic communications is about 3.1 kHz. What is the suitable value for the sampling rate?- a)1 kHz
- b)2 kHz
- c)4 kHz
- d)8 kHz
Correct answer is option 'D'. Can you explain this answer?
The highest frequency component of a speech signal needed for telephonic communications is about 3.1 kHz. What is the suitable value for the sampling rate?
a)
1 kHz
b)
2 kHz
c)
4 kHz
d)
8 kHz
|
|
Sakshi Chauhan answered |
The Sampling Theorem
The sampling theorem states that in order to accurately reconstruct a continuous-time signal from its samples, the sampling rate must be at least twice the highest frequency component of the signal. This is known as the Nyquist rate.
In the case of telephonic communications, the highest frequency component of a speech signal is about 3.1 kHz. Therefore, to accurately capture and transmit the speech signal, the sampling rate must be at least twice this frequency, i.e., 2 * 3.1 kHz = 6.2 kHz.
Available Options
Let's evaluate the available options for the suitable value of the sampling rate:
a) 1 kHz: This sampling rate is below the Nyquist rate, as it is less than 6.2 kHz. Therefore, it is not suitable for accurately capturing the speech signal.
b) 2 kHz: Similar to option a), this sampling rate is also below the Nyquist rate and cannot accurately capture the speech signal.
c) 4 kHz: Again, this sampling rate is below the Nyquist rate and insufficient for accurately capturing the speech signal.
d) 8 kHz: This sampling rate is twice the highest frequency component of the speech signal (3.1 kHz * 2 = 6.2 kHz). Therefore, it satisfies the Nyquist rate and is suitable for accurately capturing the speech signal.
Conclusion
To accurately capture the highest frequency component of a speech signal for telephonic communications, a suitable value for the sampling rate is 8 kHz (option d). This sampling rate ensures that the signal is adequately sampled, allowing for faithful reconstruction during transmission and reception.
A function f(t) is an even function, if for all values of (t)( T is the time-period of the function)- a)f (t) = f ( t + T/2)
- b)f (t) = - f (t + T/2)
- c)f (t) = f (-t)
- d)f (t) = - f (-t)
Correct answer is option 'C'. Can you explain this answer?
A function f(t) is an even function, if for all values of (t)
( T is the time-period of the function)
a)
f (t) = f ( t + T/2)
b)
f (t) = - f (t + T/2)
c)
f (t) = f (-t)
d)
f (t) = - f (-t)
|
|
Sudhir Patel answered |
For even function, f(t) = f(-t)
For odd function, f(t) = -f(-t)
 is applied across a 2H inductor having zero initial current What is the current in the inductor at t = ∞?
A sinusoid x(t) of unknown frequency is sampled by an impulse train of period 20 ms. The resulting sample train is next applied to an ideal lowpass filter with cutoff at 25 Hz. The filter output is seen to be a sinusoid of frequency 20 Hz. This means that x(t) is- a)10 Hz
- b)60 Hz
- c)30 Hz
- d)90 Hz
Correct answer is option 'C'. Can you explain this answer?
A sinusoid x(t) of unknown frequency is sampled by an impulse train of period 20 ms. The resulting sample train is next applied to an ideal lowpass filter with cutoff at 25 Hz. The filter output is seen to be a sinusoid of frequency 20 Hz. This means that x(t) is
a)
10 Hz
b)
60 Hz
c)
30 Hz
d)
90 Hz

|
Uday Kumar answered |
Explanation:
- The sampling period is T=20ms. Therefore, the sampling frequency is fs=1/T=50 Hz.
- The ideal lowpass filter removes all frequency components above the cutoff frequency of 25 Hz.
- After passing the sample train through the ideal lowpass filter, the resulting signal has a frequency of 20 Hz.
- Let the frequency of the original sinusoid be f.
- According to the sampling theorem, the frequency of the sinusoid should be less than or equal to half the sampling frequency.
- Therefore, f <= fs/2="25" hz.="">
- Since the resulting signal after passing through the lowpass filter has a frequency of 20 Hz, the original sinusoid must have had a frequency of 20 Hz or less.
- Therefore, the frequency of the original sinusoid is 20 Hz or less.
- Hence, the correct answer is option C, 30 Hz.


A continuous-time signal has frequency content at f = 10 MHz, 50 MHz, and 70 MHz. The signal is sampled at a sampling frequency of 56 MHz and is then passed through a low-pass filter with a cutoff frequency of 15 MHz. The frequency content of the output of the filter will be:- a)10 MHz
- b)10 MHz and 6 MHz
- c)10 MHz, 6 MHz, and 14MHz
- d)46 MHz
Correct answer is option 'C'. Can you explain this answer?
A continuous-time signal has frequency content at f = 10 MHz, 50 MHz, and 70 MHz. The signal is sampled at a sampling frequency of 56 MHz and is then passed through a low-pass filter with a cutoff frequency of 15 MHz. The frequency content of the output of the filter will be:
a)
10 MHz
b)
10 MHz and 6 MHz
c)
10 MHz, 6 MHz, and 14MHz
d)
46 MHz

|
Ishani Chauhan answered |
Answer:
Frequency content of the continuous-time signal: 10 MHz, 50 MHz, and 70 MHz.
Sampling frequency: 56 MHz.
Low-pass filter cutoff frequency: 15 MHz.
Output frequency content after passing through the low-pass filter: 10 MHz, 6 MHz, and 14 MHz.
Explanation:
The Nyquist-Shannon sampling theorem states that a continuous-time signal can be perfectly reconstructed from its samples if the sampling frequency is greater than twice the highest frequency component of the signal. In this case, the highest frequency component of the signal is 70 MHz. Therefore, the sampling frequency of 56 MHz is sufficient to capture all the frequency content of the signal.
However, since the sampling frequency is less than twice the frequency of the highest component of the signal, aliasing can occur. Aliasing is the phenomenon where high-frequency components of the signal are folded back into the frequency band of the lower-frequency components.
To prevent aliasing, a low-pass filter is used to remove the high-frequency components of the signal before sampling. In this case, a low-pass filter with a cutoff frequency of 15 MHz is used.
The low-pass filter removes all frequency components above 15 MHz, including the 50 MHz and 70 MHz components of the original signal. The only frequency component that remains is the 10 MHz component.
However, since the original signal had frequency components at 10 MHz, 50 MHz, and 70 MHz, the low-pass filter output will also contain frequency components due to aliasing. These alias frequencies are given by:
- 2 × 56 MHz – 70 MHz = 42 MHz (alias of 70 MHz)
- 2 × 56 MHz – 50 MHz = 62 MHz (alias of 50 MHz)
Therefore, the frequency content of the output of the filter will be 10 MHz (due to the original 10 MHz component) and 6 MHz and 14 MHz (due to aliasing of the original 50 MHz and 70 MHz components, respectively). The correct answer is option 'C'.

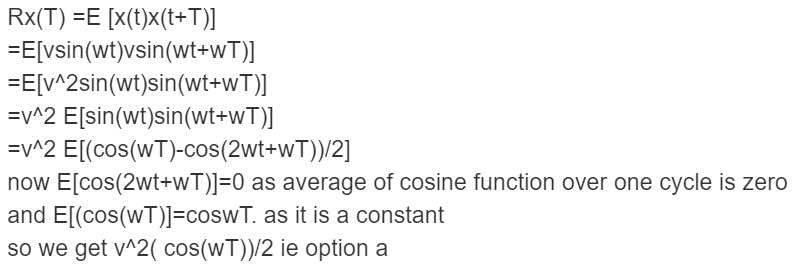
The auto-correlation function Rx(τ) satisfies which one of the following properties?- a)Rx(τ) = - Rx(-τ)
- b)Rx(τ) = Rx(-τ)
- c)Rx(τ) > - Rx(0)
- d)Rx(τ) > 1
Correct answer is option 'B'. Can you explain this answer?
The auto-correlation function Rx(τ) satisfies which one of the following properties?
a)
Rx(τ) = - Rx(-τ)
b)
Rx(τ) = Rx(-τ)
c)
Rx(τ) > - Rx(0)
d)
Rx(τ) > 1
|
|
Asha Roy answered |
T) is a mathematical function that describes how a signal or time series is correlated with itself at different time lags. It is defined as the expected value of the product of two time-shifted samples of a signal or time series, given by:
Rx(t) = E[X(t) X(t + τ)]
where X(t) is the signal or time series at time t, τ is the time lag, and E[·] denotes the expected value operator.
The auto-correlation function is a useful tool for analyzing the properties of time series data, such as their periodicity, stationarity, and spectral content. It can be used to estimate the power spectrum of a signal, which describes the distribution of its energy over different frequencies.
The auto-correlation function is related to the Fourier transform of the signal through the Wiener-Khinchin theorem, which states that the power spectral density of a stationary signal is the Fourier transform of its auto-correlation function.
In practice, the auto-correlation function is often estimated from a finite sample of data using statistical methods such as the sample auto-correlation function or the maximum likelihood estimator. These estimators are commonly used in time series analysis, signal processing, and statistical inference.
A system with an input x(t) and output y(t) is described by the relation: y(t) = tx(t). This system is- a)Linear and time-invariant,
- b)Linear and time varying.
- c)None-iinear and time invariant.
- d)Non-linear and time varying.
Correct answer is option 'B'. Can you explain this answer?
A system with an input x(t) and output y(t) is described by the relation: y(t) = tx(t). This system is
a)
Linear and time-invariant,
b)
Linear and time varying.
c)
None-iinear and time invariant.
d)
Non-linear and time varying.
|
|
Ruchi Kaur answered |
Explanation:
Linear systems satisfy the properties of superposition and homogeneity, whereas time-invariant systems have the same response for a given input, regardless of when the input is applied.
Let's analyze the given system:
y(t) = tx(t)
1. Superposition:
The system is not additive since it doesn't satisfy the superposition property. If we apply two inputs, say x1(t) and x2(t), then the output will be:
y1(t) = tx1(t) and y2(t) = tx2(t)
y1(t) + y2(t) = tx1(t) + tx2(t)
y1(t) + y2(t) ≠ t(x1(t) + x2(t))
Thus, the system is not linear.
2. Homogeneity:
The system satisfies the homogeneity property since applying a scalar value to the input results in a scaled output.
y(at) = atx(t) = a(tx(t))
Thus, the system is homogeneous.
3. Time-invariance:
The system is clearly time-varying because the output depends on the value of time t, which means the system's response changes with time.
Therefore, the system is linear and time-varying, which matches with option B.
Conclusion:
The system described by y(t) = tx(t) is linear and time-varying.
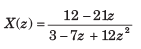
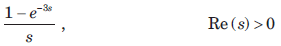
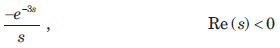
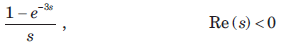
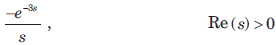
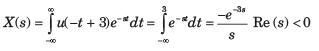
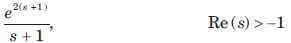
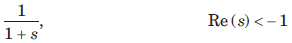
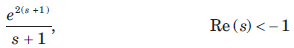
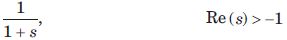
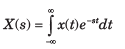
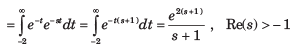
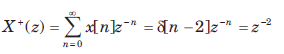
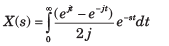
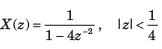
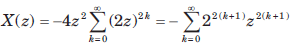
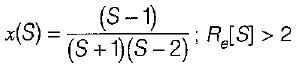
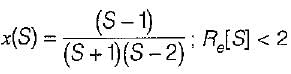
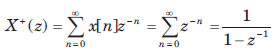
 find x(s) and its ROC:
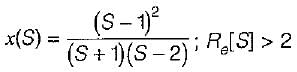

A single tone 4 kHz message signal is sampled with 9 kHz, 7 kHz and 5 kHz. Aliasing effect will be seen in the reconstructed signal, when the signal is sampled with- a)9 kHz
- b)any of 9 kHz, 7 kHz, or 5 kHz
- c)Both 9 kHz and 7 kHz
- d)Both 7 kHz and 5 kHz
Correct answer is option 'D'. Can you explain this answer?
A single tone 4 kHz message signal is sampled with 9 kHz, 7 kHz and 5 kHz. Aliasing effect will be seen in the reconstructed signal, when the signal is sampled with
a)
9 kHz
b)
any of 9 kHz, 7 kHz, or 5 kHz
c)
Both 9 kHz and 7 kHz
d)
Both 7 kHz and 5 kHz
|
|
Ojas Shahane answered |
Sampling and Aliasing
Sampling is the process of converting a continuous-time signal into a discrete-time signal by taking samples at regular intervals. The sampling rate determines how frequently the samples are taken, and it is usually expressed in samples per second or Hertz (Hz). Aliasing is a phenomenon that occurs when the sampling rate is not sufficient to accurately represent the original signal.
Aliasing Effect
The Nyquist-Shannon sampling theorem states that a signal must be sampled at a rate greater than or equal to twice the highest frequency component of the signal in order to avoid aliasing. If the sampling rate is not sufficient, the higher frequency components of the original signal will fold back into the lower frequency range, resulting in a distorted and unfaithful representation of the original signal.
Analysis of Sampling Rates
In this question, the message signal is a single tone with a frequency of 4 kHz. We are given three sampling rates: 9 kHz, 7 kHz, and 5 kHz. Let's analyze each sampling rate to determine if aliasing will occur.
1. Sampling rate of 9 kHz:
- The Nyquist-Shannon sampling rate for the 4 kHz signal is 8 kHz (twice the signal frequency).
- Since the sampling rate of 9 kHz is greater than the Nyquist rate, there will be no aliasing. The reconstructed signal will accurately represent the original signal.
2. Sampling rate of 7 kHz:
- The Nyquist-Shannon sampling rate for the 4 kHz signal is 8 kHz (twice the signal frequency).
- Since the sampling rate of 7 kHz is less than the Nyquist rate, aliasing will occur. The higher frequency components of the original signal will fold back into the lower frequency range, causing distortion in the reconstructed signal.
3. Sampling rate of 5 kHz:
- The Nyquist-Shannon sampling rate for the 4 kHz signal is 8 kHz (twice the signal frequency).
- Since the sampling rate of 5 kHz is less than the Nyquist rate, aliasing will occur. The higher frequency components of the original signal will fold back into the lower frequency range, causing distortion in the reconstructed signal.
Conclusion
Based on the analysis, we can conclude that aliasing will occur in the reconstructed signal when the signal is sampled at a rate of 7 kHz or 5 kHz. The sampling rate of 9 kHz is sufficient to avoid aliasing, and the reconstructed signal will accurately represent the original signal. Therefore, the correct answer is option 'D' - aliasing will occur when the signal is sampled at both 7 kHz and 5 kHz.
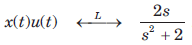
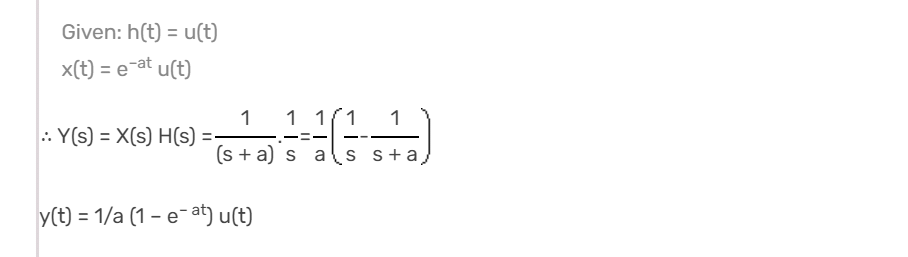
A control system transfer function is H(s) = 1/s3. Express its impulse response in terms of unit step signal- a)u(t) ⊗ u(t) ⊗ u(t); ⊗ denotes convolution
- b)u(t) ⊗ u(t) ⊗ u(t) ⊗ u(t); ⊗ denotes convolution
- c)u(t) × u(t) × u(t); × denotes multiplication
- d)u(t) ⊗ u(t); ⊗ denotes convolution
Correct answer is option 'A'. Can you explain this answer?
A control system transfer function is H(s) = 1/s3. Express its impulse response in terms of unit step signal
a)
u(t) ⊗ u(t) ⊗ u(t); ⊗ denotes convolution
b)
u(t) ⊗ u(t) ⊗ u(t) ⊗ u(t); ⊗ denotes convolution
c)
u(t) × u(t) × u(t); × denotes multiplication
d)
u(t) ⊗ u(t); ⊗ denotes convolution
|
|
Bijoy Menon answered |
Understanding the Transfer Function
The transfer function given is H(s) = 1/s^3. This represents a system with a third-order pole at the origin, indicating a specific response to inputs.
Impulse Response Calculation
To find the impulse response h(t), we need to take the inverse Laplace transform of H(s). The inverse transform of H(s) = 1/s^n is known to be:
- h(t) = (1/n!)*u(t) for n = 1, 2, 3, ...
For n = 3:
- h(t) = (1/3!)*u(t) = (1/6)*u(t).
This indicates that the impulse response h(t) is a scaled unit step function.
Connection with Convolution
The impulse response can also be expressed in terms of convolutions of unit step functions.
- Convolution of u(t) with itself n times yields the function that corresponds to the nth integral of the unit step function.
Thus, the impulse response can be expressed as:
- h(t) = u(t) ⊗ u(t) ⊗ u(t).
This is the convolution of three unit step functions, which is mathematically equivalent to the impulse response we derived.
Options Analysis
Now, analyzing the options given:
- Option A: u(t) ⊗ u(t) ⊗ u(t) - This is indeed the correct representation of the impulse response, as it corresponds to the convolution of three unit step functions.
- Option B: u(t) ⊗ u(t) ⊗ u(t) ⊗ u(t) - This would represent a fourth convolution and is not applicable here.
- Option C: u(t) × u(t) × u(t) - This denotes multiplication, which does not apply to our impulse response.
- Option D: u(t) ⊗ u(t) - This is only a second convolution and does not match the required order.
Thus, the correct answer is option A, as it accurately represents the impulse response derived from the transfer function.
The impulse response. h[n] of a linear time invariant system is given by h[n] = u[n + 3] + u[n - 3] - 2u[n - 7], the above system is- a)stable but not causal.
- b)stable and causal.
- c)causai but unstable.
- d)unstable and not causal.
Correct answer is option 'A'. Can you explain this answer?
The impulse response. h[n] of a linear time invariant system is given by h[n] = u[n + 3] + u[n - 3] - 2u[n - 7], the above system is
a)
stable but not causal.
b)
stable and causal.
c)
causai but unstable.
d)
unstable and not causal.
|
|
Keerthana Bajaj answered |
The given impulse response of a system
h[n] = u[n + 3] + u[n – 2] – 2u[n – 7]
The given system equation is non-causal for any value of n, since output depends upon the future input.
The given system is stable.
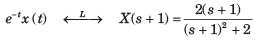
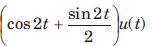
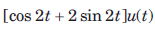
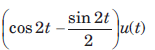
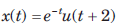
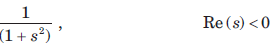
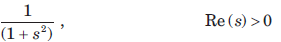
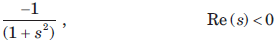
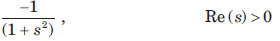
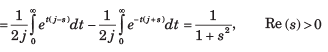
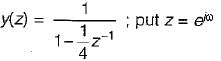
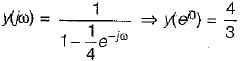
 If the Fourier transform of the signal exists, then x(t) is


Consider the signal x(t) = cos(6πt) + sin(8πt), where t is in seconds. The Nyquist sampling rate (in samples/second) for the signal y(t) = x(2t + 5) is- a)8
- b)12
- c)16
- d)32
Correct answer is option 'C'. Can you explain this answer?
Consider the signal x(t) = cos(6πt) + sin(8πt), where t is in seconds. The Nyquist sampling rate (in samples/second) for the signal y(t) = x(2t + 5) is
a)
8
b)
12
c)
16
d)
32

|
Om Pillai answered |
Πt) + 2cos(10πt)
1. What is the frequency of the first cosine term?
The frequency of the first cosine term is 6 Hz, which can be calculated as 6π/2π = 3 cycles per second.
2. What is the frequency of the second cosine term?
The frequency of the second cosine term is 10 Hz, which can be calculated as 10π/2π = 5 cycles per second.
3. What is the amplitude of the first cosine term?
The amplitude of the first cosine term is 1, as it has a coefficient of 1 in front of the cosine function.
4. What is the amplitude of the second cosine term?
The amplitude of the second cosine term is 2, as it has a coefficient of 2 in front of the cosine function.
5. What is the total amplitude of the signal x(t)?
The total amplitude of the signal x(t) is the sum of the amplitudes of each cosine term, which is 1 + 2 = 3.
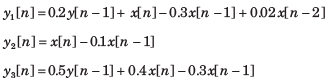
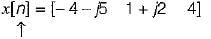
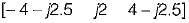
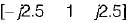
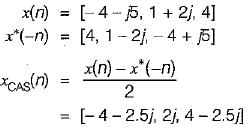
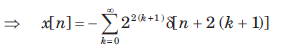
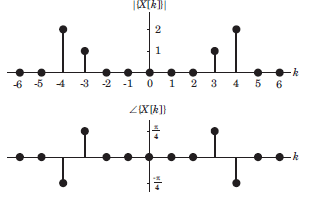
x[n] as shown in fig.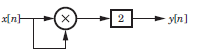
- a)P, Q, R, S
- b)Q, R, S
- c)P, Q
- d)R, S
Correct answer is option 'B'. Can you explain this answer?
x[n] as shown in fig.
a)
P, Q, R, S
b)
Q, R, S
c)
P, Q
d)
R, S
|
|
Devansh Dasgupta answered |
An delay system is a system whose output is same as the input, but after a delay.


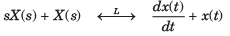
Unilateral Laplace Transform is applicable for the determination of linear constant coefficient differential equations with ________- a)Zero initial condition
- b)Non-zero initial condition
- c)Zero final condition
- d)Non-zero final condition
Correct answer is option 'B'. Can you explain this answer?
Unilateral Laplace Transform is applicable for the determination of linear constant coefficient differential equations with ________
a)
Zero initial condition
b)
Non-zero initial condition
c)
Zero final condition
d)
Non-zero final condition

|
Asha Nambiar answered |
Unilateral Laplace Transform for Constant Coefficient Differential Equations with Non-zero Initial Condition
Unilateral Laplace Transform is a mathematical tool used to solve linear constant coefficient differential equations. It is particularly useful in solving differential equations with non-zero initial conditions. Let us discuss in detail the application of Unilateral Laplace Transform for constant coefficient differential equations with a non-zero initial condition.
Constant Coefficient Differential Equations
A constant coefficient differential equation is a differential equation in which the coefficients are constant. These types of differential equations are commonly found in physics and engineering. Examples of constant coefficient differential equations include the following:
- d^2y/dt^2 + 3dy/dt + 2y = 0
- d^2y/dt^2 + 2dy/dt + 2y = f(t)
Unilateral Laplace Transform
Unilateral Laplace Transform is a mathematical tool used to solve linear constant coefficient differential equations. It is defined as follows:
L{f(t)} = F(s) = ∫0∞ e^-st f(t) dt
where L denotes the Laplace transform, f(t) is the function to be transformed, s is the complex variable, and F(s) is the Laplace transform of f(t). The Laplace transform is a powerful tool that can be used to solve differential equations.
Application of Unilateral Laplace Transform for Constant Coefficient Differential Equations with Non-zero Initial Condition
The Unilateral Laplace Transform can be used to solve constant coefficient differential equations with non-zero initial conditions. The general process involves the following steps:
- Take the Laplace transform of both sides of the differential equation.
- Solve for the Laplace transform of the dependent variable.
- Take the inverse Laplace transform to find the solution to the original differential equation.
For example, consider the following differential equation:
d^2y/dt^2 + 2dy/dt + 2y = 0, y(0) = 1, dy/dt(0) = 0
Taking the Laplace transform of both sides of the differential equation, we get:
s^2Y(s) - s + 2sY(s) + 2Y(s) = Y(0) + sdy/dt(0) + 2y(0)
Simplifying this equation, we get:
Y(s) = (s+1)/(s^2 + 2s + 2)
Taking the inverse Laplace transform, we get:
y(t) = e^-t(cos(t) - sin(t))
Thus, we have solved the differential equation with non-zero initial conditions using the Unilateral Laplace Transform.
Conclusion
In conclusion, the Unilateral Laplace Transform is a powerful tool that can be used to solve constant coefficient differential equations with non-zero initial conditions. By taking the Laplace transform of the differential equation, solving for the Laplace transform of the dependent variable, and taking the inverse Laplace transform, we can find the solution to the original differential equation.
Chapter doubts & questions for Signals & Systems - GATE ECE (Electronics) Mock Test Series 2026 2025 is part of Electronics and Communication Engineering (ECE) exam preparation. The chapters have been prepared according to the Electronics and Communication Engineering (ECE) exam syllabus. The Chapter doubts & questions, notes, tests & MCQs are made for Electronics and Communication Engineering (ECE) 2025 Exam. Find important definitions, questions, notes, meanings, examples, exercises, MCQs and online tests here.
Chapter doubts & questions of Signals & Systems - GATE ECE (Electronics) Mock Test Series 2026 in English & Hindi are available as part of Electronics and Communication Engineering (ECE) exam.
Download more important topics, notes, lectures and mock test series for Electronics and Communication Engineering (ECE) Exam by signing up for free.
GATE ECE (Electronics) Mock Test Series 2026
26 docs|263 tests
|
|
© EduRev
|
Education Revolution
|


|


Signup to see your scores
go up
within 7 days!
within 7 days!
Takes less than 10 seconds to signup