


All Exams >
IIT JAM >
IIT JAM Past Year Papers and Model Test Paper (All Branches) >
All Questions
All questions of Mathematical Statistics - MS for IIT JAM Exam


The differential equation 2ydx – (3y – 2x)dy = 0 is- a)exact and homogeneous but not linear
- b)homogeneous and linear but not exact
- c)exact and linear but not homogeneous
- d)exact, homogeneous and linear
Correct answer is option 'A'. Can you explain this answer?
The differential equation 2ydx – (3y – 2x)dy = 0 is
a)
exact and homogeneous but not linear
b)
homogeneous and linear but not exact
c)
exact and linear but not homogeneous
d)
exact, homogeneous and linear

|
Srishti Khanna answered |
2ydx + (2x – 3y)dy = 0 ...(1)
It is Homogeneous
M = 2y


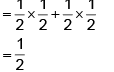
Suppose that a netball player has a probability of 1/2 of scoring a goal each time. What is the
probability that she will score one goal from her first two attempts ?
Correct answer is '0.5'. Can you explain this answer?
Suppose that a netball player has a probability of 1/2 of scoring a goal each time. What is the
probability that she will score one goal from her first two attempts ?
probability that she will score one goal from her first two attempts ?
|
|
Pooja Choudhury answered |
If the player scores one goal from her first two attempts, then the sequence of events could be either a goal first (G) followed by a miss (M) or a miss first (M) followed by a goal (G). Thus : Pr(one goal from first two attempts) = Pr(GM) + Pr(MG)
Which of the following statements holds in (0, 2) if the function y = In (3x4 – 2x3 – 6x2 + 6x + 1)- a)Maximum of y is In(39/16)
- b)f has neither maximum nor minimum (0, 2)
- c)f has maximum but not minimum in (0, 2)
- d)minimum value of y is in 2
Correct answer is option 'A,D'. Can you explain this answer?
Which of the following statements holds in (0, 2) if the function y = In (3x4 – 2x3 – 6x2 + 6x + 1)
a)
Maximum of y is In(39/16)
b)
f has neither maximum nor minimum (0, 2)
c)
f has maximum but not minimum in (0, 2)
d)
minimum value of y is in 2

|
Sparsh Menon answered |

Now for maximum or minimum of z, dz/dx = 0
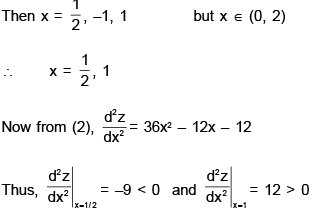
Therefore z is maximum and minimum at x = 1/2 and x = 1 respectively
Hence y is also maximum and minimum at x = 1/2 and x = 1 respectively..
Maximum value of y is  and minimum value of y is
In(3 – 2 – 6 + 6 + 1) i.e., In 2
and minimum value of y isIn(3 – 2 – 6 + 6 + 1) i.e., In 2
Consider the function f (x, y) = x3 − 3xy2, x,y ∈ ℝ. Which one of the following statements is TRUE?- a)f has a local minimum at (0, 0)
- b)f has a local maximum at (0, 0)
- c)f has global maximum at (0, 0)
- d)f has a saddle point at (0, 0)
Correct answer is option 'D'. Can you explain this answer?
Consider the function f (x, y) = x3 − 3xy2, x,y ∈ ℝ. Which one of the following statements is TRUE?
a)
f has a local minimum at (0, 0)
b)
f has a local maximum at (0, 0)
c)
f has global maximum at (0, 0)
d)
f has a saddle point at (0, 0)

|
Sai Sai answered |
A
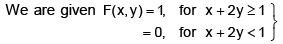
Let F(x, y) be the d.f. of X and Yif : F(x, y) = 1, for x + 2y ≥ 1F(x, y) = 0, for x + 2y < 1,
then- a)F(x, y) can be joint distribution function of variables X and Y
- b)F(x, y) cannot be joint distribution function of variables X and Y
- c)F(x, y) cannot be marginal distribution function of variables X and Y
- d)None of the above
Correct answer is option 'B'. Can you explain this answer?
Let F(x, y) be the d.f. of X and Y
if : F(x, y) = 1, for x + 2y ≥ 1
F(x, y) = 0, for x + 2y < 1,
then
then
a)
F(x, y) can be joint distribution function of variables X and Y
b)
F(x, y) cannot be joint distribution function of variables X and Y
c)
F(x, y) cannot be marginal distribution function of variables X and Y
d)
None of the above
|
|
Yash Roy answered |
Let us define the events :

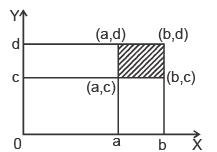
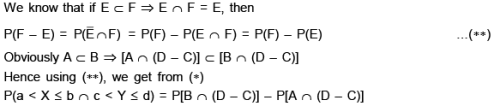
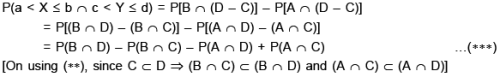
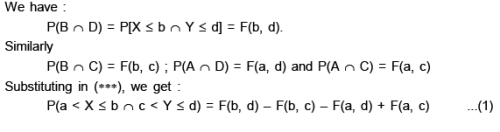
In (1) let us take : a = 0, b = 1/2, ; c = 1/4, d = 3/4 s.t. a < b and c < d. Then using (2) we get :
F(b, d) = 1 ; F(b, c) = 1 ; F(a, d) = 1 ; F(a, c) = 0.
Substituting in (1) we get :
P(a < X ≤ b ∩ c < Y < d) =1 – 1 – 1 + 0 = –1
which is not possible since P( . ) ³ 0.
Hence F(x, y) defined in (2) cannot be the distribution function of variates X and Y.
Hence F(x, y) defined in (2) cannot be the distribution function of variates X and Y.


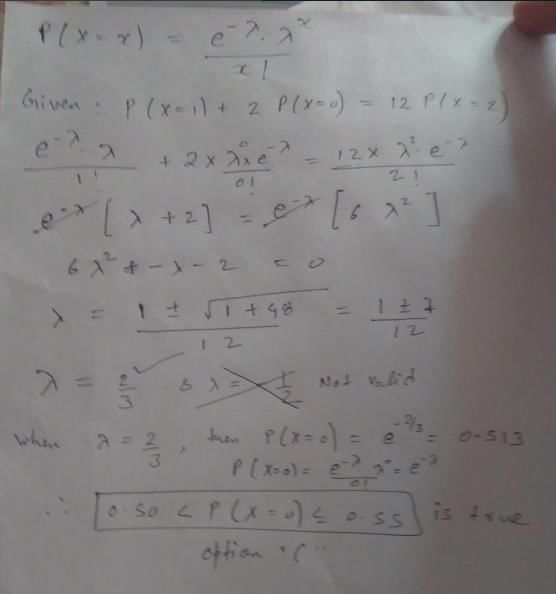
- a)4
- b)6
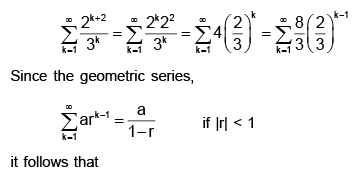
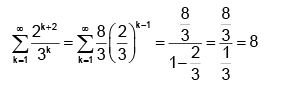
- c)8
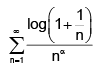
- d)infinity
Correct answer is option 'C'. Can you explain this answer?
a)
4
b)
6
c)
8
d)
infinity
|
|
Aashna Shah answered |
The above infinite series can be rewritten as follows,
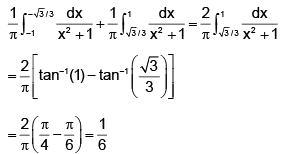
Let X1, X2 and X3 be i.i.d. U(0,1) random variables. Then P(X1 > X2 + X3) equals- a)1/6
- b)1/4
- c)1/3
- d)1/2
Correct answer is option 'A'. Can you explain this answer?
Let X1, X2 and X3 be i.i.d. U(0,1) random variables. Then P(X1 > X2 + X3) equals
a)
1/6
b)
1/4
c)
1/3
d)
1/2
|
|
Varun Yadav answered |
To find P(X1 < x2="" />< x3),="" we="" need="" to="" find="" the="" probability="" that="" x1="" is="" less="" than="" x2="" and="" x3="" is="" greater="" than="" />
Let's break down the problem into two parts:
1. P(X1 < />
Since X1 and X2 are independent and uniformly distributed between 0 and 1, the probability of X1 being less than X2 is 0.5.
2. P(X3 > X2)
Since X2 and X3 are independent and uniformly distributed between 0 and 1, the probability of X3 being greater than X2 is also 0.5.
Since these two events are independent, we can multiply the probabilities to get the final probability:
P(X1 < x2="" />< x3)="P(X1" />< x2)="" *="" p(x3="" /> X2) = 0.5 * 0.5 = 0.25.
Therefore, the probability that X1 is less than X2 and X3 is greater than X2 is 0.25.
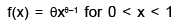
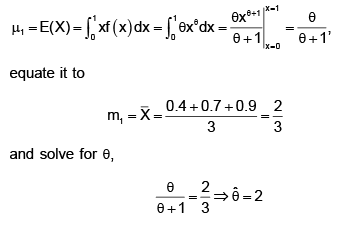
In a colony all families have at least one child. The probability that a randomly chosen family from this colony has exactly k children is (0.5)k ; k = 1, 2,K . A child is either a male or a female with equal probability. The probability that such a family consists of at least one male child and at least one female child is _________
Correct answer is '0.3 to 0.4'. Can you explain this answer?
In a colony all families have at least one child. The probability that a randomly chosen family from this colony has exactly k children is (0.5)k ; k = 1, 2,K . A child is either a male or a female with equal probability. The probability that such a family consists of at least one male child and at least one female child is _________
|
|
Ishaan Kapoor answered |
The probability that a randomly chosen family from this colony has exactly k children is given by (0.5)^k, where k = 1, 2, K.
To find the probability that such a family consists of at least one male child and at least one female child, we need to consider two cases:
Case 1: Only one child in the family
Since a family must have at least one child, the probability of having exactly one child is 1. In this case, the probability of having both a male and a female child is 0.5 * 0.5 = 0.25.
Case 2: More than one child in the family
In this case, we need to find the probability of having at least one male child and at least one female child among the k children.
To do this, we can find the probability of the complementary event, which is having either all male or all female children.
The probability of having all male children is (0.5)^k, and the probability of having all female children is also (0.5)^k.
So, the probability of having either all male or all female children is 2 * (0.5)^k.
Therefore, the probability of having at least one male and at least one female child among the k children is 1 - 2 * (0.5)^k.
To find the overall probability, we need to consider both cases.
The probability of having exactly one child is 1, and the probability of having both a male and a female child is 0.25.
So, the overall probability is 1 * 0.25 + (1 - 0.25) * (1 - 2 * (0.5)^k).
Simplifying this expression, we get 0.25 + (1 - 0.25) * (1 - 2 * (0.5)^k) = 0.25 + 0.75 * (1 - 2 * (0.5)^k).
Since the given answer is '0.3 to 0.4', we can infer that the value of 0.25 + 0.75 * (1 - 2 * (0.5)^k) lies within this range for k = 1, 2, K.
Let m > 1. The volume of the solid generated by revolving the region between the y-axis and the curve xy = 4, 1 < y < m, about the y-axis is 15π. The value of m is - a) 14
- b) 15
- c) 16
- d) 17
Correct answer is option 'C'. Can you explain this answer?
Let m > 1. The volume of the solid generated by revolving the region between the y-axis and the curve xy = 4, 1 < y < m, about the y-axis is 15π. The value of m is
a)
14
b)
15
c)
16
d)
17
|
|
Pari Sinha answered |
Given:
The volume of the solid generated by revolving the region between the y-axis and the curve xy = 4, 1 ≤ y ≤ m, about the y-axis is 15.
To Find:
The value of m.
Solution:
To find the value of m, we need to find the limits of integration for the integral that represents the volume of the solid.
Step 1: Finding the limits of integration
The curve xy = 4 can be rewritten as x = 4/y.
When y = 1, x = 4/1 = 4. So the lower limit of integration is x = 4.
Let's find the upper limit of integration by setting the volume equal to 15 and solving for m:
V = π∫[x=4 to x=m] (4/y)^2 dx = 15
Simplifying the integral:
V = π∫[x=4 to x=m] 16/y^2 dx = 15
Dividing both sides of the equation by π:
∫[x=4 to x=m] 16/y^2 dx = 15/π
Integrating the left side of the equation:
-16/y = 15/π * (x - 4) + C
Since we are revolving the region between the y-axis and the curve about the y-axis, we are interested in the positive values of x.
When x = m, y = m/4. Substituting these values into the equation:
-16/(m/4) = 15/π * (m - 4) + C
Simplifying:
-64/m = 15/π * (m - 4) + C
Solving for C:
C = -64/m - 15/π * (m - 4)
Step 2: Evaluating the limits of integration
To find the upper limit of integration, we substitute x = m into the equation:
-16/y = 15/π * (m - 4) + C
Substituting y = m/4:
-64/m = 15/π * (m - 4) + C
Since C = -64/m - 15/π * (m - 4), we can substitute this into the equation:
-64/m = 15/π * (m - 4) - 64/m - 15/π * (m - 4)
Simplifying:
0 = 30/π * (m - 4) - 128/m
Multiplying both sides by πm:
0 = 30m - 120 - 128π
Rearranging the terms:
30m = 120 + 128π
m = (120 + 128π)/30
Step 3: Simplifying the answer
To determine the value of m, we can simplify the expression (120 + 128π)/30:
m = 4 + (128/30)π
Comparing this expression with the given answer choices, we find that the value of m is 16 (option C).
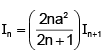
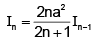
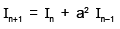
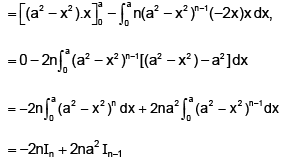
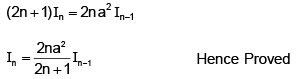
 Integration by Parts results in
- a)
- b)
- c)
- d)
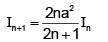
Correct answer is option 'B'. Can you explain this answer?
Integration by Parts results ina)
b)
c)
d)
|
|
Niti Mukherjee answered |
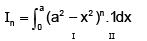
Integration by parts
or
What should be the value of z used in a 93% confidence interval?- a)1.81
- b)1.86
- c)1.88
- d)Infinity
Correct answer is option 'A'. Can you explain this answer?
What should be the value of z used in a 93% confidence interval?
a)
1.81
b)
1.86
c)
1.88
d)
Infinity
|
|
Aisha Sharma answered |
The value of z used in a confidence interval depends on the desired level of confidence. In this case, the confidence level is given as 93%.
1. Determining the Confidence Level:
The confidence level is the probability that the true population parameter lies within the confidence interval. In this case, the confidence level is 93%.
2. Finding the Critical Value:
To find the critical value of z for a given confidence level, we need to look up the corresponding value in the standard normal distribution table. The z-value represents the number of standard deviations away from the mean.
3. Using the Standard Normal Distribution Table:
Looking up the z-value for a 93% confidence level in the standard normal distribution table, we find that the z-value is approximately 1.81.
4. Choosing the Correct Option:
Comparing the calculated z-value of 1.81 with the given options, we can see that option 'A' is the only one that matches.
Therefore, the correct answer is option 'A' (1.81).
The z-value represents the number of standard deviations away from the mean and is used to calculate the margin of error in a confidence interval. A larger z-value corresponds to a wider confidence interval, indicating a lower level of precision in estimating the population parameter.
By using the calculated z-value of 1.81, we can construct a 93% confidence interval by taking the sample mean and adding/subtracting the margin of error determined by the z-value.
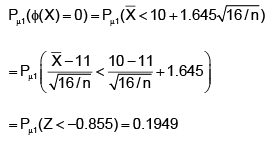
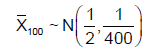
A waiter believes that his tips from various customers have a slightly right skewed distribution with a mean of 10 dollars and a standard deviation of 2.50 dollars. What is the probability that the average of 35 customers will be more than 13 dollars?
Correct answer is '0'. Can you explain this answer?
A waiter believes that his tips from various customers have a slightly right skewed distribution with a mean of 10 dollars and a standard deviation of 2.50 dollars. What is the probability that the average of 35 customers will be more than 13 dollars?
|
|
Ananya Singh answered |
Understanding the Problem:
The problem states that a waiter believes his tips from various customers have a slightly right-skewed distribution with a mean of $10 and a standard deviation of $2.50. We are asked to find the probability that the average tip from a sample of 35 customers will be more than $13.
Key Concepts:
To solve this problem, we need to understand the concept of sampling distribution, specifically the distribution of sample means.
- Sampling Distribution: It refers to the distribution of a statistic (such as mean or standard deviation) calculated from multiple samples of the same size taken from a population.
- Central Limit Theorem (CLT): According to the CLT, the sampling distribution of the sample means approaches a normal distribution, regardless of the shape of the population distribution, as the sample size increases.
- Z-Score: A z-score measures the number of standard deviations an individual value or sample mean is from the population mean.
Calculating the Probability:
To find the probability that the average of 35 customers will be more than $13, we can use the Z-score formula and the properties of the sampling distribution.
1. Calculate the standard error of the mean:
The standard error (SE) of the mean is calculated by dividing the population standard deviation by the square root of the sample size.
SE = σ / √n
Here, σ (population standard deviation) = $2.50 and n (sample size) = 35.
SE = $2.50 / √35
2. Calculate the Z-score:
The Z-score is calculated by subtracting the population mean from the sample mean and dividing it by the standard error of the mean.
Z = (sample mean - population mean) / SE
Here, the sample mean is $13, and the population mean is $10.
Z = ($13 - $10) / SE
3. Find the probability:
Using the Z-score calculated in the previous step, we can find the probability using a standard normal distribution table or a calculator.
However, in this case, since the Z-score is quite large (greater than 3), the tail probability is extremely close to 0.
Conclusion:
The probability that the average of 35 customers will be more than $13 is essentially 0. This means that it is highly unlikely for the average tip from 35 customers to exceed $13, given the distribution and parameters provided.
Let P be a 3 × 3 non-null real matrix. If there exist a 3 × 2 real matrix Q and a 2 × 3 real matrix R such that P = QR, then- a) Px = 0 has a unique solution, where 0 ∈ ℝ3
- b) there exists b ∈ ℝ3 such that Px = b has no solution
- c) there exists a non-zero b ∈ ℝ3 such that Px = b has a unique solution
- d) there exists a non-zero b ∈ ℝ3 such that PT x = b has a unique solution
Correct answer is option 'B'. Can you explain this answer?
Let P be a 3 × 3 non-null real matrix. If there exist a 3 × 2 real matrix Q and a 2 × 3 real matrix R such that P = QR, then
a)
Px = 0 has a unique solution, where 0 ∈ ℝ3
b)
there exists b ∈ ℝ3 such that Px = b has no solution
c)
there exists a non-zero b ∈ ℝ3 such that Px = b has a unique solution
d)
there exists a non-zero b ∈ ℝ3 such that PT x = b has a unique solution
|
|
Ishani Dasgupta answered |
It seems like the question is incomplete. Please provide more information.
A symmetric die is thrown 600 times. Find the lower hound for the probability of getting 80 to 120 sixes.- a)19/20
- b)19/23
- c)19/24
- d)24/19
Correct answer is option 'C'. Can you explain this answer?
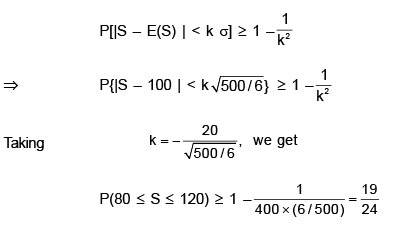
A symmetric die is thrown 600 times. Find the lower hound for the probability of getting 80 to 120 sixes.
a)
19/20
b)
19/23
c)
19/24
d)
24/19
|
|
Anisha Banerjee answered |
Let S be total number of successes.
Then
Then
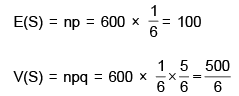
Using Chebychev’s inequality, we get
Let X and Y be two independent random variables such that X ~ U(0, 2) and Y ~ U(1, 3).Then P(X < Y) equals- a)1/2
- b)3/4
- c)7/8
- d)1
Correct answer is option 'C'. Can you explain this answer?
Let X and Y be two independent random variables such that X ~ U(0, 2) and Y ~ U(1, 3).Then P(X < Y) equals
a)
1/2
b)
3/4
c)
7/8
d)
1
|
|
Mahek Rana answered |
To find P(X > Y), we need to determine the range of values for X and Y that satisfy this condition.
- The random variable X is uniformly distributed between 0 and 2, which means it can take any value between 0 and 2 with equal probability.
- The random variable Y is uniformly distributed between 1 and 3, which means it can take any value between 1 and 3 with equal probability.
Comparing the ranges of X and Y, we can see that X will always be less than Y.
So, P(X > Y) = 0.
This means that the probability of X being greater than Y is zero.
Hence, the correct answer is option 'C' - 7/8.
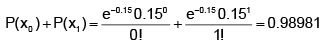
If electricity power failures occur according to a Poisson distribution with an average of 3 failures every twenty weeks,calculate the probability that there will not be more than one failure during a particular week.
Correct answer is '0.98981'. Can you explain this answer?
If electricity power failures occur according to a Poisson distribution with an average of 3 failures every twenty weeks,calculate the probability that there will not be more than one failure during a particular week.
|
|
Jay Nambiar answered |
The average number of failures per week is 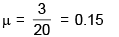
“Not more than one failure” means we need to include the probabilities for “0 failures” plus “1 failure”.
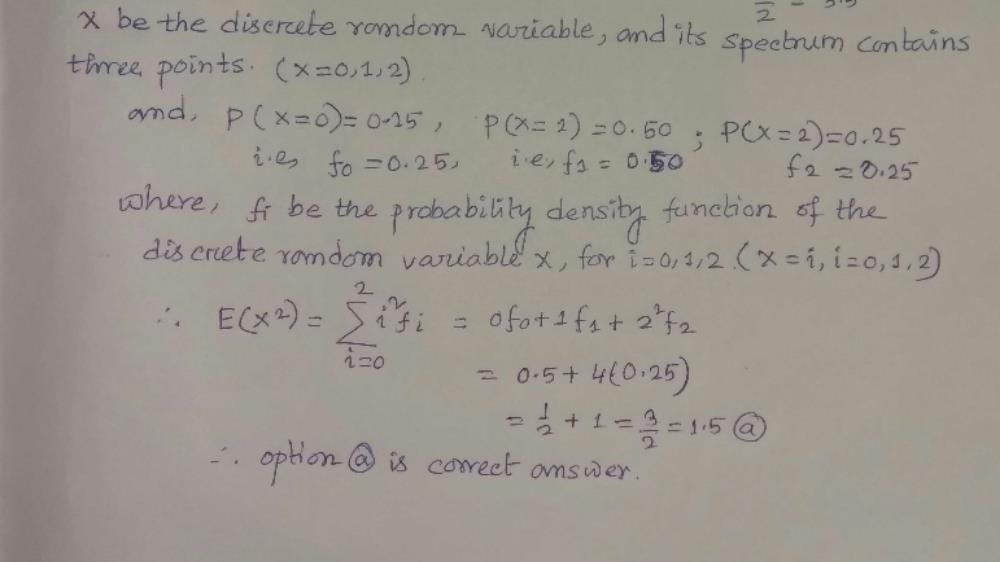
An examination paper has 150 multiple- choice questions of one mark each, with each question having four choice. Each incorrect answer fetches- 0.25 mark. Suppose 1000 students choose all their answers randomly with uniform probability. The sum total of the expected marks obtained by all these students is :- a)0
- b)2550
- c)7525
- d)9375
Correct answer is option 'D'. Can you explain this answer?
An examination paper has 150 multiple- choice questions of one mark each, with each question having four choice. Each incorrect answer fetches- 0.25 mark. Suppose 1000 students choose all their answers randomly with uniform probability. The sum total of the expected marks obtained by all these students is :
a)
0
b)
2550
c)
7525
d)
9375
|
|
Qadir Khan answered |
Understanding the Problem:
- There is an examination paper with 150 multiple-choice questions.
- Each question has four choices, and each question is worth one mark.
- For each incorrect answer, 0.25 marks are deducted.
- 1000 students choose their answers randomly with a uniform probability.
- We need to find the sum total of the expected marks obtained by all these students.
Solution:
To solve this problem, we will break it down into smaller steps:
Step 1: Calculate the probability of getting a question right or wrong:
Since each question has four choices, the probability of getting a question right is 1/4, and the probability of getting it wrong is 3/4.
Step 2: Calculate the expected marks for each question:
The expected marks for each question can be calculated by multiplying the probability of getting it right by 1 and the probability of getting it wrong by -0.25.
Expected marks = (1/4 * 1) + (3/4 * -0.25) = 0.25 - 0.1875 = 0.0625
Step 3: Calculate the expected marks for all 150 questions:
Since each question is worth one mark, the expected marks for all 150 questions will be 150 * 0.0625 = 9.375.
Step 4: Calculate the sum total of expected marks for all 1000 students:
Since each student chooses their answers randomly, the expected marks for each student will be the same, which is 9.375.
Therefore, the sum total of expected marks for all 1000 students will be 1000 * 9.375 = 9375.
Therefore, the correct answer is option 'D' - 9375.
If the probability that A and B will die within a year are p and q respectively, then the probability that only one of them will be alive at the end of the year is- a)p + q
- b)p + q – 2pq
- c)p + q – pq
- d)p + q + PQ
Correct answer is option 'B'. Can you explain this answer?
If the probability that A and B will die within a year are p and q respectively, then the probability that only one of them will be alive at the end of the year is
a)
p + q
b)
p + q – 2pq
c)
p + q – pq
d)
p + q + PQ
|
|
Anisha Pillai answered |
Ans.
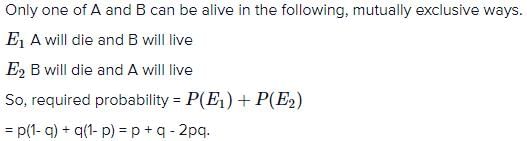
Option (b)
Let an be a sequence such that a1 = a, a2 = b and an = (a + an–1)/2 for n > 2. Calculate the limit?- a)b
- b)(a + b)/2
- c)a
- d)a + b
Correct answer is option 'C'. Can you explain this answer?
Let an be a sequence such that a1 = a, a2 = b and an = (a + an–1)/2 for n > 2. Calculate the limit?
a)
b
b)
(a + b)/2
c)
a
d)
a + b
|
|
Eshan Mehta answered |
To find the limit of the sequence an, we need to analyze the behavior of the sequence as n approaches infinity. Let's break down the steps to calculate the limit.
Step 1: Write out the terms of the sequence to observe a pattern.
Given: a1 = a, a2 = b, and an = (a + an-1)/2 for n ≥ 2.
The terms of the sequence are:
a1 = a
a2 = b
a3 = (a + b)/2
a4 = (a + (a + b)/2)/2
a5 = (a + (a + (a + b)/2)/2)/2
We can see a pattern emerging as we calculate more terms.
Step 2: Observe the pattern and make a conjecture.
Looking at the terms of the sequence, we can see that each term is calculated by taking the average of the previous term and a constant value. In this case, the constant value is a.
We can conjecture that as n approaches infinity, the terms of the sequence will approach the average of the previous term and the constant value a.
Step 3: Prove the conjecture.
To prove the conjecture, we can use mathematical induction.
Base case: For n = 2, we have a2 = b. This is consistent with the conjecture.
Inductive step: Assume that the conjecture holds for some n = k, i.e., ak = (a + ak-1)/2. We need to show that it also holds for n = k + 1, i.e., ak+1 = (a + ak)/2.
Using the assumption, we can substitute ak-1 = (a + ak)/2 into the expression for ak+1 to get:
ak+1 = (a + (a + ak)/2)/2
= (2a + a + ak)/4
= (a + ak)/2
This proves that the conjecture holds for n = k + 1.
Step 4: Calculate the limit.
Since the conjecture holds for all n, as n approaches infinity, the terms of the sequence will approach the average of the previous term and the constant value a.
Therefore, the limit of the sequence an is (a + b)/2.
Hence, the correct answer is option 'C' - (a + b)/2.

In the integral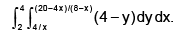 change the order of integration, and evaluate the integral.
Correct answer is '7.18'. Can you explain this answer?
In the integral
change the order of integration, and evaluate the integral.
|
|
Nirmal Ghorai answered |
Very easy. first do the integration y keep x as a constant and then do the integration x by elementary rule.
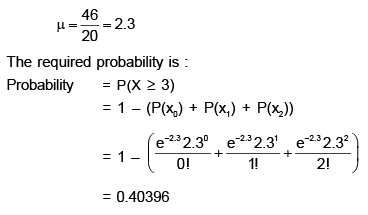
Twenty sheets of aluminum alloy were examined for surface flaws. The frequency of the number of sheets with a given number of flaws per sheet was as follows :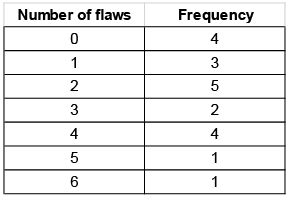 What is the probability of finding a sheet chosen at random which contains 3 or more surface flaws?
Correct answer is '0.40396'. Can you explain this answer?
Twenty sheets of aluminum alloy were examined for surface flaws. The frequency of the number of sheets with a given number of flaws per sheet was as follows :
What is the probability of finding a sheet chosen at random which contains 3 or more surface flaws?
|
|
Anagha Chauhan answered |
The total number of flaws is given by: (0 × 4) + (1 × 3) + (2 × 5) + (3 × 2) + (4 × 4) + (5 × 1) + (6 × 1) = 46
So the average number of flaws for the 20 sheets is given by:
So the average number of flaws for the 20 sheets is given by:
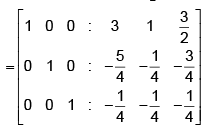
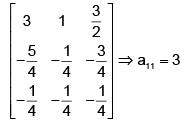
Using the Gauss- Jorden reduction method, if we find the inverse of the matrix  a11 of the inverted matrix is _______
Correct answer is '3'. Can you explain this answer?
Using the Gauss- Jorden reduction method, if we find the inverse of the matrix a11 of the inverted matrix is _______
a11 of the inverted matrix is _______|
|
Om Desai answered |
Writing the same matrix side by side with the unit matrix of order 3, we have
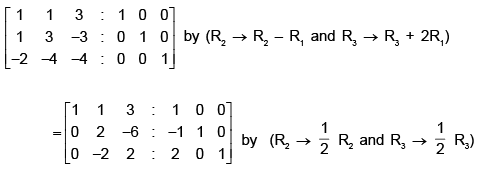
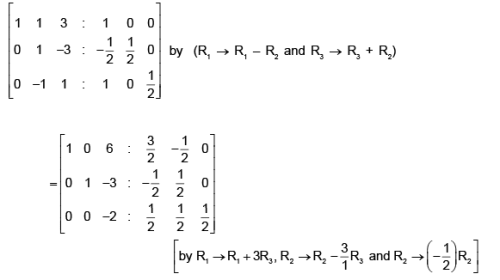
Hence the inverse of the given matrix is
Let P be a 2 × 2 real matrix such that every non-zero vector in ℝ2 is an eigenvector of P. Suppose that λ1 and λ2 denote the eigenvalues of P and P  for some t ∈ ℝ. Which of the following statements is (are) TRUE?
- a)λ1 ≠ λ2
- b)λ1 λ2 = 2
- c)√2 is an eigenvalue of P
- d)√3 is an eigenvalue of P
Correct answer is option 'B,C'. Can you explain this answer?
Let P be a 2 × 2 real matrix such that every non-zero vector in ℝ2 is an eigenvector of P. Suppose that λ1 and λ2 denote the eigenvalues of P and P for some t ∈ ℝ. Which of the following statements is (are) TRUE?
for some t ∈ ℝ. Which of the following statements is (are) TRUE?a)
λ1 ≠ λ2
b)
λ1 λ2 = 2
c)
√2 is an eigenvalue of P
d)
√3 is an eigenvalue of P

|
Education Hub answered |
√2 is an eigen value of P
and (lemda)1×(lemda)2=2
Two biased coins C1 and C2 have probabilities of getting heads 2/3 and 3/4 , respectively, when tossed. If both coins are tossed independently two times each, then the probability of getting exactly two heads out of these four tosses is - a)1/4
- b)37/144
- c)41/144
- d)49/144
Correct answer is option 'B'. Can you explain this answer?
Two biased coins C1 and C2 have probabilities of getting heads 2/3 and 3/4 , respectively, when tossed. If both coins are tossed independently two times each, then the probability of getting exactly two heads out of these four tosses is
a)
1/4
b)
37/144
c)
41/144
d)
49/144
|
|
Arnab Pillai answered |
Solution:
We are given two biased coins C1 and C2 with probabilities of getting heads 2/3 and 3/4 respectively when tossed.
Let's consider the possible outcomes for each coin when tossed twice:
- C1: HH, HT, TH, TT
- C2: HH, HT, TH, TT
We are interested in finding the probability of getting exactly two heads out of these four tosses.
Method 1: Using Combinatorics
We can use combinatorics to find the number of ways to get exactly two heads out of four tosses. We can then multiply this by the probability of each outcome occurring.
- Number of ways to get exactly two heads out of four tosses = 4C2 = 6 (where C2 denotes "combinations of 2")
- Probability of getting exactly two heads with coin C1 = (2/3)^2 * (1/3)^2 * 6 = 4/27
- Probability of getting exactly two heads with coin C2 = (3/4)^2 * (1/4)^2 * 6 = 27/256
The total probability of getting exactly two heads out of four tosses is the sum of the probabilities of getting exactly two heads with each coin:
- P(exactly two heads) = P(C1) + P(C2) = 4/27 + 27/256 = 37/144
Therefore, the correct answer is option B.
Method 2: Using a Probability Tree Diagram
We can also use a probability tree diagram to visualize the possible outcomes and their probabilities. Here is the probability tree diagram for tossing each coin twice:
```
H T
/ \ / \
H T H T
/ \ / \ / \ / \
H T H T H T H T
```
The probability of each outcome can be calculated by multiplying the probabilities of each branch. For example, the probability of getting HH with coin C1 is (2/3) * (2/3) = 4/9.
We can use the probability tree diagram to find the probability of getting exactly two heads out of four tosses:
- Probability of getting exactly two heads = P(HHHT) + P(HHTH) + P(HTHH) + P(THHH) = (4/9) * (1/3) * (1/3) * (1/3) * 4 + (4/9) * (1/3) * (1/3) * (1/3) * 4 + (4/9) * (1/3) * (1/3) * (1/3) * 4 + (1/3) * (1/3) * (1/3) * (4/9) * 4
- Simplifying the above expression gives us: 4/27 + 27/256 = 37/144
Therefore, the correct answer is option B.
Note: Both methods give the same answer, but the probability tree diagram may be easier to understand for some people.

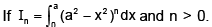
 what should be the value of a?
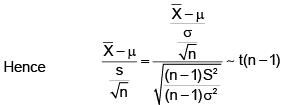
Let X1, X2, ..., Xm, Y1, Y2, ..., Yn be i.i.d. N(0, 1) random variables. Then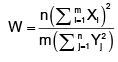 has
has- a)
- b)tn distribution
- c)Fm,n distribution
- d)F1,n distribution
Correct answer is option 'D'. Can you explain this answer?
Let X1, X2, ..., Xm, Y1, Y2, ..., Yn be i.i.d. N(0, 1) random variables. Then
has
a)
b)
tn distribution
c)
Fm,n distribution
d)
F1,n distribution

|
Bias Chatterjee answered |
Sum of Xi follows N(o,m),sum of Xi/root m follows N(0,1).Hence (sum of Xi/root m)^2 follows chi square with df 1.Yi follows standard normal distribution. Sum of n Yi^2 follows chi square with df n.Then W= Chi square one/( chi square n/n) follows F1,n
The imaginary parts of the eigenvalues of the matrix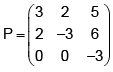 are
are- a)0, 0, 0
- b)2, –2, 0
- c)1, –1, 0
- d)3, –3, 0
Correct answer is option 'A'. Can you explain this answer?
The imaginary parts of the eigenvalues of the matrix
are
a)
0, 0, 0
b)
2, –2, 0
c)
1, –1, 0
d)
3, –3, 0

|
Ak Singh answered |
Eigenvalues of this matrix are : 3,-3+i2 and -3-i2
so the imaginary parts are 0,2,and -2
so the imaginary parts are 0,2,and -2
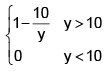
The probability density function of X, the lifetime of a certain type of electronic device (measured in hours), is given by,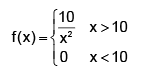 then which of the following holds ?
- a)P(X > 20) = 0.5
- b)P(X< 20) = 0.5
- c)The cumulative distribution function of X is
- d)All of these
Correct answer is option 'A,C'. Can you explain this answer?
The probability density function of X, the lifetime of a certain type of electronic device (measured in hours), is given by,
then which of the following holds ?
a)
P(X > 20) = 0.5
b)
P(X< 20) = 0.5
c)
The cumulative distribution function of X is
d)
All of these
|
|
Bhavana Dasgupta answered |
Ans.
Method to Solve :

What would a chi- square significance value of P > 0.05 suggest?- a)That there is a significant difference between the sample and the population
- b)That there is a significant relationship between categorical variables
- c)That there is no significant relationship between the sample and the population
- d)The there is a significant relationship between the sample and the population
Correct answer is option 'C'. Can you explain this answer?
What would a chi- square significance value of P > 0.05 suggest?
a)
That there is a significant difference between the sample and the population
b)
That there is a significant relationship between categorical variables
c)
That there is no significant relationship between the sample and the population
d)
The there is a significant relationship between the sample and the population
|
|
Kabir Verma answered |
Chi-square test
The chi-square test is a statistical test used to determine if there is a significant association between two categorical variables. It compares the observed frequencies in different categories with the expected frequencies under the assumption of independence.
Significance value (p-value)
The significance value, often denoted as p-value, is a measure that helps us determine the strength of evidence against the null hypothesis. It indicates the probability of obtaining the observed data or more extreme data if the null hypothesis is true.
When performing a chi-square test, we compare the calculated chi-square statistic with a critical value from the chi-square distribution table. The critical value is determined based on the desired level of significance, commonly denoted as alpha (α). A common alpha level in statistical analysis is 0.05.
If the p-value is less than or equal to the chosen alpha level (0.05), we reject the null hypothesis and conclude that there is a significant relationship between the categorical variables being tested. On the other hand, if the p-value is greater than 0.05, we fail to reject the null hypothesis and conclude that there is no significant relationship between the variables.
Explanation of option 'C'
Option 'C' states that a chi-square significance value of p < 0.05="" suggests="" that="" there="" is="" no="" significant="" relationship="" between="" the="" sample="" and="" the="" />
When the p-value is less than 0.05, it means that the observed data is unlikely to occur by chance alone under the assumption of independence. Therefore, we reject the null hypothesis and conclude that there is a significant relationship between the categorical variables being tested.
However, when the p-value is greater than 0.05, it means that the observed data is likely to occur by chance alone under the assumption of independence. In this case, we fail to reject the null hypothesis and conclude that there is no significant relationship between the variables.
Therefore, option 'C' is the correct answer because a chi-square significance value of p < 0.05="" suggests="" that="" there="" is="" no="" significant="" relationship="" between="" the="" sample="" and="" the="" population.="" 0.05="" suggests="" that="" there="" is="" no="" significant="" relationship="" between="" the="" sample="" and="" the="" />
Let X be a random variable of continuous type with probability density function f(x). Then, based on single observation X, the most powerful test of size α = 0.1 for testing H0 : f(X) = 2x, 0 < x < 1, against H1 : f(X) = 4x2, 0 < x < 1, has power- a)9/10
- b)1/10
- c)81/100
- d)19/100
Correct answer is option 'D'. Can you explain this answer?
Let X be a random variable of continuous type with probability density function f(x). Then, based on single observation X, the most powerful test of size α = 0.1 for testing H0 : f(X) = 2x, 0 < x < 1, against H1 : f(X) = 4x2, 0 < x < 1, has power
a)
9/10
b)
1/10
c)
81/100
d)
19/100
|
|
Lakshya Khanna answered |
Problem:
Let X be a random variable of continuous type with probability density function f(x). Then, based on single observation X, the most powerful test of size α = 0.1 for testing H0 : f(X) = 2x, 0 ≤ x ≤ 1, against H1 : f(X) = 4x^2, 0 ≤ x ≤ 1, has power
Solution:
To find the most powerful test for testing the given null and alternative hypotheses, we need to follow the Neyman-Pearson lemma. According to the lemma, the most powerful test is obtained by comparing the likelihood ratio with a threshold. Let's go through the steps to find the power of the test.
Step 1: Formulating the likelihood ratio:
The likelihood ratio is defined as the ratio of the likelihood of the alternative hypothesis to the likelihood of the null hypothesis. In this case, the likelihood ratio is given by:
LR(x) = L(H1) / L(H0)
Since we have a continuous random variable, we can rewrite the likelihood ratio as:
LR(x) = f1(x) / f0(x)
where f1(x) is the probability density function (pdf) of H1 and f0(x) is the pdf of H0.
Step 2: Finding the threshold:
To determine the threshold for the most powerful test, we need to specify the size of the test, which is α = 0.1 in this case. The size of the test is the maximum probability of rejecting the null hypothesis when it is true. Mathematically, it is given by:
α = max[Pr(reject H0 | H0 is true)]
Step 3: Calculating the power:
The power of the test is the probability of rejecting the null hypothesis when the alternative hypothesis is true. Mathematically, it is given by:
Power = Pr(reject H0 | H1 is true)
Step 4: Applying the likelihood ratio test:
To find the power, we need to compare the likelihood ratio with the threshold. If the likelihood ratio is greater than the threshold, we reject the null hypothesis; otherwise, we fail to reject the null hypothesis.
In this case, the likelihood ratio is:
LR(x) = (4x^2) / (2x) = 2x
To determine the threshold, we need to find the value of x such that the probability of observing a random variable greater than or equal to x under the null hypothesis is α. Since the null hypothesis is H0: f(X) = 2x, we can integrate the pdf f0(x) from x to 1 to find this probability.
∫[x to 1] 2x dx = [x^2] [x to 1] = 1 - x^2
Setting 1 - x^2 = α = 0.1, we have:
x^2 = 0.9
x = √0.9
Therefore, the threshold value is √0.9.
Now, we can calculate the power by finding the probability of the likelihood ratio being greater than the threshold.
Power = Pr(LR(x) > √0.9 | H1 is true)
= Pr(2x > √0.9
Let {Xn} be a sequence of independent Bernoulli random variables with parameter p = 1/2
generic term Xn of the sequence has support Rn = { 0, 1} and probability mass function: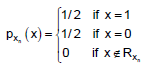
- a)
- b)

- c)
- d)

Correct answer is option 'B,C'. Can you explain this answer?
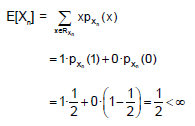
Let {Xn} be a sequence of independent Bernoulli random variables with parameter p = 1/2
generic term Xn of the sequence has support Rn = { 0, 1} and probability mass function:
generic term Xn of the sequence has support Rn = { 0, 1} and probability mass function:
a)
b)
c)
d)
|
|
Aryan Gupta answered |
(B,C) The sequence {Xn} is and IID sequence. The mean of a generic term of the sequence is
The variance of a generic term of the sequence can be derived thanks to the usual formula for computing the variance (Var[X] – E[X2] – E[X]2) :
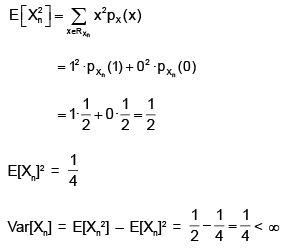
Therefore, the sequence {Xn} satisfies the conditions of Lindeberg-Levy Central Limit Theorem (IID, finite mean, finite variance).
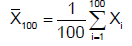
Using the Central Limit Theorem to approximate its distribution, we obtain:
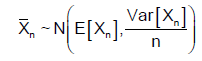
or
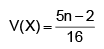
A die is thrown (n + 2) times. After each throw a ‘+’ is recorded for 4, 5 or 6 and ‘–’ for 1, 2 or 3, the signs forming an ordered sequence each, except the first and the last sign, is attached a characteristic random variable which takes the value 1 if both the neighbouring signs differ from the one between them and 0 otherwise. If X1, X2, ..., Xn are characteristic random variables, find the mean and variance of
- a)
- b)

- c)

- d)

Correct answer is option 'A'. Can you explain this answer?
A die is thrown (n + 2) times. After each throw a ‘+’ is recorded for 4, 5 or 6 and ‘–’ for 1, 2 or 3, the signs forming an ordered sequence each, except the first and the last sign, is attached a characteristic random variable which takes the value 1 if both the neighbouring signs differ from the one between them and 0 otherwise. If X1, X2, ..., Xn are characteristic random variables, find the mean and variance of
a)
b)
c)
d)
|
|
Ravi Ranjan answered |
V(X) = 5n-2/16
Let X be the number of heads obtained in a sequence of 10 independent tosses of a fair coin. The fair coin is tossed again X number of times independently, and let Y be the number of heads obtained in these X number of tosses. Then E(X + 2Y) equals __________
Correct answer is '10'. Can you explain this answer?
Let X be the number of heads obtained in a sequence of 10 independent tosses of a fair coin. The fair coin is tossed again X number of times independently, and let Y be the number of heads obtained in these X number of tosses. Then E(X + 2Y) equals __________
|
|
Amar Chawla answered |
Solution:
Calculation of E(X)
- Let p be the probability of getting a head in a single toss of a fair coin, which is 1/2.
- Let X be the number of heads obtained in a sequence of 10 independent tosses of a fair coin.
- X follows a binomial distribution with parameters n = 10 and p = 1/2.
- The expected value of a binomial distribution is given by E(X) = np, which in this case is 10*(1/2) = 5.
Calculation of E(Y)
- Let Y be the number of heads obtained in X number of tosses of a fair coin.
- Y follows a binomial distribution with parameters n = X and p = 1/2.
- The expected value of a binomial distribution is given by E(Y) = np, where n = X and p = 1/2.
- Substituting np = E(X) = 5, we get E(Y) = 5.
Calculation of E(X+2Y)
- We need to find E(X+2Y), which can be rewritten as E(X) + 2E(Y).
- Substituting the values of E(X) and E(Y), we get E(X+2Y) = 5 + 2*5 = 15.
- Therefore, E(X 2Y) = E(X+2Y) - E(X) = 15 - 5 = 10.
Final Answer:
- E(X 2Y) = 10.
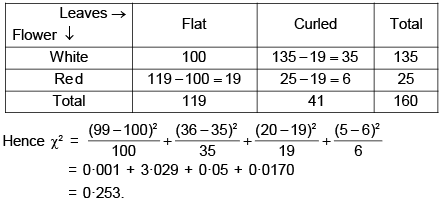
From the following table showing the number of plants having certain character, test the hypothesis that the flower colour is independent of flatness of leaves.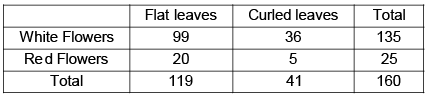 You may use the following table giving the value of c2 for one degree of freedom, for different values of P.
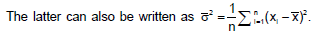
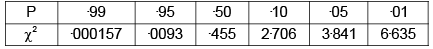 Calculate the value of χ2 for the above table
Correct answer is '0.253'. Can you explain this answer?
From the following table showing the number of plants having certain character, test the hypothesis that the flower colour is independent of flatness of leaves.
You may use the following table giving the value of c2 for one degree of freedom, for different values of P.
Calculate the value of χ2 for the above table
|
|
Pranavi Mishra answered |
On the hypothesis that the flower colour is independent for the flatness of leaves, the theoretical frequency for the plants having white flowers and flat leaves = 135 x 119/160= 100
approx.
Other theoretical frequencies follow from the fact that the border frequencies for the rows and columns remain unchanged. The expected frequencies are shown in the following 2 × 2 contingency table.
approx.
Other theoretical frequencies follow from the fact that the border frequencies for the rows and columns remain unchanged. The expected frequencies are shown in the following 2 × 2 contingency table.
Let E, F and G be any three events with P(E) = 0.3, P(F|E) = 0.2, P(G|E) = 0.1 and P (F ∩ G|E) = 0.05. Then P(E − (F ∪ G)) equals- a)0.155
- b)0.175
- c)0.225
- d)0.255
Correct answer is option 'C'. Can you explain this answer?
Let E, F and G be any three events with P(E) = 0.3, P(F|E) = 0.2, P(G|E) = 0.1 and P (F ∩ G|E) = 0.05. Then P(E − (F ∪ G)) equals
a)
0.155
b)
0.175
c)
0.225
d)
0.255
|
|
Anushka Basak answered |
A) What is P(F)?
Using the law of total probability, we have:
P(F) = P(F|E)P(E) + P(F|E')P(E')
where E' is the complement of E. Since E and E' are mutually exclusive and exhaustive, we can write:
P(E') = 1 - P(E) = 1 - 0.3 = 0.7
Also, we are not given any information about P(F|E'), so we cannot compute it. Therefore:
P(F) = P(F|E)P(E) + P(F|E')P(E')
= 0.2(0.3) + P(F|E')0.7
b) What is P(G)?
Using the law of total probability again, we have:
P(G) = P(G|E)P(E) + P(G|E')P(E')
Since we are not given any information about P(G|E') either, we cannot compute it. Therefore:
P(G) = P(G|E)P(E) + P(G|E')P(E')
= 0.1(0.3) + P(G|E')0.7
c) What is P(F and G)?
Using the definition of conditional probability, we have:
P(F and G|E) = P(F|E)P(G|E)
Therefore, we can write:
P(F and G) = P(F and G|E)P(E) + P(F and G|E')P(E')
Again, we are not given any information about P(F and G|E'), so we cannot compute it. Therefore:
P(F and G) = P(F and G|E)P(E) + P(F and G|E')P(E')
= (0.2)(0.1)(0.3) + P(F and G|E')0.7
d) Are F and G independent?
We can check whether F and G are independent by comparing their joint probability P(F and G) with their product of individual probabilities P(F)P(G). If they are equal, then F and G are independent; otherwise, they are dependent.
From part c), we have:
P(F and G) = (0.2)(0.1)(0.3) + P(F and G|E')0.7
From parts a) and b), we have:
P(F) = 0.2(0.3) + P(F|E')0.7
P(G) = 0.1(0.3) + P(G|E')0.7
Therefore:
P(F)P(G) = [0.2(0.3) + P(F|E')0.7][0.1(0.3) + P(G|E')0.7]
Expanding and simplifying, we get:
P(F)P(G) = 0.06 + 0.02P(F|E') + 0.03P(G|E') + 0.49P(F|E')P(G|E')
Since we are not given any information about P(F and G|E'), we cannot compute it directly. However, we can use the formula for conditional probability:
P(F and G|E
Let 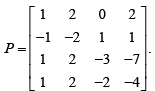 Then rank of P equals
 - a) 4
- b) 3
- c) 2
- d) 1
Correct answer is option 'C'. Can you explain this answer?
Let
Then rank of P equals
a)
4
b)
3
c)
2
d)
1

|
Nihala Navas answered |
Rank of a matrix is the order of the largest square sub matrix whose determinant is not equal to zero. If we consider 4*4 matrix , it's determinant is 0, this doesn't satisfy the above condition . This is same for any 3*3 matrix taken from the above matrix . Here a 2*2 matrix gave a determinant which is not equal to 0. Therefore rank of the matrix is 2
The series  converges absolutely to the limit__.
Correct answer is '0.74'. Can you explain this answer?
The series converges absolutely to the limit__.
converges absolutely to the limit__.|
|
Mrinalini Singh answered |
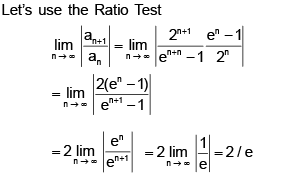
(Notice between the two middle steps, we used L’Hopital rule) Conclusion: Since 2/e < 1, the series converges.


If two dice are thrown, what is the expected value of sum of the face values?- a)2
- b)5
- c)10
- d)7
Correct answer is option 'D'. Can you explain this answer?
If two dice are thrown, what is the expected value of sum of the face values?
a)
2
b)
5
c)
10
d)
7
|
|
Avinash Mehta answered |
The expectation of the sum of two (independent) dice is the sum of expectations of each die, which is 3.5 + 3.5 = 7. Similarly, for N dice throws, the expectation of the sum should be N * 3.5. If you're taking only the maximum value of the two dice throws, then your answer 4.47 is correct.
If (xn) is a sequence of real numbers which converges to x then the sequence (sn) where- a)converges to 0
- b)diverges
- c)converges to x
- d)None
Correct answer is option 'C'. Can you explain this answer?
If (xn) is a sequence of real numbers which converges to x then the sequence (sn) where
a)
converges to 0
b)
diverges
c)
converges to x
d)
None
|
|
Ipsita Chopra answered |
(xn) converges to x implies that for every ∈ > 0 there exists an N such that
|xn – x| < ∈ for all n ≥ N
We now divide the sum into those terms before N and those after N. We have
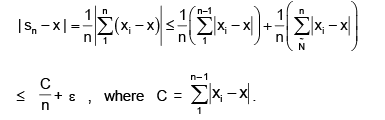
now 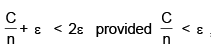
which requires that n > C/∈ .
Thus if we let N = max{N, C/∈} then for all n ≥ N we have |sn – x| < 2∈ which proves that the sequence (sn) converges to x.
Chapter doubts & questions for Mathematical Statistics - MS - IIT JAM Past Year Papers and Model Test Paper (All Branches) 2025 is part of IIT JAM exam preparation. The chapters have been prepared according to the IIT JAM exam syllabus. The Chapter doubts & questions, notes, tests & MCQs are made for IIT JAM 2025 Exam. Find important definitions, questions, notes, meanings, examples, exercises, MCQs and online tests here.
Chapter doubts & questions of Mathematical Statistics - MS - IIT JAM Past Year Papers and Model Test Paper (All Branches) in English & Hindi are available as part of IIT JAM exam.
Download more important topics, notes, lectures and mock test series for IIT JAM Exam by signing up for free.
|
© EduRev
|
Education Revolution
|


|


Signup to see your scores
go up
within 7 days!
within 7 days!
Takes less than 10 seconds to signup