


GMAT Exam > GMAT Questions > The graph shown is a scatter plot with 60 poi...
Start Learning for Free

The graph shown is a scatter plot with 60 points, each representing the number of quality assurance inspections conducted on products manufactured at 60 different factories, and the corresponding numbers of product recalls experienced by each factory. Each factory conducted a consistent number of quality assurance inspections on all products produced during a one-year period, and the number of product recalls was measured over that same period. The solid line is the regression line, and the dashed line is the line through the points (1, 1) and (7, 5). Select the best answer to fill in the blanks in each of the statements below based on the data shown in the graph.
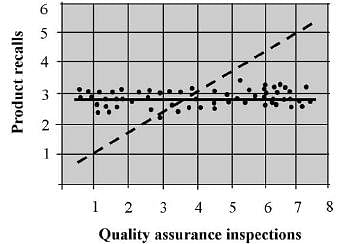
Q. The number of products that received more than seven quality assurance inspections is closest to ________ percent of 60.
- a)0
- b)10
- c)20
- d)35
- e)50
Correct answer is option 'B'. Can you explain this answer?
| FREE This question is part of | Download PDF Attempt this Test |
Most Upvoted Answer
The graph shown is a scatter plot with 60 points, each representing th...
The number of products that received more than seven quality assurance inspections is closest to 10 percent of 60. The graph shows that four products received more than seven quality assurance inspections. These four products are 0.067 percent of the total, or 6.7 percent.
Attention GMAT Students!
To make sure you are not studying endlessly, EduRev has designed GMAT study material, with Structured Courses, Videos, & Test Series. Plus get personalized analysis, doubt solving and improvement plans to achieve a great score in GMAT.


|
Explore Courses for GMAT exam
|
|
Similar GMAT Doubts


Top Courses for GMATView all


The graph shown is a scatter plot with 60 points, each representing the number of quality assurance inspections conducted on products manufactured at 60 different factories, and the corresponding numbers of product recalls experienced by each factory. Each factory conducted a consistent number of quality assurance inspections on all products produced during a one-year period, and the number of product recalls was measured over that same period. The solid line is the regression line, and the dashed line is the line through the points (1, 1) and (7, 5). Select the best answerto fill in the blanks in each of the statements below based on the data shown in the graph.Q. The number of products that received more than seven quality assurance inspections is closest to ________ percent of 60.a)0b)10c)20d)35e)50Correct answer is option 'B'. Can you explain this answer?
Question Description
The graph shown is a scatter plot with 60 points, each representing the number of quality assurance inspections conducted on products manufactured at 60 different factories, and the corresponding numbers of product recalls experienced by each factory. Each factory conducted a consistent number of quality assurance inspections on all products produced during a one-year period, and the number of product recalls was measured over that same period. The solid line is the regression line, and the dashed line is the line through the points (1, 1) and (7, 5). Select the best answerto fill in the blanks in each of the statements below based on the data shown in the graph.Q. The number of products that received more than seven quality assurance inspections is closest to ________ percent of 60.a)0b)10c)20d)35e)50Correct answer is option 'B'. Can you explain this answer? for GMAT 2024 is part of GMAT preparation. The Question and answers have been prepared according to the GMAT exam syllabus. Information about The graph shown is a scatter plot with 60 points, each representing the number of quality assurance inspections conducted on products manufactured at 60 different factories, and the corresponding numbers of product recalls experienced by each factory. Each factory conducted a consistent number of quality assurance inspections on all products produced during a one-year period, and the number of product recalls was measured over that same period. The solid line is the regression line, and the dashed line is the line through the points (1, 1) and (7, 5). Select the best answerto fill in the blanks in each of the statements below based on the data shown in the graph.Q. The number of products that received more than seven quality assurance inspections is closest to ________ percent of 60.a)0b)10c)20d)35e)50Correct answer is option 'B'. Can you explain this answer? covers all topics & solutions for GMAT 2024 Exam. Find important definitions, questions, meanings, examples, exercises and tests below for The graph shown is a scatter plot with 60 points, each representing the number of quality assurance inspections conducted on products manufactured at 60 different factories, and the corresponding numbers of product recalls experienced by each factory. Each factory conducted a consistent number of quality assurance inspections on all products produced during a one-year period, and the number of product recalls was measured over that same period. The solid line is the regression line, and the dashed line is the line through the points (1, 1) and (7, 5). Select the best answerto fill in the blanks in each of the statements below based on the data shown in the graph.Q. The number of products that received more than seven quality assurance inspections is closest to ________ percent of 60.a)0b)10c)20d)35e)50Correct answer is option 'B'. Can you explain this answer?.
The graph shown is a scatter plot with 60 points, each representing the number of quality assurance inspections conducted on products manufactured at 60 different factories, and the corresponding numbers of product recalls experienced by each factory. Each factory conducted a consistent number of quality assurance inspections on all products produced during a one-year period, and the number of product recalls was measured over that same period. The solid line is the regression line, and the dashed line is the line through the points (1, 1) and (7, 5). Select the best answerto fill in the blanks in each of the statements below based on the data shown in the graph.Q. The number of products that received more than seven quality assurance inspections is closest to ________ percent of 60.a)0b)10c)20d)35e)50Correct answer is option 'B'. Can you explain this answer? for GMAT 2024 is part of GMAT preparation. The Question and answers have been prepared according to the GMAT exam syllabus. Information about The graph shown is a scatter plot with 60 points, each representing the number of quality assurance inspections conducted on products manufactured at 60 different factories, and the corresponding numbers of product recalls experienced by each factory. Each factory conducted a consistent number of quality assurance inspections on all products produced during a one-year period, and the number of product recalls was measured over that same period. The solid line is the regression line, and the dashed line is the line through the points (1, 1) and (7, 5). Select the best answerto fill in the blanks in each of the statements below based on the data shown in the graph.Q. The number of products that received more than seven quality assurance inspections is closest to ________ percent of 60.a)0b)10c)20d)35e)50Correct answer is option 'B'. Can you explain this answer? covers all topics & solutions for GMAT 2024 Exam. Find important definitions, questions, meanings, examples, exercises and tests below for The graph shown is a scatter plot with 60 points, each representing the number of quality assurance inspections conducted on products manufactured at 60 different factories, and the corresponding numbers of product recalls experienced by each factory. Each factory conducted a consistent number of quality assurance inspections on all products produced during a one-year period, and the number of product recalls was measured over that same period. The solid line is the regression line, and the dashed line is the line through the points (1, 1) and (7, 5). Select the best answerto fill in the blanks in each of the statements below based on the data shown in the graph.Q. The number of products that received more than seven quality assurance inspections is closest to ________ percent of 60.a)0b)10c)20d)35e)50Correct answer is option 'B'. Can you explain this answer?.
Solutions for The graph shown is a scatter plot with 60 points, each representing the number of quality assurance inspections conducted on products manufactured at 60 different factories, and the corresponding numbers of product recalls experienced by each factory. Each factory conducted a consistent number of quality assurance inspections on all products produced during a one-year period, and the number of product recalls was measured over that same period. The solid line is the regression line, and the dashed line is the line through the points (1, 1) and (7, 5). Select the best answerto fill in the blanks in each of the statements below based on the data shown in the graph.Q. The number of products that received more than seven quality assurance inspections is closest to ________ percent of 60.a)0b)10c)20d)35e)50Correct answer is option 'B'. Can you explain this answer? in English & in Hindi are available as part of our courses for GMAT.
Download more important topics, notes, lectures and mock test series for GMAT Exam by signing up for free.
Here you can find the meaning of The graph shown is a scatter plot with 60 points, each representing the number of quality assurance inspections conducted on products manufactured at 60 different factories, and the corresponding numbers of product recalls experienced by each factory. Each factory conducted a consistent number of quality assurance inspections on all products produced during a one-year period, and the number of product recalls was measured over that same period. The solid line is the regression line, and the dashed line is the line through the points (1, 1) and (7, 5). Select the best answerto fill in the blanks in each of the statements below based on the data shown in the graph.Q. The number of products that received more than seven quality assurance inspections is closest to ________ percent of 60.a)0b)10c)20d)35e)50Correct answer is option 'B'. Can you explain this answer? defined & explained in the simplest way possible. Besides giving the explanation of
The graph shown is a scatter plot with 60 points, each representing the number of quality assurance inspections conducted on products manufactured at 60 different factories, and the corresponding numbers of product recalls experienced by each factory. Each factory conducted a consistent number of quality assurance inspections on all products produced during a one-year period, and the number of product recalls was measured over that same period. The solid line is the regression line, and the dashed line is the line through the points (1, 1) and (7, 5). Select the best answerto fill in the blanks in each of the statements below based on the data shown in the graph.Q. The number of products that received more than seven quality assurance inspections is closest to ________ percent of 60.a)0b)10c)20d)35e)50Correct answer is option 'B'. Can you explain this answer?, a detailed solution for The graph shown is a scatter plot with 60 points, each representing the number of quality assurance inspections conducted on products manufactured at 60 different factories, and the corresponding numbers of product recalls experienced by each factory. Each factory conducted a consistent number of quality assurance inspections on all products produced during a one-year period, and the number of product recalls was measured over that same period. The solid line is the regression line, and the dashed line is the line through the points (1, 1) and (7, 5). Select the best answerto fill in the blanks in each of the statements below based on the data shown in the graph.Q. The number of products that received more than seven quality assurance inspections is closest to ________ percent of 60.a)0b)10c)20d)35e)50Correct answer is option 'B'. Can you explain this answer? has been provided alongside types of The graph shown is a scatter plot with 60 points, each representing the number of quality assurance inspections conducted on products manufactured at 60 different factories, and the corresponding numbers of product recalls experienced by each factory. Each factory conducted a consistent number of quality assurance inspections on all products produced during a one-year period, and the number of product recalls was measured over that same period. The solid line is the regression line, and the dashed line is the line through the points (1, 1) and (7, 5). Select the best answerto fill in the blanks in each of the statements below based on the data shown in the graph.Q. The number of products that received more than seven quality assurance inspections is closest to ________ percent of 60.a)0b)10c)20d)35e)50Correct answer is option 'B'. Can you explain this answer? theory, EduRev gives you an
ample number of questions to practice The graph shown is a scatter plot with 60 points, each representing the number of quality assurance inspections conducted on products manufactured at 60 different factories, and the corresponding numbers of product recalls experienced by each factory. Each factory conducted a consistent number of quality assurance inspections on all products produced during a one-year period, and the number of product recalls was measured over that same period. The solid line is the regression line, and the dashed line is the line through the points (1, 1) and (7, 5). Select the best answerto fill in the blanks in each of the statements below based on the data shown in the graph.Q. The number of products that received more than seven quality assurance inspections is closest to ________ percent of 60.a)0b)10c)20d)35e)50Correct answer is option 'B'. Can you explain this answer? tests, examples and also practice GMAT tests.
|
|
Explore Courses for GMAT exam
|
|
Suggested Free Tests
Signup for Free!
Signup to see your scores go up within 7 days! Learn & Practice with 1000+ FREE Notes, Videos & Tests.


|
© EduRev
|
Education Revolution
|


|


Signup to see your scores
go up within 7 days!
Access 1000+ FREE Docs, Videos and Tests
Takes less than 10 seconds to signup