


Banking Exams Exam > Banking Exams Questions > Direction: Read the following Pie chart and ...
Start Learning for Free

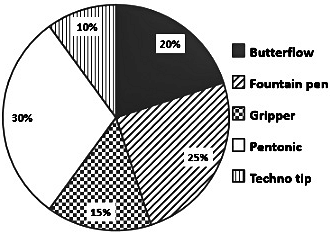
Direction: Read the following Pie chart and Bar graph carefully and answer the following question.
Following pie chart show the percentage distribution of sales of different model of pens and Bar graph shows the prices of pens
Note: Total sales of pens = 1000
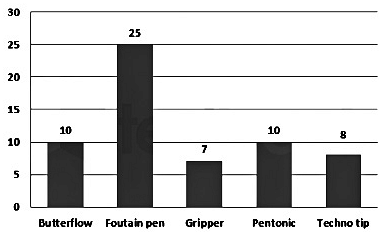
Revenue = Number of pens sold × Price of the pen
Revenue generated by butterflow is what percent of the revenue generated by pentomic pens.
- a)60.85%
- b)64.75%
- c)66.67%
- d)65.55%
- e)57.14%
Correct answer is option 'C'. Can you explain this answer?
| FREE This question is part of | Download PDF Attempt this Test |
Most Upvoted Answer
Direction: Read the following Pie chart and Bar graph carefully and a...
Revenue generated by butterflow = (20/100)× 1000 × Rs. 10 = Rs. 2,000
Revenue generated by pentonic = (30/100)× 1000 × Rs. 10 = Rs. 3000
⇒ Required percentage = (2000/3000)× 100 = 200/3%
⇒ 66.67%
∴ Revenue generated by Butterflow is 66.67%.
Attention Banking Exams Students!
To make sure you are not studying endlessly, EduRev has designed Banking Exams study material, with Structured Courses, Videos, & Test Series. Plus get personalized analysis, doubt solving and improvement plans to achieve a great score in Banking Exams.


|
Explore Courses for Banking Exams exam
|
|
Similar Banking Exams Doubts


Top Courses for Banking ExamsView all


Direction: Read the following Pie chart and Bar graph carefully and answer the following question.Following pie chart show the percentage distribution of sales of different model of pens and Bar graph shows the prices of pensNote: Total sales of pens = 1000Revenue = Number of pens sold × Price of the penRevenue generated by butterflow is what percent of the revenue generated by pentomic pens.a)60.85%b)64.75%c)66.67%d)65.55%e)57.14%Correct answer is option 'C'. Can you explain this answer?
Question Description
Direction: Read the following Pie chart and Bar graph carefully and answer the following question.Following pie chart show the percentage distribution of sales of different model of pens and Bar graph shows the prices of pensNote: Total sales of pens = 1000Revenue = Number of pens sold × Price of the penRevenue generated by butterflow is what percent of the revenue generated by pentomic pens.a)60.85%b)64.75%c)66.67%d)65.55%e)57.14%Correct answer is option 'C'. Can you explain this answer? for Banking Exams 2024 is part of Banking Exams preparation. The Question and answers have been prepared according to the Banking Exams exam syllabus. Information about Direction: Read the following Pie chart and Bar graph carefully and answer the following question.Following pie chart show the percentage distribution of sales of different model of pens and Bar graph shows the prices of pensNote: Total sales of pens = 1000Revenue = Number of pens sold × Price of the penRevenue generated by butterflow is what percent of the revenue generated by pentomic pens.a)60.85%b)64.75%c)66.67%d)65.55%e)57.14%Correct answer is option 'C'. Can you explain this answer? covers all topics & solutions for Banking Exams 2024 Exam. Find important definitions, questions, meanings, examples, exercises and tests below for Direction: Read the following Pie chart and Bar graph carefully and answer the following question.Following pie chart show the percentage distribution of sales of different model of pens and Bar graph shows the prices of pensNote: Total sales of pens = 1000Revenue = Number of pens sold × Price of the penRevenue generated by butterflow is what percent of the revenue generated by pentomic pens.a)60.85%b)64.75%c)66.67%d)65.55%e)57.14%Correct answer is option 'C'. Can you explain this answer?.
Direction: Read the following Pie chart and Bar graph carefully and answer the following question.Following pie chart show the percentage distribution of sales of different model of pens and Bar graph shows the prices of pensNote: Total sales of pens = 1000Revenue = Number of pens sold × Price of the penRevenue generated by butterflow is what percent of the revenue generated by pentomic pens.a)60.85%b)64.75%c)66.67%d)65.55%e)57.14%Correct answer is option 'C'. Can you explain this answer? for Banking Exams 2024 is part of Banking Exams preparation. The Question and answers have been prepared according to the Banking Exams exam syllabus. Information about Direction: Read the following Pie chart and Bar graph carefully and answer the following question.Following pie chart show the percentage distribution of sales of different model of pens and Bar graph shows the prices of pensNote: Total sales of pens = 1000Revenue = Number of pens sold × Price of the penRevenue generated by butterflow is what percent of the revenue generated by pentomic pens.a)60.85%b)64.75%c)66.67%d)65.55%e)57.14%Correct answer is option 'C'. Can you explain this answer? covers all topics & solutions for Banking Exams 2024 Exam. Find important definitions, questions, meanings, examples, exercises and tests below for Direction: Read the following Pie chart and Bar graph carefully and answer the following question.Following pie chart show the percentage distribution of sales of different model of pens and Bar graph shows the prices of pensNote: Total sales of pens = 1000Revenue = Number of pens sold × Price of the penRevenue generated by butterflow is what percent of the revenue generated by pentomic pens.a)60.85%b)64.75%c)66.67%d)65.55%e)57.14%Correct answer is option 'C'. Can you explain this answer?.
Solutions for Direction: Read the following Pie chart and Bar graph carefully and answer the following question.Following pie chart show the percentage distribution of sales of different model of pens and Bar graph shows the prices of pensNote: Total sales of pens = 1000Revenue = Number of pens sold × Price of the penRevenue generated by butterflow is what percent of the revenue generated by pentomic pens.a)60.85%b)64.75%c)66.67%d)65.55%e)57.14%Correct answer is option 'C'. Can you explain this answer? in English & in Hindi are available as part of our courses for Banking Exams.
Download more important topics, notes, lectures and mock test series for Banking Exams Exam by signing up for free.
Here you can find the meaning of Direction: Read the following Pie chart and Bar graph carefully and answer the following question.Following pie chart show the percentage distribution of sales of different model of pens and Bar graph shows the prices of pensNote: Total sales of pens = 1000Revenue = Number of pens sold × Price of the penRevenue generated by butterflow is what percent of the revenue generated by pentomic pens.a)60.85%b)64.75%c)66.67%d)65.55%e)57.14%Correct answer is option 'C'. Can you explain this answer? defined & explained in the simplest way possible. Besides giving the explanation of
Direction: Read the following Pie chart and Bar graph carefully and answer the following question.Following pie chart show the percentage distribution of sales of different model of pens and Bar graph shows the prices of pensNote: Total sales of pens = 1000Revenue = Number of pens sold × Price of the penRevenue generated by butterflow is what percent of the revenue generated by pentomic pens.a)60.85%b)64.75%c)66.67%d)65.55%e)57.14%Correct answer is option 'C'. Can you explain this answer?, a detailed solution for Direction: Read the following Pie chart and Bar graph carefully and answer the following question.Following pie chart show the percentage distribution of sales of different model of pens and Bar graph shows the prices of pensNote: Total sales of pens = 1000Revenue = Number of pens sold × Price of the penRevenue generated by butterflow is what percent of the revenue generated by pentomic pens.a)60.85%b)64.75%c)66.67%d)65.55%e)57.14%Correct answer is option 'C'. Can you explain this answer? has been provided alongside types of Direction: Read the following Pie chart and Bar graph carefully and answer the following question.Following pie chart show the percentage distribution of sales of different model of pens and Bar graph shows the prices of pensNote: Total sales of pens = 1000Revenue = Number of pens sold × Price of the penRevenue generated by butterflow is what percent of the revenue generated by pentomic pens.a)60.85%b)64.75%c)66.67%d)65.55%e)57.14%Correct answer is option 'C'. Can you explain this answer? theory, EduRev gives you an
ample number of questions to practice Direction: Read the following Pie chart and Bar graph carefully and answer the following question.Following pie chart show the percentage distribution of sales of different model of pens and Bar graph shows the prices of pensNote: Total sales of pens = 1000Revenue = Number of pens sold × Price of the penRevenue generated by butterflow is what percent of the revenue generated by pentomic pens.a)60.85%b)64.75%c)66.67%d)65.55%e)57.14%Correct answer is option 'C'. Can you explain this answer? tests, examples and also practice Banking Exams tests.
|
|
Explore Courses for Banking Exams exam
|
|
Suggested Free Tests
Signup for Free!
Signup to see your scores go up within 7 days! Learn & Practice with 1000+ FREE Notes, Videos & Tests.


|
© EduRev
|
Education Revolution
|


Follow Us
|


Signup to see your scores
go up within 7 days!
Access 1000+ FREE Docs, Videos and Tests
Takes less than 10 seconds to signup