


GRE Exam > GRE Questions > Length Of Unemployment for Workers in Region ...
Start Learning for Free
Length Of Unemployment for Workers in Region X for Two Industries, 2003
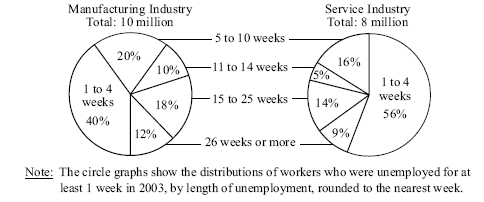
Q. In the circle graphs, the degree measure of the central angle of the sector representing the number of workers unemployed for 11 to 14 weeks is how much greater in the manufacturing industry graph than in the service industry graph?
- a)5°
- b)20°
- c)10°
- d)18°
- e)15°
Correct answer is option 'D'. Can you explain this answer?

Verified Answer
Length Of Unemployment for Workers in Region X for Two Industries, 200...
Recall that in a circle graph, the degree measure of the central angle of a sector representing n percent of the data is equal to n percent of 360°.
The degree measure of the sector representing the number of workers unemployed for 11 to 14 weeks is 10% of 360°, or 36°, for the manufacturing industry graph and is 5% of 360°, or 18°, for the service industry graph. Since 36° − 18° = 18°, the measure of the central angle of that sector in the manufacturing industry graph is 18° greater than the measure of the central angle of the corresponding sector in the service industry graph. The correct answer is Choice b.
Most Upvoted Answer
Length Of Unemployment for Workers in Region X for Two Industries, 200...
Recall that in a circle graph, the degree measure of the central angle of a sector representing n percent of the data is equal to n percent of 360°.
The degree measure of the sector representing the number of workers unemployed for 11 to 14 weeks is 10% of 360°, or 36°, for the manufacturing industry graph and is 5% of 360°, or 18°, for the service industry graph. Since 36° − 18° = 18°, the measure of the central angle of that sector in the manufacturing industry graph is 18° greater than the measure of the central angle of the corresponding sector in the service industry graph. The correct answer is Choice b.
Free Test
FREE
| Start Free Test |
Community Answer
Length Of Unemployment for Workers in Region X for Two Industries, 200...
Recall that in a circle graph, the degree measure of the central angle of a sector representing n percent of the data is equal to n percent of 360°.
The degree measure of the sector representing the number of workers unemployed for 11 to 14 weeks is 10% of 360°, or 36°, for the manufacturing industry graph and is 5% of 360°, or 18°, for the service industry graph. Since 36° − 18° = 18°, the measure of the central angle of that sector in the manufacturing industry graph is 18° greater than the measure of the central angle of the corresponding sector in the service industry graph. The correct answer is Choice b.

|
Explore Courses for GRE exam
|
|
Top Courses for GREView all


Question Description
Length Of Unemployment for Workers in Region X for Two Industries, 2003Q. In the circle graphs, the degree measure of the central angle of the sector representing the number of workers unemployed for 11 to 14 weeks is how much greater in the manufacturing industry graph than in the service industry graph?a)5°b)20°c)10°d)18°e)15°Correct answer is option 'D'. Can you explain this answer? for GRE 2025 is part of GRE preparation. The Question and answers have been prepared according to the GRE exam syllabus. Information about Length Of Unemployment for Workers in Region X for Two Industries, 2003Q. In the circle graphs, the degree measure of the central angle of the sector representing the number of workers unemployed for 11 to 14 weeks is how much greater in the manufacturing industry graph than in the service industry graph?a)5°b)20°c)10°d)18°e)15°Correct answer is option 'D'. Can you explain this answer? covers all topics & solutions for GRE 2025 Exam. Find important definitions, questions, meanings, examples, exercises and tests below for Length Of Unemployment for Workers in Region X for Two Industries, 2003Q. In the circle graphs, the degree measure of the central angle of the sector representing the number of workers unemployed for 11 to 14 weeks is how much greater in the manufacturing industry graph than in the service industry graph?a)5°b)20°c)10°d)18°e)15°Correct answer is option 'D'. Can you explain this answer?.
Length Of Unemployment for Workers in Region X for Two Industries, 2003Q. In the circle graphs, the degree measure of the central angle of the sector representing the number of workers unemployed for 11 to 14 weeks is how much greater in the manufacturing industry graph than in the service industry graph?a)5°b)20°c)10°d)18°e)15°Correct answer is option 'D'. Can you explain this answer? for GRE 2025 is part of GRE preparation. The Question and answers have been prepared according to the GRE exam syllabus. Information about Length Of Unemployment for Workers in Region X for Two Industries, 2003Q. In the circle graphs, the degree measure of the central angle of the sector representing the number of workers unemployed for 11 to 14 weeks is how much greater in the manufacturing industry graph than in the service industry graph?a)5°b)20°c)10°d)18°e)15°Correct answer is option 'D'. Can you explain this answer? covers all topics & solutions for GRE 2025 Exam. Find important definitions, questions, meanings, examples, exercises and tests below for Length Of Unemployment for Workers in Region X for Two Industries, 2003Q. In the circle graphs, the degree measure of the central angle of the sector representing the number of workers unemployed for 11 to 14 weeks is how much greater in the manufacturing industry graph than in the service industry graph?a)5°b)20°c)10°d)18°e)15°Correct answer is option 'D'. Can you explain this answer?.
Solutions for Length Of Unemployment for Workers in Region X for Two Industries, 2003Q. In the circle graphs, the degree measure of the central angle of the sector representing the number of workers unemployed for 11 to 14 weeks is how much greater in the manufacturing industry graph than in the service industry graph?a)5°b)20°c)10°d)18°e)15°Correct answer is option 'D'. Can you explain this answer? in English & in Hindi are available as part of our courses for GRE.
Download more important topics, notes, lectures and mock test series for GRE Exam by signing up for free.
Here you can find the meaning of Length Of Unemployment for Workers in Region X for Two Industries, 2003Q. In the circle graphs, the degree measure of the central angle of the sector representing the number of workers unemployed for 11 to 14 weeks is how much greater in the manufacturing industry graph than in the service industry graph?a)5°b)20°c)10°d)18°e)15°Correct answer is option 'D'. Can you explain this answer? defined & explained in the simplest way possible. Besides giving the explanation of
Length Of Unemployment for Workers in Region X for Two Industries, 2003Q. In the circle graphs, the degree measure of the central angle of the sector representing the number of workers unemployed for 11 to 14 weeks is how much greater in the manufacturing industry graph than in the service industry graph?a)5°b)20°c)10°d)18°e)15°Correct answer is option 'D'. Can you explain this answer?, a detailed solution for Length Of Unemployment for Workers in Region X for Two Industries, 2003Q. In the circle graphs, the degree measure of the central angle of the sector representing the number of workers unemployed for 11 to 14 weeks is how much greater in the manufacturing industry graph than in the service industry graph?a)5°b)20°c)10°d)18°e)15°Correct answer is option 'D'. Can you explain this answer? has been provided alongside types of Length Of Unemployment for Workers in Region X for Two Industries, 2003Q. In the circle graphs, the degree measure of the central angle of the sector representing the number of workers unemployed for 11 to 14 weeks is how much greater in the manufacturing industry graph than in the service industry graph?a)5°b)20°c)10°d)18°e)15°Correct answer is option 'D'. Can you explain this answer? theory, EduRev gives you an
ample number of questions to practice Length Of Unemployment for Workers in Region X for Two Industries, 2003Q. In the circle graphs, the degree measure of the central angle of the sector representing the number of workers unemployed for 11 to 14 weeks is how much greater in the manufacturing industry graph than in the service industry graph?a)5°b)20°c)10°d)18°e)15°Correct answer is option 'D'. Can you explain this answer? tests, examples and also practice GRE tests.
|
|
Explore Courses for GRE exam
|
|

Signup for Free!
Signup to see your scores go up within 7 days! Learn & Practice with 1000+ FREE Notes, Videos & Tests.
|
© EduRev
|
Education Revolution
|


|


Signup on EduRev and stay on top of your study goals
10M+ students crushing their study goals daily