


Banking Exams Exam > Banking Exams Questions > Directions: Study the data carefully to answe...
Start Learning for Free
Directions: Study the data carefully to answer the following questions:
Pie chart represents total bulbs produced in four years.
Total number of bulbs produced = 2,00,000
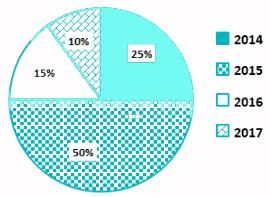
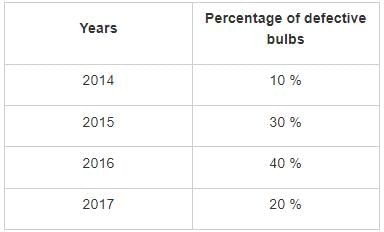
Table represents the percentage of defective bulbs produced in different years.
Total defective bulbs produced = 50,000
Pie chart represents total bulbs produced in four years.
Total number of bulbs produced = 2,00,000
Table represents the percentage of defective bulbs produced in different years.
Total defective bulbs produced = 50,000
Q. Total number of bulbs produced in 2018 is 20% more than the bulbs produced in 2015 and if the percentage of defective bulb is 10% then find the number of non- defective bulbs produced in 2018.
- a)2,20,000
- b)1,08,000
- c)4,50,000
- d)70,000
- e)90,000
Correct answer is option 'B'. Can you explain this answer?

Most Upvoted Answer
Directions: Study the data carefully to answer the following questions...
Number of bulbs produced in 4 years
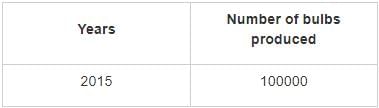
Number of bulbs produced in 2018 = 1,00,000 × (120/100) = 1,20,000
Non defective bulbs = 1,20,000 – 10% of 1,20,000 = 1,08,000
∴ The number of non- defective bulbs produced in 2018 is 1,08,000
Number of bulbs produced in 2018 = 1,00,000 × (120/100) = 1,20,000
Non defective bulbs = 1,20,000 – 10% of 1,20,000 = 1,08,000
∴ The number of non- defective bulbs produced in 2018 is 1,08,000

|
Explore Courses for Banking Exams exam
|
|
Top Courses for Banking ExamsView all


Question Description
Directions: Study the data carefully to answer the following questions:Pie chart represents total bulbs produced in four years.Total number of bulbs produced = 2,00,000Table represents the percentage of defective bulbs produced in different years.Total defective bulbs produced = 50,000Q.Total number of bulbs produced in 2018 is 20% more than the bulbs produced in 2015 and if the percentage of defective bulb is 10% then find the number of non- defective bulbs produced in 2018.a)2,20,000b)1,08,000c)4,50,000d)70,000e)90,000Correct answer is option 'B'. Can you explain this answer? for Banking Exams 2025 is part of Banking Exams preparation. The Question and answers have been prepared according to the Banking Exams exam syllabus. Information about Directions: Study the data carefully to answer the following questions:Pie chart represents total bulbs produced in four years.Total number of bulbs produced = 2,00,000Table represents the percentage of defective bulbs produced in different years.Total defective bulbs produced = 50,000Q.Total number of bulbs produced in 2018 is 20% more than the bulbs produced in 2015 and if the percentage of defective bulb is 10% then find the number of non- defective bulbs produced in 2018.a)2,20,000b)1,08,000c)4,50,000d)70,000e)90,000Correct answer is option 'B'. Can you explain this answer? covers all topics & solutions for Banking Exams 2025 Exam. Find important definitions, questions, meanings, examples, exercises and tests below for Directions: Study the data carefully to answer the following questions:Pie chart represents total bulbs produced in four years.Total number of bulbs produced = 2,00,000Table represents the percentage of defective bulbs produced in different years.Total defective bulbs produced = 50,000Q.Total number of bulbs produced in 2018 is 20% more than the bulbs produced in 2015 and if the percentage of defective bulb is 10% then find the number of non- defective bulbs produced in 2018.a)2,20,000b)1,08,000c)4,50,000d)70,000e)90,000Correct answer is option 'B'. Can you explain this answer?.
Directions: Study the data carefully to answer the following questions:Pie chart represents total bulbs produced in four years.Total number of bulbs produced = 2,00,000Table represents the percentage of defective bulbs produced in different years.Total defective bulbs produced = 50,000Q.Total number of bulbs produced in 2018 is 20% more than the bulbs produced in 2015 and if the percentage of defective bulb is 10% then find the number of non- defective bulbs produced in 2018.a)2,20,000b)1,08,000c)4,50,000d)70,000e)90,000Correct answer is option 'B'. Can you explain this answer? for Banking Exams 2025 is part of Banking Exams preparation. The Question and answers have been prepared according to the Banking Exams exam syllabus. Information about Directions: Study the data carefully to answer the following questions:Pie chart represents total bulbs produced in four years.Total number of bulbs produced = 2,00,000Table represents the percentage of defective bulbs produced in different years.Total defective bulbs produced = 50,000Q.Total number of bulbs produced in 2018 is 20% more than the bulbs produced in 2015 and if the percentage of defective bulb is 10% then find the number of non- defective bulbs produced in 2018.a)2,20,000b)1,08,000c)4,50,000d)70,000e)90,000Correct answer is option 'B'. Can you explain this answer? covers all topics & solutions for Banking Exams 2025 Exam. Find important definitions, questions, meanings, examples, exercises and tests below for Directions: Study the data carefully to answer the following questions:Pie chart represents total bulbs produced in four years.Total number of bulbs produced = 2,00,000Table represents the percentage of defective bulbs produced in different years.Total defective bulbs produced = 50,000Q.Total number of bulbs produced in 2018 is 20% more than the bulbs produced in 2015 and if the percentage of defective bulb is 10% then find the number of non- defective bulbs produced in 2018.a)2,20,000b)1,08,000c)4,50,000d)70,000e)90,000Correct answer is option 'B'. Can you explain this answer?.
Solutions for Directions: Study the data carefully to answer the following questions:Pie chart represents total bulbs produced in four years.Total number of bulbs produced = 2,00,000Table represents the percentage of defective bulbs produced in different years.Total defective bulbs produced = 50,000Q.Total number of bulbs produced in 2018 is 20% more than the bulbs produced in 2015 and if the percentage of defective bulb is 10% then find the number of non- defective bulbs produced in 2018.a)2,20,000b)1,08,000c)4,50,000d)70,000e)90,000Correct answer is option 'B'. Can you explain this answer? in English & in Hindi are available as part of our courses for Banking Exams.
Download more important topics, notes, lectures and mock test series for Banking Exams Exam by signing up for free.
Here you can find the meaning of Directions: Study the data carefully to answer the following questions:Pie chart represents total bulbs produced in four years.Total number of bulbs produced = 2,00,000Table represents the percentage of defective bulbs produced in different years.Total defective bulbs produced = 50,000Q.Total number of bulbs produced in 2018 is 20% more than the bulbs produced in 2015 and if the percentage of defective bulb is 10% then find the number of non- defective bulbs produced in 2018.a)2,20,000b)1,08,000c)4,50,000d)70,000e)90,000Correct answer is option 'B'. Can you explain this answer? defined & explained in the simplest way possible. Besides giving the explanation of
Directions: Study the data carefully to answer the following questions:Pie chart represents total bulbs produced in four years.Total number of bulbs produced = 2,00,000Table represents the percentage of defective bulbs produced in different years.Total defective bulbs produced = 50,000Q.Total number of bulbs produced in 2018 is 20% more than the bulbs produced in 2015 and if the percentage of defective bulb is 10% then find the number of non- defective bulbs produced in 2018.a)2,20,000b)1,08,000c)4,50,000d)70,000e)90,000Correct answer is option 'B'. Can you explain this answer?, a detailed solution for Directions: Study the data carefully to answer the following questions:Pie chart represents total bulbs produced in four years.Total number of bulbs produced = 2,00,000Table represents the percentage of defective bulbs produced in different years.Total defective bulbs produced = 50,000Q.Total number of bulbs produced in 2018 is 20% more than the bulbs produced in 2015 and if the percentage of defective bulb is 10% then find the number of non- defective bulbs produced in 2018.a)2,20,000b)1,08,000c)4,50,000d)70,000e)90,000Correct answer is option 'B'. Can you explain this answer? has been provided alongside types of Directions: Study the data carefully to answer the following questions:Pie chart represents total bulbs produced in four years.Total number of bulbs produced = 2,00,000Table represents the percentage of defective bulbs produced in different years.Total defective bulbs produced = 50,000Q.Total number of bulbs produced in 2018 is 20% more than the bulbs produced in 2015 and if the percentage of defective bulb is 10% then find the number of non- defective bulbs produced in 2018.a)2,20,000b)1,08,000c)4,50,000d)70,000e)90,000Correct answer is option 'B'. Can you explain this answer? theory, EduRev gives you an
ample number of questions to practice Directions: Study the data carefully to answer the following questions:Pie chart represents total bulbs produced in four years.Total number of bulbs produced = 2,00,000Table represents the percentage of defective bulbs produced in different years.Total defective bulbs produced = 50,000Q.Total number of bulbs produced in 2018 is 20% more than the bulbs produced in 2015 and if the percentage of defective bulb is 10% then find the number of non- defective bulbs produced in 2018.a)2,20,000b)1,08,000c)4,50,000d)70,000e)90,000Correct answer is option 'B'. Can you explain this answer? tests, examples and also practice Banking Exams tests.
|
|
Explore Courses for Banking Exams exam
|
|

Signup to solve all Doubts
Signup to see your scores go up within 7 days! Learn & Practice with 1000+ FREE Notes, Videos & Tests.


|
© EduRev
|
Education Revolution
|


|


Signup to see your scores
go up within 7 days!
Access 1000+ FREE Docs, Videos and Tests
Takes less than 10 seconds to signup