


Banking Exams Exam > Banking Exams Questions > Instructions: The pie chart shown below gives...
Start Learning for Free
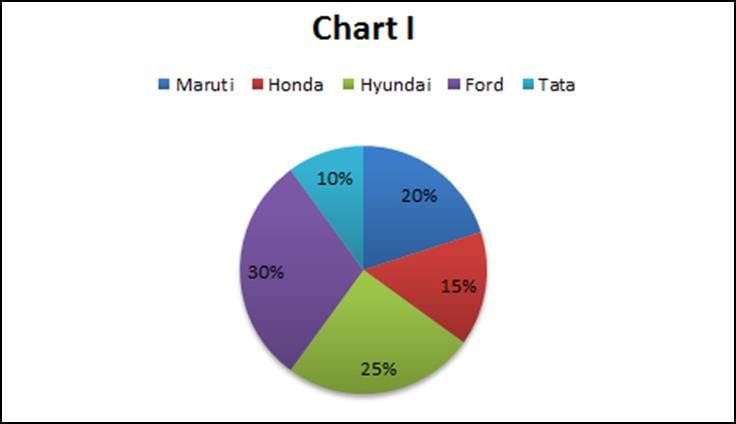
Instructions: The pie chart shown below gives the percentage distribution of car sales (in
numbers) between five companies – Maruti, Honda, Hyundai, Ford and Tata during the year 2014 – 2015. The total number of cars sold by the five companies together in 2014-2015 is four hundred thousand.
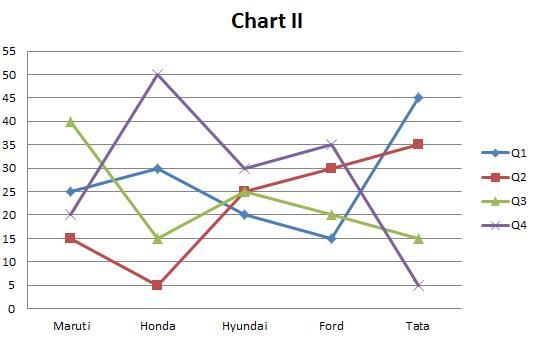
The line graph shown below gives the percentage distribution of the number of cars sold by each of the five companies in the four different Quarters of the year.
numbers) between five companies – Maruti, Honda, Hyundai, Ford and Tata during the year 2014 – 2015. The total number of cars sold by the five companies together in 2014-2015 is four hundred thousand.
The line graph shown below gives the percentage distribution of the number of cars sold by each of the five companies in the four different Quarters of the year.
Q. Which company sold the highest number of cars in the second quarter?
- a)Ford
- b)Maruti
- c)Honda
- d)Hyundai
Correct answer is option 'A'. Can you explain this answer?

Verified Answer
Instructions: The pie chart shown below gives the percentage distribut...
The data given in the pie chart and the line chart can be tabulated into the following table (Data is in 000’s):
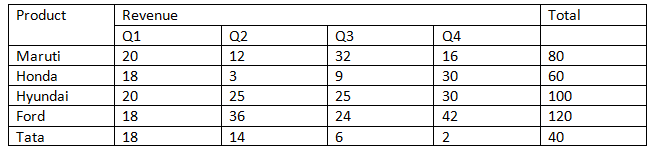
From the table, we can see that Ford sold the highest number of cars in the second quarter.
From the table, we can see that Ford sold the highest number of cars in the second quarter.

|
Explore Courses for Banking Exams exam
|
|
Top Courses for Banking ExamsView all


Question Description
Instructions: The pie chart shown below gives the percentage distribution of car sales (innumbers) between five companies – Maruti, Honda, Hyundai, Ford and Tata during the year 2014 – 2015. The total number of cars sold by the five companies together in 2014-2015 is four hundred thousand.The line graph shown below gives the percentage distribution of the number of cars sold by each of the five companies in the four different Quarters of the year.Q.Which company sold the highest number of cars in the second quarter?a)Fordb)Marutic)Hondad)HyundaiCorrect answer is option 'A'. Can you explain this answer? for Banking Exams 2025 is part of Banking Exams preparation. The Question and answers have been prepared according to the Banking Exams exam syllabus. Information about Instructions: The pie chart shown below gives the percentage distribution of car sales (innumbers) between five companies – Maruti, Honda, Hyundai, Ford and Tata during the year 2014 – 2015. The total number of cars sold by the five companies together in 2014-2015 is four hundred thousand.The line graph shown below gives the percentage distribution of the number of cars sold by each of the five companies in the four different Quarters of the year.Q.Which company sold the highest number of cars in the second quarter?a)Fordb)Marutic)Hondad)HyundaiCorrect answer is option 'A'. Can you explain this answer? covers all topics & solutions for Banking Exams 2025 Exam. Find important definitions, questions, meanings, examples, exercises and tests below for Instructions: The pie chart shown below gives the percentage distribution of car sales (innumbers) between five companies – Maruti, Honda, Hyundai, Ford and Tata during the year 2014 – 2015. The total number of cars sold by the five companies together in 2014-2015 is four hundred thousand.The line graph shown below gives the percentage distribution of the number of cars sold by each of the five companies in the four different Quarters of the year.Q.Which company sold the highest number of cars in the second quarter?a)Fordb)Marutic)Hondad)HyundaiCorrect answer is option 'A'. Can you explain this answer?.
Instructions: The pie chart shown below gives the percentage distribution of car sales (innumbers) between five companies – Maruti, Honda, Hyundai, Ford and Tata during the year 2014 – 2015. The total number of cars sold by the five companies together in 2014-2015 is four hundred thousand.The line graph shown below gives the percentage distribution of the number of cars sold by each of the five companies in the four different Quarters of the year.Q.Which company sold the highest number of cars in the second quarter?a)Fordb)Marutic)Hondad)HyundaiCorrect answer is option 'A'. Can you explain this answer? for Banking Exams 2025 is part of Banking Exams preparation. The Question and answers have been prepared according to the Banking Exams exam syllabus. Information about Instructions: The pie chart shown below gives the percentage distribution of car sales (innumbers) between five companies – Maruti, Honda, Hyundai, Ford and Tata during the year 2014 – 2015. The total number of cars sold by the five companies together in 2014-2015 is four hundred thousand.The line graph shown below gives the percentage distribution of the number of cars sold by each of the five companies in the four different Quarters of the year.Q.Which company sold the highest number of cars in the second quarter?a)Fordb)Marutic)Hondad)HyundaiCorrect answer is option 'A'. Can you explain this answer? covers all topics & solutions for Banking Exams 2025 Exam. Find important definitions, questions, meanings, examples, exercises and tests below for Instructions: The pie chart shown below gives the percentage distribution of car sales (innumbers) between five companies – Maruti, Honda, Hyundai, Ford and Tata during the year 2014 – 2015. The total number of cars sold by the five companies together in 2014-2015 is four hundred thousand.The line graph shown below gives the percentage distribution of the number of cars sold by each of the five companies in the four different Quarters of the year.Q.Which company sold the highest number of cars in the second quarter?a)Fordb)Marutic)Hondad)HyundaiCorrect answer is option 'A'. Can you explain this answer?.
Solutions for Instructions: The pie chart shown below gives the percentage distribution of car sales (innumbers) between five companies – Maruti, Honda, Hyundai, Ford and Tata during the year 2014 – 2015. The total number of cars sold by the five companies together in 2014-2015 is four hundred thousand.The line graph shown below gives the percentage distribution of the number of cars sold by each of the five companies in the four different Quarters of the year.Q.Which company sold the highest number of cars in the second quarter?a)Fordb)Marutic)Hondad)HyundaiCorrect answer is option 'A'. Can you explain this answer? in English & in Hindi are available as part of our courses for Banking Exams.
Download more important topics, notes, lectures and mock test series for Banking Exams Exam by signing up for free.
Here you can find the meaning of Instructions: The pie chart shown below gives the percentage distribution of car sales (innumbers) between five companies – Maruti, Honda, Hyundai, Ford and Tata during the year 2014 – 2015. The total number of cars sold by the five companies together in 2014-2015 is four hundred thousand.The line graph shown below gives the percentage distribution of the number of cars sold by each of the five companies in the four different Quarters of the year.Q.Which company sold the highest number of cars in the second quarter?a)Fordb)Marutic)Hondad)HyundaiCorrect answer is option 'A'. Can you explain this answer? defined & explained in the simplest way possible. Besides giving the explanation of
Instructions: The pie chart shown below gives the percentage distribution of car sales (innumbers) between five companies – Maruti, Honda, Hyundai, Ford and Tata during the year 2014 – 2015. The total number of cars sold by the five companies together in 2014-2015 is four hundred thousand.The line graph shown below gives the percentage distribution of the number of cars sold by each of the five companies in the four different Quarters of the year.Q.Which company sold the highest number of cars in the second quarter?a)Fordb)Marutic)Hondad)HyundaiCorrect answer is option 'A'. Can you explain this answer?, a detailed solution for Instructions: The pie chart shown below gives the percentage distribution of car sales (innumbers) between five companies – Maruti, Honda, Hyundai, Ford and Tata during the year 2014 – 2015. The total number of cars sold by the five companies together in 2014-2015 is four hundred thousand.The line graph shown below gives the percentage distribution of the number of cars sold by each of the five companies in the four different Quarters of the year.Q.Which company sold the highest number of cars in the second quarter?a)Fordb)Marutic)Hondad)HyundaiCorrect answer is option 'A'. Can you explain this answer? has been provided alongside types of Instructions: The pie chart shown below gives the percentage distribution of car sales (innumbers) between five companies – Maruti, Honda, Hyundai, Ford and Tata during the year 2014 – 2015. The total number of cars sold by the five companies together in 2014-2015 is four hundred thousand.The line graph shown below gives the percentage distribution of the number of cars sold by each of the five companies in the four different Quarters of the year.Q.Which company sold the highest number of cars in the second quarter?a)Fordb)Marutic)Hondad)HyundaiCorrect answer is option 'A'. Can you explain this answer? theory, EduRev gives you an
ample number of questions to practice Instructions: The pie chart shown below gives the percentage distribution of car sales (innumbers) between five companies – Maruti, Honda, Hyundai, Ford and Tata during the year 2014 – 2015. The total number of cars sold by the five companies together in 2014-2015 is four hundred thousand.The line graph shown below gives the percentage distribution of the number of cars sold by each of the five companies in the four different Quarters of the year.Q.Which company sold the highest number of cars in the second quarter?a)Fordb)Marutic)Hondad)HyundaiCorrect answer is option 'A'. Can you explain this answer? tests, examples and also practice Banking Exams tests.
|
|
Explore Courses for Banking Exams exam
|
|

Signup for Free!
Signup to see your scores go up within 7 days! Learn & Practice with 1000+ FREE Notes, Videos & Tests.
|
© EduRev
|
Education Revolution
|


|


Signup on EduRev and stay on top of your study goals
10M+ students crushing their study goals daily