


CLAT Exam > CLAT Questions > The pie chart given below shows the percenta...
Start Learning for Free
The pie chart given below shows the percentage of print space allocation of articles printed on different sections of a newspaper.
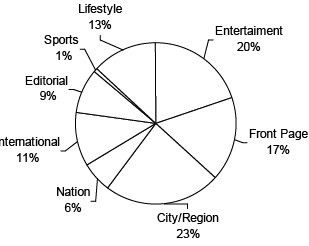
Q. What percentage of the total space allocation has been earmarked for 'City/ Region', 'Nation' and 'International' news cumulatively?
- a)50%
- b)29%
- c)40%
- d)34%
Correct answer is option 'C'. Can you explain this answer?

Verified Answer
The pie chart given below shows the percentage of print space allocat...
The correct answer is (c) - 40%, because the total space allocation earmarked for 'City/ Region', 'Nation' and 'International' news is the sum of 23%, 6% and 11% which is 40%.
View all questions of this test

|
Explore Courses for CLAT exam
|
|
Similar CLAT Doubts


Top Courses for CLATView all


Question Description
The pie chart given below shows the percentage of print space allocation of articles printed on different sections of a newspaper.Q. What percentage of the total space allocation has been earmarked for 'City/ Region', 'Nation' and 'International' news cumulatively?a)50%b)29%c)40%d)34%Correct answer is option 'C'. Can you explain this answer? for CLAT 2025 is part of CLAT preparation. The Question and answers have been prepared according to the CLAT exam syllabus. Information about The pie chart given below shows the percentage of print space allocation of articles printed on different sections of a newspaper.Q. What percentage of the total space allocation has been earmarked for 'City/ Region', 'Nation' and 'International' news cumulatively?a)50%b)29%c)40%d)34%Correct answer is option 'C'. Can you explain this answer? covers all topics & solutions for CLAT 2025 Exam. Find important definitions, questions, meanings, examples, exercises and tests below for The pie chart given below shows the percentage of print space allocation of articles printed on different sections of a newspaper.Q. What percentage of the total space allocation has been earmarked for 'City/ Region', 'Nation' and 'International' news cumulatively?a)50%b)29%c)40%d)34%Correct answer is option 'C'. Can you explain this answer?.
The pie chart given below shows the percentage of print space allocation of articles printed on different sections of a newspaper.Q. What percentage of the total space allocation has been earmarked for 'City/ Region', 'Nation' and 'International' news cumulatively?a)50%b)29%c)40%d)34%Correct answer is option 'C'. Can you explain this answer? for CLAT 2025 is part of CLAT preparation. The Question and answers have been prepared according to the CLAT exam syllabus. Information about The pie chart given below shows the percentage of print space allocation of articles printed on different sections of a newspaper.Q. What percentage of the total space allocation has been earmarked for 'City/ Region', 'Nation' and 'International' news cumulatively?a)50%b)29%c)40%d)34%Correct answer is option 'C'. Can you explain this answer? covers all topics & solutions for CLAT 2025 Exam. Find important definitions, questions, meanings, examples, exercises and tests below for The pie chart given below shows the percentage of print space allocation of articles printed on different sections of a newspaper.Q. What percentage of the total space allocation has been earmarked for 'City/ Region', 'Nation' and 'International' news cumulatively?a)50%b)29%c)40%d)34%Correct answer is option 'C'. Can you explain this answer?.
Solutions for The pie chart given below shows the percentage of print space allocation of articles printed on different sections of a newspaper.Q. What percentage of the total space allocation has been earmarked for 'City/ Region', 'Nation' and 'International' news cumulatively?a)50%b)29%c)40%d)34%Correct answer is option 'C'. Can you explain this answer? in English & in Hindi are available as part of our courses for CLAT.
Download more important topics, notes, lectures and mock test series for CLAT Exam by signing up for free.
Here you can find the meaning of The pie chart given below shows the percentage of print space allocation of articles printed on different sections of a newspaper.Q. What percentage of the total space allocation has been earmarked for 'City/ Region', 'Nation' and 'International' news cumulatively?a)50%b)29%c)40%d)34%Correct answer is option 'C'. Can you explain this answer? defined & explained in the simplest way possible. Besides giving the explanation of
The pie chart given below shows the percentage of print space allocation of articles printed on different sections of a newspaper.Q. What percentage of the total space allocation has been earmarked for 'City/ Region', 'Nation' and 'International' news cumulatively?a)50%b)29%c)40%d)34%Correct answer is option 'C'. Can you explain this answer?, a detailed solution for The pie chart given below shows the percentage of print space allocation of articles printed on different sections of a newspaper.Q. What percentage of the total space allocation has been earmarked for 'City/ Region', 'Nation' and 'International' news cumulatively?a)50%b)29%c)40%d)34%Correct answer is option 'C'. Can you explain this answer? has been provided alongside types of The pie chart given below shows the percentage of print space allocation of articles printed on different sections of a newspaper.Q. What percentage of the total space allocation has been earmarked for 'City/ Region', 'Nation' and 'International' news cumulatively?a)50%b)29%c)40%d)34%Correct answer is option 'C'. Can you explain this answer? theory, EduRev gives you an
ample number of questions to practice The pie chart given below shows the percentage of print space allocation of articles printed on different sections of a newspaper.Q. What percentage of the total space allocation has been earmarked for 'City/ Region', 'Nation' and 'International' news cumulatively?a)50%b)29%c)40%d)34%Correct answer is option 'C'. Can you explain this answer? tests, examples and also practice CLAT tests.
|
|
Explore Courses for CLAT exam
|
|

Signup to solve all Doubts
Signup to see your scores go up within 7 days! Learn & Practice with 1000+ FREE Notes, Videos & Tests.


|
© EduRev
|
Education Revolution
|


|


Signup to see your scores
go up within 7 days!
Access 1000+ FREE Docs, Videos and Tests
Takes less than 10 seconds to signup