


Class 9 Exam > Class 9 Questions > A frequency polygon is drawn for the followin...
Start Learning for Free
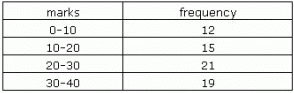
A frequency polygon is drawn for the following data. So the x-coordinate of the point having y coordinate as 21 is
- a)30
- b)20
- c)25
- d)35
Correct answer is option 'C'. Can you explain this answer?

Most Upvoted Answer
A frequency polygon is drawn for the following data. So the x-coordina...
A frequency polygon is made by joining the mid points of each bar of a histogram along with 2 imaginary class intervals. Hence, for any point on a frequency polygon the y co-ordinate is the frequency and x co - ordinate is the Class Mark of the interval. In this case, the class mark of the interval 20-30 is 25.
Free Test
FREE
| Start Free Test |
Community Answer
A frequency polygon is drawn for the following data. So the x-coordina...
A frequency polygon is made by joining the mid points of each bar of a histogram along with 2 imaginary class intervals. Hence, for any point on a frequency polygon the y co-ordinate is the frequency and x co - ordinate is the Class Mark of the interval. In this case, the class mark of the interval 20-30 is 25 . Therefore the correct option is 'c'.
If this helps you please upvote and follow
If this helps you please upvote and follow

|
Explore Courses for Class 9 exam
|
|
Top Courses for Class 9View all


Question Description
A frequency polygon is drawn for the following data. So the x-coordinate of the point having y coordinate as 21 isa)30b)20c)25d)35Correct answer is option 'C'. Can you explain this answer? for Class 9 2025 is part of Class 9 preparation. The Question and answers have been prepared according to the Class 9 exam syllabus. Information about A frequency polygon is drawn for the following data. So the x-coordinate of the point having y coordinate as 21 isa)30b)20c)25d)35Correct answer is option 'C'. Can you explain this answer? covers all topics & solutions for Class 9 2025 Exam. Find important definitions, questions, meanings, examples, exercises and tests below for A frequency polygon is drawn for the following data. So the x-coordinate of the point having y coordinate as 21 isa)30b)20c)25d)35Correct answer is option 'C'. Can you explain this answer?.
A frequency polygon is drawn for the following data. So the x-coordinate of the point having y coordinate as 21 isa)30b)20c)25d)35Correct answer is option 'C'. Can you explain this answer? for Class 9 2025 is part of Class 9 preparation. The Question and answers have been prepared according to the Class 9 exam syllabus. Information about A frequency polygon is drawn for the following data. So the x-coordinate of the point having y coordinate as 21 isa)30b)20c)25d)35Correct answer is option 'C'. Can you explain this answer? covers all topics & solutions for Class 9 2025 Exam. Find important definitions, questions, meanings, examples, exercises and tests below for A frequency polygon is drawn for the following data. So the x-coordinate of the point having y coordinate as 21 isa)30b)20c)25d)35Correct answer is option 'C'. Can you explain this answer?.
Solutions for A frequency polygon is drawn for the following data. So the x-coordinate of the point having y coordinate as 21 isa)30b)20c)25d)35Correct answer is option 'C'. Can you explain this answer? in English & in Hindi are available as part of our courses for Class 9.
Download more important topics, notes, lectures and mock test series for Class 9 Exam by signing up for free.
Here you can find the meaning of A frequency polygon is drawn for the following data. So the x-coordinate of the point having y coordinate as 21 isa)30b)20c)25d)35Correct answer is option 'C'. Can you explain this answer? defined & explained in the simplest way possible. Besides giving the explanation of
A frequency polygon is drawn for the following data. So the x-coordinate of the point having y coordinate as 21 isa)30b)20c)25d)35Correct answer is option 'C'. Can you explain this answer?, a detailed solution for A frequency polygon is drawn for the following data. So the x-coordinate of the point having y coordinate as 21 isa)30b)20c)25d)35Correct answer is option 'C'. Can you explain this answer? has been provided alongside types of A frequency polygon is drawn for the following data. So the x-coordinate of the point having y coordinate as 21 isa)30b)20c)25d)35Correct answer is option 'C'. Can you explain this answer? theory, EduRev gives you an
ample number of questions to practice A frequency polygon is drawn for the following data. So the x-coordinate of the point having y coordinate as 21 isa)30b)20c)25d)35Correct answer is option 'C'. Can you explain this answer? tests, examples and also practice Class 9 tests.
|
|
Explore Courses for Class 9 exam
|
|

Signup for Free!
Signup to see your scores go up within 7 days! Learn & Practice with 1000+ FREE Notes, Videos & Tests.
|
© EduRev
|
Education Revolution
|


|


Signup to see your scores
go up within 7 days!
Access 1000+ FREE Docs, Videos and Tests
Takes less than 10 seconds to signup