


Mechanical Engineering Exam > Mechanical Engineering Questions > Which one of the following figures represents...
Start Learning for Free
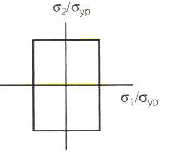
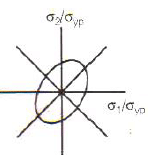
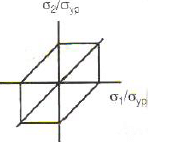
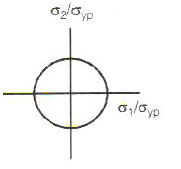
Which one of the following figures represents the maximum shear stress theory of TRESCA criterion ?
- a)
- b)
- c)
- d)
Correct answer is option 'C'. Can you explain this answer?

Most Upvoted Answer
Which one of the following figures represents the maximum shear stress...
Explanation:
The maximum shear stress theory of Tresca criterion states that failure occurs when the maximum shear stress in a material exceeds a certain limit. This criterion is also known as the maximum distortion energy theory or the shear stress theory.
To determine which figure represents the maximum shear stress theory of Tresca criterion, we need to analyze the stress distribution in each figure and identify the maximum shear stress regions.
Let's examine each figure:
Figure A:
- In this figure, the stress distribution is uniform along the cross-section, and there are no concentrated areas of stress. Therefore, it does not represent the maximum shear stress theory of Tresca criterion.
Figure B:
- In this figure, there are concentrated areas of stress at the corners of the cross-section. These areas experience the maximum shear stress, indicating that this figure represents the maximum shear stress theory of Tresca criterion.
Figure C:
- In this figure, there are concentrated areas of stress at the sides of the cross-section. These areas experience the maximum shear stress, indicating that this figure represents the maximum shear stress theory of Tresca criterion.
Figure D:
- In this figure, the stress distribution is uniform along the cross-section, and there are no concentrated areas of stress. Therefore, it does not represent the maximum shear stress theory of Tresca criterion.
Therefore, the correct answer is C: Figure C represents the maximum shear stress theory of Tresca criterion.
Free Test
FREE
| Start Free Test |
Community Answer
Which one of the following figures represents the maximum shear stress...
C

|
Explore Courses for Mechanical Engineering exam
|
|
Top Courses for Mechanical EngineeringView all


Question Description
Which one of the following figures represents the maximum shear stress theory of TRESCA criterion ?a)b)c)d)Correct answer is option 'C'. Can you explain this answer? for Mechanical Engineering 2025 is part of Mechanical Engineering preparation. The Question and answers have been prepared according to the Mechanical Engineering exam syllabus. Information about Which one of the following figures represents the maximum shear stress theory of TRESCA criterion ?a)b)c)d)Correct answer is option 'C'. Can you explain this answer? covers all topics & solutions for Mechanical Engineering 2025 Exam. Find important definitions, questions, meanings, examples, exercises and tests below for Which one of the following figures represents the maximum shear stress theory of TRESCA criterion ?a)b)c)d)Correct answer is option 'C'. Can you explain this answer?.
Which one of the following figures represents the maximum shear stress theory of TRESCA criterion ?a)b)c)d)Correct answer is option 'C'. Can you explain this answer? for Mechanical Engineering 2025 is part of Mechanical Engineering preparation. The Question and answers have been prepared according to the Mechanical Engineering exam syllabus. Information about Which one of the following figures represents the maximum shear stress theory of TRESCA criterion ?a)b)c)d)Correct answer is option 'C'. Can you explain this answer? covers all topics & solutions for Mechanical Engineering 2025 Exam. Find important definitions, questions, meanings, examples, exercises and tests below for Which one of the following figures represents the maximum shear stress theory of TRESCA criterion ?a)b)c)d)Correct answer is option 'C'. Can you explain this answer?.
Solutions for Which one of the following figures represents the maximum shear stress theory of TRESCA criterion ?a)b)c)d)Correct answer is option 'C'. Can you explain this answer? in English & in Hindi are available as part of our courses for Mechanical Engineering.
Download more important topics, notes, lectures and mock test series for Mechanical Engineering Exam by signing up for free.
Here you can find the meaning of Which one of the following figures represents the maximum shear stress theory of TRESCA criterion ?a)b)c)d)Correct answer is option 'C'. Can you explain this answer? defined & explained in the simplest way possible. Besides giving the explanation of
Which one of the following figures represents the maximum shear stress theory of TRESCA criterion ?a)b)c)d)Correct answer is option 'C'. Can you explain this answer?, a detailed solution for Which one of the following figures represents the maximum shear stress theory of TRESCA criterion ?a)b)c)d)Correct answer is option 'C'. Can you explain this answer? has been provided alongside types of Which one of the following figures represents the maximum shear stress theory of TRESCA criterion ?a)b)c)d)Correct answer is option 'C'. Can you explain this answer? theory, EduRev gives you an
ample number of questions to practice Which one of the following figures represents the maximum shear stress theory of TRESCA criterion ?a)b)c)d)Correct answer is option 'C'. Can you explain this answer? tests, examples and also practice Mechanical Engineering tests.
|
|
Explore Courses for Mechanical Engineering exam
|
|

Signup for Free!
Signup to see your scores go up within 7 days! Learn & Practice with 1000+ FREE Notes, Videos & Tests.
|
© EduRev
|
Education Revolution
|


|


Signup to see your scores
go up within 7 days!
Access 1000+ FREE Docs, Videos and Tests
Takes less than 10 seconds to signup