


Chemistry Exam > Chemistry Questions > Which of the fo llowing plots represent(s) th...
Start Learning for Free
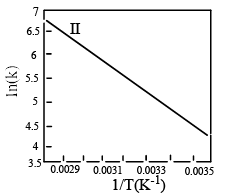
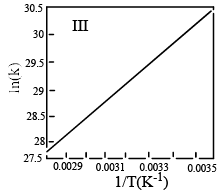
Which of the fo llowing plots represent(s) the Arrhenius rate equation, k=Ae–Ea/RT with  and
and 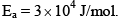
and 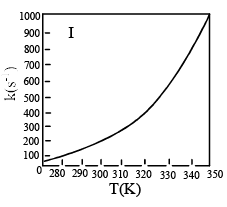
- a)I
- b)II
- c)III
- d)I and II
Correct answer is option 'D'. Can you explain this answer?

Most Upvoted Answer
Which of the fo llowing plots represent(s) the Arrhenius rate equation...
I think the answer should be A. Although both plots I and II are correct, but if you go with the values then the straight line plot II doesn't agree with the activation energy and frequency factor values(verify it with y intercept = lnA and slope = -Ea/R).
Free Test
FREE
| Start Free Test |
Community Answer
Which of the fo llowing plots represent(s) the Arrhenius rate equation...
Option D is correct as the exponential graph will be there in I and the negative slope will be there in II

|
Explore Courses for Chemistry exam
|
|
Top Courses for ChemistryView all


Question Description
Which of the fo llowing plots represent(s) the Arrhenius rate equation, k=Ae–Ea/RT with and a)Ib)IIc)IIId)I and IICorrect answer is option 'D'. Can you explain this answer? for Chemistry 2025 is part of Chemistry preparation. The Question and answers have been prepared according to the Chemistry exam syllabus. Information about Which of the fo llowing plots represent(s) the Arrhenius rate equation, k=Ae–Ea/RT with and a)Ib)IIc)IIId)I and IICorrect answer is option 'D'. Can you explain this answer? covers all topics & solutions for Chemistry 2025 Exam. Find important definitions, questions, meanings, examples, exercises and tests below for Which of the fo llowing plots represent(s) the Arrhenius rate equation, k=Ae–Ea/RT with and a)Ib)IIc)IIId)I and IICorrect answer is option 'D'. Can you explain this answer?.
Which of the fo llowing plots represent(s) the Arrhenius rate equation, k=Ae–Ea/RT with and a)Ib)IIc)IIId)I and IICorrect answer is option 'D'. Can you explain this answer? for Chemistry 2025 is part of Chemistry preparation. The Question and answers have been prepared according to the Chemistry exam syllabus. Information about Which of the fo llowing plots represent(s) the Arrhenius rate equation, k=Ae–Ea/RT with and a)Ib)IIc)IIId)I and IICorrect answer is option 'D'. Can you explain this answer? covers all topics & solutions for Chemistry 2025 Exam. Find important definitions, questions, meanings, examples, exercises and tests below for Which of the fo llowing plots represent(s) the Arrhenius rate equation, k=Ae–Ea/RT with and a)Ib)IIc)IIId)I and IICorrect answer is option 'D'. Can you explain this answer?.
Solutions for Which of the fo llowing plots represent(s) the Arrhenius rate equation, k=Ae–Ea/RT with and a)Ib)IIc)IIId)I and IICorrect answer is option 'D'. Can you explain this answer? in English & in Hindi are available as part of our courses for Chemistry.
Download more important topics, notes, lectures and mock test series for Chemistry Exam by signing up for free.
Here you can find the meaning of Which of the fo llowing plots represent(s) the Arrhenius rate equation, k=Ae–Ea/RT with and a)Ib)IIc)IIId)I and IICorrect answer is option 'D'. Can you explain this answer? defined & explained in the simplest way possible. Besides giving the explanation of
Which of the fo llowing plots represent(s) the Arrhenius rate equation, k=Ae–Ea/RT with and a)Ib)IIc)IIId)I and IICorrect answer is option 'D'. Can you explain this answer?, a detailed solution for Which of the fo llowing plots represent(s) the Arrhenius rate equation, k=Ae–Ea/RT with and a)Ib)IIc)IIId)I and IICorrect answer is option 'D'. Can you explain this answer? has been provided alongside types of Which of the fo llowing plots represent(s) the Arrhenius rate equation, k=Ae–Ea/RT with and a)Ib)IIc)IIId)I and IICorrect answer is option 'D'. Can you explain this answer? theory, EduRev gives you an
ample number of questions to practice Which of the fo llowing plots represent(s) the Arrhenius rate equation, k=Ae–Ea/RT with and a)Ib)IIc)IIId)I and IICorrect answer is option 'D'. Can you explain this answer? tests, examples and also practice Chemistry tests.
|
|
Explore Courses for Chemistry exam
|
|

Signup for Free!
Signup to see your scores go up within 7 days! Learn & Practice with 1000+ FREE Notes, Videos & Tests.
|
© EduRev
|
Education Revolution
|


|


Signup on EduRev and stay on top of your study goals
10M+ students crushing their study goals daily