Statistics Chapter Notes | Mathematics Class 10 (Maharashtra SSC Board) PDF Download
| Table of contents |
|
| Mean |
|
| Median |
|
| Mode |
|
| Cumulative Frequency Chart |
|
| Empirical Formula between Mode, Mean and Median |
|

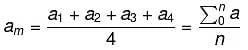
Mean
The mean value of a variable is defined as the sum of all the values of the variable divided by the number of values.
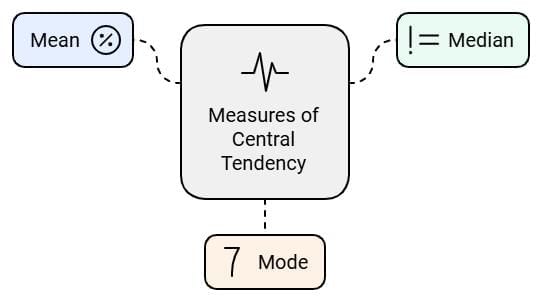
Median
The median of a set of data values is the middle value of the data set when it has been arranged in ascending order. That is, from the smallest value to the highest value
Median is calculated as:

Where n is the number of values in the data.
If the number of values in the data set is even, then the median is the average of the two middle-value.
Mode
Mode of statistical data is the value of that variable that has the maximum frequency.
Mean for Ungroup Frequency Table
Here is the ungroup frequency table:
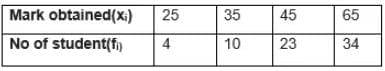 Mean is given by:
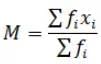
Greek letter ∑ (capital sigma) means summation.
Mean for Group Frequency Table
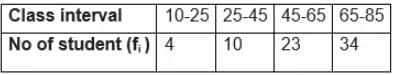 In this distribution, it is assumed that the frequency of each class interval is centered around its mid-point i.e class marks.
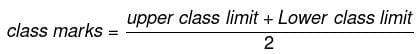
Mean can be calculated using three methods:
(a) Direct Method This method can be very calculation-intensive if the values of f and x are large. We have big calculations and chance of making mistake is quite high
Steps involved in finding the mean using Direct Method
- Prepare a frequency table with the help of class marks
- Multiply fi and xi and find the sum of it.
- Use the above formula and find the mean.
Example: The following table shows the weights of 10 children: 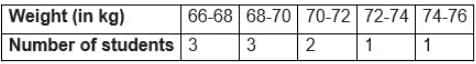
Find the mean by using the direct method.
Sol: 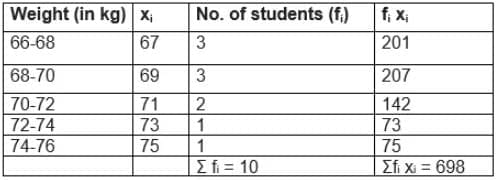 So, Mean would be
=698/10 = 69.8 kg.
(b) Assumed Mean Method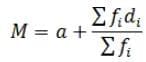
Where
a= Assumed Mean
di = xi –a
This method is quite useful when the values of f and x are large. It makes the calculation easier. In this method, we take some assumed mean calculate the deviation from it and then calculate the mean using the above formula.
Steps involved in finding the mean using the Assumed Mean Method
- Prepare a frequency table.
- Choose A and take deviations ui = (xi -a)/h of the values of xi .
- Multiply fi ui and find the sum of it.
- Use the above formula and find the mean.
Example: The following table shows the weights of 10 children:
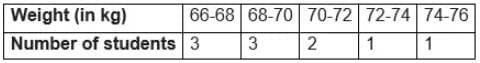
Find the mean by using Assumed Mean method.
Sol:
Let the assumed mean = A = 71
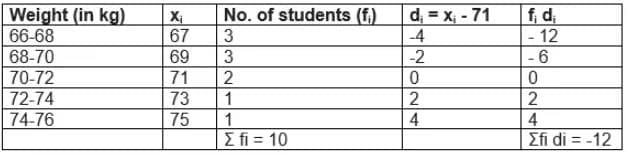
So, Mean would be
= 71-12/10 = 69.8 kg
c) Step Deviation Method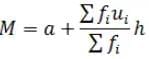
Where
a= Assumed mean
ui = (xi –a)/h
This method is quite useful when the values of f and x are large. It makes the calculation further easier by dividing the deviation from the common factor.
Steps involved in finding the mean using Step Deviation Method
- Prepare a frequency table.
- Choose A and h and take ui = (xi –a)/h of the values of xi .
- Multiply fi u i and find the sum of it.
- Use the above formula and find the mean.
Example: The following table shows the weights of 10 children:
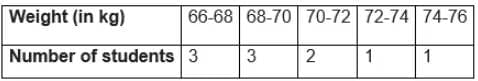
Find the mean by using Step Deviation method.
Sol:
Let the assumed mean = A = 71 and h=2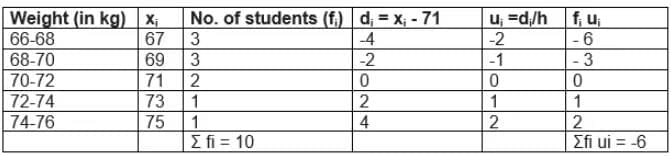
So, Mean would be
=71+ (-6/10) 2 = 69.8 kg
Mode for Grouped Frequency Table
Modal Class: The class interval having highest frequency is called the modal class and Mode is obtained using the modal class
Mode formula is given as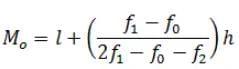
Where
l = lower limit of the modal class,
h = size of the class interval (assuming all class sizes to be equal),
f1 = frequency of the modal class,
f0 = frequency of the class preceding the modal class,
f2 = frequency of the class succeeding the modal class.
Example: The following table shows the ages of the patients admitted in a hospital during a year
 Find the mode.
Sol:
Modal class = 35 – 45, l = 35, class width (h) = 10, f1 = 23, f0 = 21 and f2 = 14
Substituting the values in the Mode formula given above we get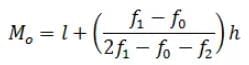
Mode= 36.8 year
Cumulative Frequency Chart
The cumulative frequency of a class is the frequency obtained by adding the frequencies of all the classes preceding the given class.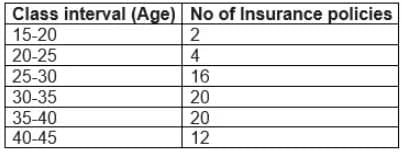 Cumulative Frequency chart will be like
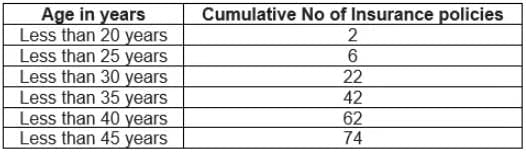
The above table cumulative frequency distribution of the less than type. We can similary make it like below
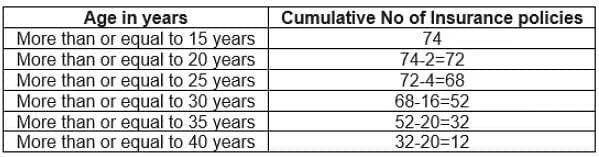
The table above is called a cumulative frequency distribution of the more than type.
Median of a Grouped Data Frequency Table
How to find Median of a grouped data frequency table
- For the given data, we need to have class interval, frequency distribution and cumulative frequency distribution
- Then we need to find the median class
How to find the median class
(a) we find the cumulative frequencies of all the classes and n/2
(b)We now locate the class whose cumulative frequency is greater than (and nearest to) n/2
(c)That class is called the median class - Median is calculated as per the below formula
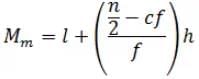
Where
l = lower limit of median class,
n = number of observations,
cf = cumulative frequency of class preceding the median class,
f = frequency of median class,
h = class size (assuming class size to be equal)
Example: A survey regarding the heights (in cm) of 60 girls of a school was conducted and the following data was obtained:
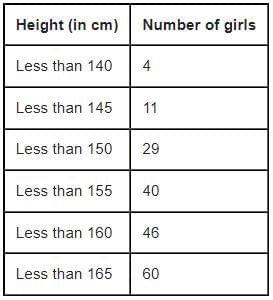
Find the median height.
Sol:
To calculate the median height, we need to find the class intervals and their corresponding frequencies.
The given distribution being of the less than type, 140, 145, 150, . . ., 165 given the upper limits of the corresponding class intervals. So, the classes should be below 140, 140 - 145, 145 - 150, . . ., 160 - 165. Observe that from the given distribution, we find that there are 4 girls with height less than 140, i.e., the frequency of class interval below 140 is 4 . Now, there are 11 girls with heights less than 145 and 4 girls with height less than 140. Therefore, the number of girls with height in the interval 140-145 will be 11-4=7. Similarly, other can be calculated
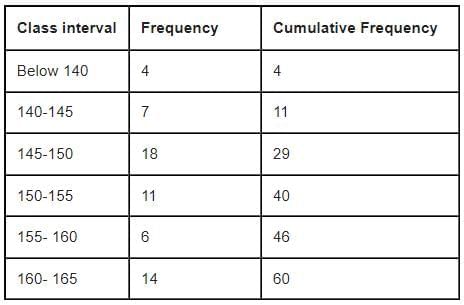
So, n =60 and n/2=30 And cumulative frequency which is greater than and nearest to 30 is 40 , So median class 150-155
l (the lower limit) = 150,
cf (the cumulative frequency of the class preceding 150 - 155) = 29,
f (the frequency of the median class 150 - 151) = 11,
h (the class size) = 5.
Now by Median Formula
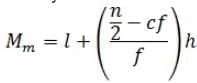
= 150 + [(30-29)/11]5
=150.45 cm
Empirical Formula between Mode, Mean and Median
Empirical Formula between Mode, Mean and Median is given as 3 Median=Mode +2 Mean
Graphical Representation of Cummulative Frequency Distribution
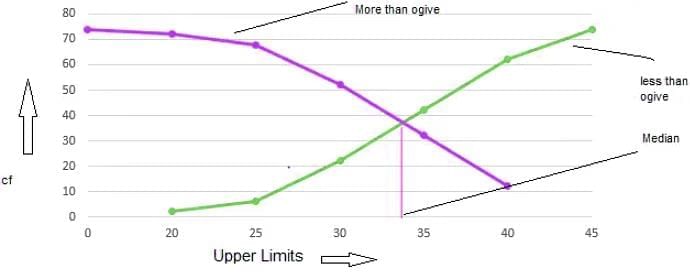
We can represent Cummulative frequency distribution on the graph also. To represent the data in the table graphically, we mark the upper limits of the class intervals on the horizontal axis (x-axis) and their corresponding cumulative frequencies on the vertical axis (y-axis), choosing a convenient scale.
When we draw the graph for the cumulative frequency distribution of the less than type. The curve we get is called a cumulative frequency curve, or an ogive (of the less than type).
When we draw the graph for the cumulative frequency distribution of the more than type. The curve we get is called a cumulative frequency curve, or an ogive (of the more than type).
When we plot both these curve on the same axis, The two ogives will intersect each other at a point. From this point, if we draw a perpendicular on the x-axis, the point at which it cuts the x-axis gives us the median
|
26 videos|208 docs|38 tests
|
FAQs on Statistics Chapter Notes - Mathematics Class 10 (Maharashtra SSC Board)
| 1. What is the difference between mean, median, and mode in statistics? |  |
| 2. How do you construct a cumulative frequency chart? | |
| 3. What is the empirical relationship between mean, median, and mode? | |
| 4. What are the advantages of using median over mean? | |
| 5. In what situations would you use mode as a measure of central tendency? | |


ppt
,MCQs
,video lectures
,Important questions
,past year papers
,Previous Year Questions with Solutions
,Summary
,shortcuts and tricks
,practice quizzes
,Statistics Chapter Notes | Mathematics Class 10 (Maharashtra SSC Board)
,Statistics Chapter Notes | Mathematics Class 10 (Maharashtra SSC Board)
,Extra Questions
,Semester Notes
,study material
,Sample Paper
,Exam
,Free
,Viva Questions
,mock tests for examination
,Objective type Questions
,Statistics Chapter Notes | Mathematics Class 10 (Maharashtra SSC Board)
;


Chapter Notes: Statistics Free PDF Download
Importance of Chapter Notes: Statistics
Chapter Notes: Statistics
Chapter Notes: Statistics Class 10 Questions
Study Chapter Notes: Statistics on the App
|
© EduRev
|
Education Revolution
|


|


