Use of Statistical Tools Class 11 Economics
| Table of contents |

|
| Introduction |

|
| Steps in Making a Project |

|
| Suggested List of Projects |

|
| Glossary of Statistical Terms |

|
Introduction
- You have learned about various statistical tools and how they help in analyzing data related to different economic activities like production, consumption, trade, banking, and transport.
- In this chapter, you will learn how to develop a project using these tools.
- This will help you understand how to collect and analyze data for different purposes, such as studying consumer preferences, launching a new product, or assessing the impact of technology in schools.
- Conducting a survey and preparing a report will help in understanding key trends and suggesting improvements.

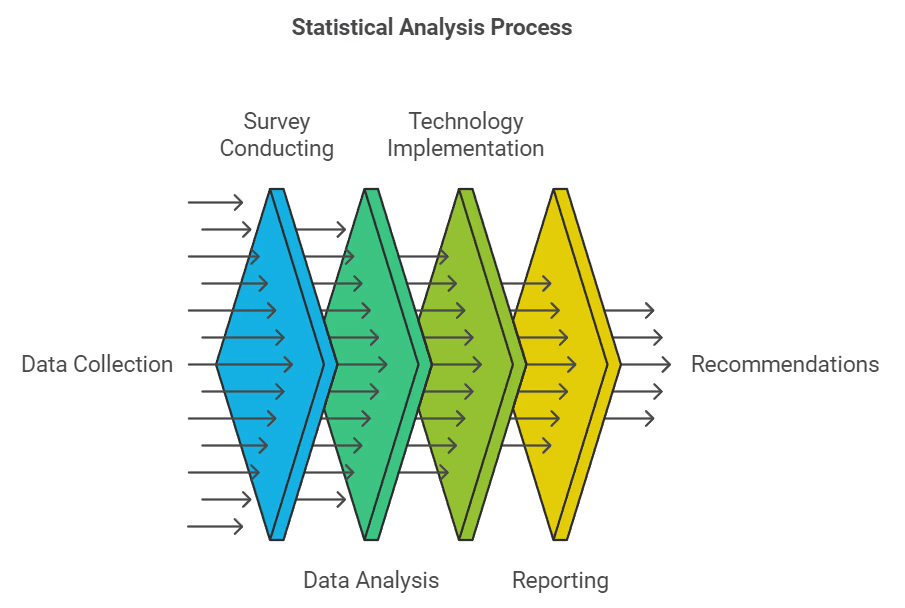
Steps in Making a Project
1. Identifying the Topic
First, decide what you want to study. This could be about a product like mobile phones, soap, or cars, or social issues like water supply problems or consumer awareness. The topic will guide your data collection and analysis.
2. Choosing the Target Group
It is important to identify the right group of people to survey. For example:
If your study is about cars, the target group would be middle and high-income consumers.
If it is about soap, the target group would include both urban and rural consumers.
If studying access to safe drinking water, both urban and rural populations would be relevant.
Selecting the correct target group helps in framing appropriate survey questions.
3. Collecting Data
Depending on your study, you may collect data using:
Primary data: Direct collection through surveys, interviews, emails, or phone calls. This is useful for gathering firsthand information, such as literacy rates or brand preferences.
Secondary data: Using existing reports, research papers, or government records. This is helpful when time and resources are limited.
If using sampling, it is important to choose a reliable method that represents the whole population.
4. Organising and Presenting Data
Once the data is collected, it needs to be organized and presented using tables, bar diagrams, and pie charts to make it easier to understand.
5. Analyzing and Interpreting Data
Key statistical methods such as:
Mean (average)
Standard deviation (variability)
Correlation (relationship between variables)
These help in understanding trends and patterns in the collected data.
6. Drawing Conclusions
After analyzing the data, conclusions are made. This may include predicting future trends, suggesting improvements, or recommending policy changes.
7. Bibliography
Finally, list all sources used, including books, newspapers, and research reports.
By following these steps, you can develop a well-structured project using statistical tools to analyze and interpret data effectively.
Suggestions for Project Selection:
- Economic issues related to any topic can be chosen by students for their projects.
- The projects are related to various sectors, including but not limited to:
- transportation
- cottage industry
- marketing
- education
- consumer protection
- rural development
- health and sanitation
- agriculture
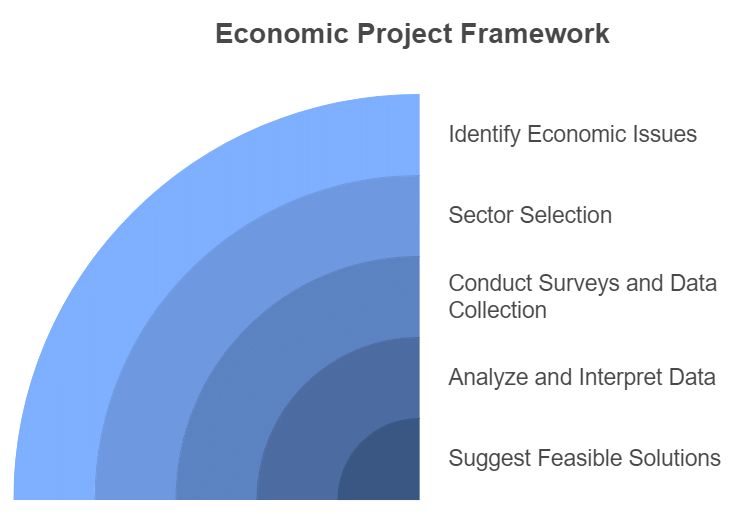
- The primary objective of these projects is to identify and address specific problems related to the sector and suggest feasible solutions through a project report.
- Some projects may involve conducting surveys, collecting primary and secondary data, analyzing and interpreting the data, and making recommendations for future policies.

Suggested List of Projects
Here are some simple and practical project ideas related to real-life economic issues. You can choose any one of them or create a similar project of your own.
Better Transport System
Imagine you are helping the Transport Minister to improve transport services. Make a report suggesting ways to make transport more efficient and better connected.Village Industry Project
You work in a small village industry making items like incense sticks, candles, or jute bags. Now you want to start your own business. Prepare a project plan to apply for a bank loan.Effect of Advertisements
You are a marketing manager in a company. After running advertisements for a product, you want to study how the sales have changed. Prepare a report on this.School Dropouts and Literacy
You are the District Education Officer. Your aim is to find out how many children are not attending school and why. Create a report based on your findings.Overcharging of Goods
You are a Vigilance Officer. People have complained that some shopkeepers are selling products at prices higher than the MRP. Visit some shops and make a report.Safe Drinking Water in a Village
You are the Gram Panchayat Head of a village. Prepare a report on the need for clean and safe drinking water for your people and suggest improvements.Women in Employment Schemes
As a local government officer, you want to find out how many women are taking part in employment schemes in your area. Collect data and prepare a report.Health and Sanitation in a Village
You are the Chief Health Officer of a rural area. Study the common health and cleanliness problems in that region and prepare a project.Food Adulteration Survey
You are the Chief Food Inspector. People are complaining about food being mixed with harmful substances. Conduct a survey and write a report on how common this problem is.Polio Immunisation Programme
Collect information and prepare a report on how the polio immunisation programme is working in your area.Savings and Spending Habits
You are a Bank Officer. You want to know how much people are saving and spending based on their income. Conduct a survey and write a report.Farming Practices and Problems
You are part of a student group visiting a village to understand how farming is done and what difficulties farmers face. Collect data and prepare a project report.
These project ideas are helpful in applying statistical tools to real situations and understanding economic issues better.
Glossary of Statistical Terms
Analysis – Studying and explaining a problem by finding out its causes.
Assumed Mean – A value chosen to make calculations easier.
Attribute – A quality or feature that cannot be measured, like honesty or gender.
Bimodal Distribution – A data set that has two most frequent values (modes).
Bivariate Distribution – Data that includes two different variables.
Census Method – Collecting data from every person or item in a group.
Chronological Classification – Arranging data based on time (year, month, etc.).
Class Frequency – Number of values that fall in a particular group.
Class Interval – The range (difference) between the highest and lowest value in a group.
Class Mark / Midpoint – The middle value of a group (add upper and lower limits, then divide by 2).
Classification – Grouping similar things together.
Consumer – A person who buys something for personal or family use.
Constant – A fixed value that doesn’t change during calculation.
Continuous Variable – A number that can take any value, like height or weight.
Cyclicity – Data pattern that repeats over many years.
Decile – Divides data into ten equal parts.
Discrete Variable – Numbers that change in steps (not smoothly), like number of children.
Economics – Study of how people use limited resources to fulfill their needs and wants.
Employee – A person who works for someone and gets paid.
Employer – A person who hires others and pays them.
Enumerator – A person who collects data.
Exclusive Method – A way of grouping values where the boundary value goes into the next group.
Frequency – How often a value appears in data.
Frequency Array – A table showing values and how many times each appears.
Frequency Curve – A smooth line graph showing how data is spread out.
Frequency Distribution – Arranging data in groups and showing how many values are in each group.
Inclusive Method – A grouping method where boundary values are included in the same group.
Informant – A person who gives information during a survey.
Multi-Modal Distribution – Data set with more than two frequently occurring values.
Non-Sampling Error – Mistakes in collecting data (wrong info, missing data, etc.).
Observation – A single piece of data.
Percentile – Divides data into 100 equal parts.
Policy – A decision or action to solve a problem.
Population – The whole group from which data is collected.
Qualitative Classification – Grouping by qualities, like gender or marital status.
Qualitative Data – Information shown in words or descriptions.
Quantitative Data – Information shown in numbers.
Questionnaire – A list of questions used to collect information.
Random Sampling – Choosing people or items in such a way that everyone has an equal chance.
Range – Difference between the highest and lowest value.
Relative Frequency – Frequency shown as a fraction or percentage of total data.
Sample Survey Method – Collecting data from a small group (sample) instead of the whole population.
Sampling Error – Difference between results from the sample and the real population value.
Scarcity – Not having enough of something.
Seasonality – Data pattern that repeats within a year (e.g., weather changes).
Seller – A person who sells goods to earn money.
Service Provider – A person or company offering services for payment.
Spatial Classification – Grouping based on location (state, city, country).
Statistics – The subject that deals with collecting, organizing, and studying data.
Structured Questionnaire – A survey form with fixed choices for answers.
Tally Marking – A way of counting using marks (e.g., |||| = 4).
Time Series – Data arranged in order of time.
Univariate Distribution – A data set involving just one variable.
Variable – Something that can have different values (like age, height, income).
Weighted Average – An average where some values are given more importance than others.
|
59 videos|222 docs|43 tests
|
FAQs on Use of Statistical Tools Class 11 Economics
| 1. What are the most commonly used statistical tools in research? |  |
| 2. How can I choose the right statistical tool for my data analysis? |  |
| 3. What is the importance of using statistical tools in research? |  |
| 4. Can statistical tools be used in qualitative research? |  |
| 5. What is the difference between descriptive and inferential statistics? |  |


