Class 10 Maths Chapter 13 Question Answers - Statistics

III. LONG ANSWER TYPE QUESTIONS
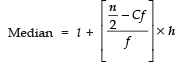
Q1. The median of the following frequency distribution is 35. Find the value of x.
Class Interval | Frequency | Cumulative frequency |
0-20 | 7 | 7 |
20-40 | 8 | 15 |
40-60 | 12 | 27 |
60-80 | 10 | 37 |
80-100 | 8 | 45 |
100-120 | 5 | 50 |
Total | 50 |
|
Also find the modal class.
Sol. Let us prepare the cumulative frequency table:
Class intervals | f | cf |
0-10 | 2 | 2 + 0 = 2 |
10-20 | 3 | 2 + 3 = 5 |
20-30 | x | 5 + x = (5 + x) |
30-40 | 6 | (5 + x) + 6 = 11 + x |
40-50 | 5 | (11 + x) + 5 = 16 + x |
50-60 | 3 | (16 + x) + 3 = 19 + x |
60-70 | 2 | (19 + x) + 2 = 21 + x |
Total | (21 + x) |
|
Here, 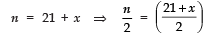
Obviously,  lies in the class interval 30−40.
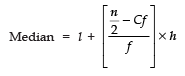
∴
l = 30, Cf = x + 5, f = 6 and h = 10
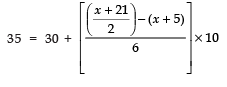
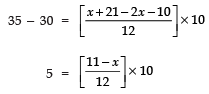
⇒ 5 × 12 = 110 − 10x
⇒ 10x = 110 − 60
⇒ 10x =50 ⇒ x = 5
(i) ∴ The required value of x is 5.
(ii) ∵ The maximum frequency is 6
∴ The modal class is 30−40.
Q2. The mean of the following data is 53, find the missing frequencies.
Age (in years) | 0-20 | 20-40 | 40-60 | 60-80 | 80-100 | Total |
Number of people | 15 | f | 21 | f2 | 17 | 100 |
Sol.
Age (in years) | Number of People (fi) | Mid value (xi) | fi × xi |
0-20 | 15 | 10 | 15 x 10 = 150 |
20-40 | fa | 30 | f1 x 30 = 30 f1 |
40-60 | 21 | 50 | 21 x 50 = 1050 |
60-80 | f2 | 70 | h x 70 = 70 f2 |
80-100 | 17 | 90 | 17 x 90 = 1530 |
Total | 100 |
| 2730 + 30 f1 + 70 f2 |
Since, 15 + f1 + 21 + f2 + 17 = 100
∴ 53 + (f1 + f2) = 100
⇒ f1 + f2 = 100 − 53 = 47 ...(1)

⇒ 2730 + 30 f1 + 70 f2 = 5300
⇒ 30 f1 + 70 f2 = 5300 − 2730 = 2570
⇒ 3 f1 + 7 f2 = 257
⇒ 3 (47 − f2) + 7 f2 = 257 |∵ f1 = 47 − f2
⇒ 141 − 3 f2 + 7 f2 = 257
⇒ 4 f2 = 116 or f2 = 29
∴ f1 = 41 − 29 = 18
Thus, f1 = 18 and f2 = 29.
Q3. The mean of the following distribution is 18.
Class interval | 11-13 | 13-15 | 15-17 | 17-19 | 19-21 | 21-23 | 23-25 |
Frequencies | 3 | 6 | 9 | 13 | f | 5 | 4 |
Find f
Sol. Let the assumed mean (a) = 18

∴ We have the following table:
| Class interval | xi | fi |  | fi ui |
11-13 | 12 | 3 | -3 | 3 x (-3) = -9 |
13-15 | 14 | 6 | -2 | 6 x (-2) = -12 |
15-17 | 16 | 9 | -1 | 9 x (-1) = -9 |
17-19 | 18 | 13 | 0 | 13 x 0 = 0 |
19-21 | 20 | f | 1 | f x 1 = f |
21-23 | 22 | 5 | 2 | 5 x 2 = 10 |
23-25 | 24 | 4 | 3 | 3 x 3 = 9 |
|
| ∑ fi = 40 + f |
| ∑fi ui = f− 8 |

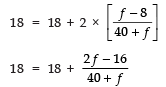
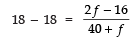
⇒ 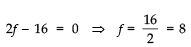
Thus, the required frequency = 8
Q4. The percentage of marks obtained by 100 students in an examination are given below:
Marks | 30 - 35 | 35 - 40 | 40 - 45 | 45 - 50 | 50 -55 | 55 - 60 | 60-65 |
Frequency | 14 | 16 | 18 | 23 | 18 | 8 | 3 |
Find the median of the above data.
Sol.
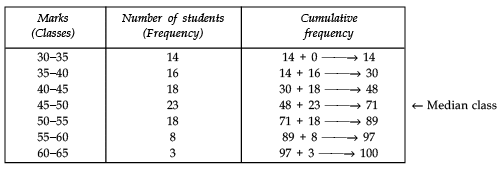
Here n = 100 ⇒ n/2 = 50, which lies in the class 45 – 50, where
l1 (lower limit of the median – class) = 45
c (The cumulative frequency of the class preceding the median class) = 48
f (The frequency of the median class) = 23
h (The class size) = 5


∴ The median percentage of marks is 45.4.
Q5. The median of the distribution given below is 14.4. Find the values of x and y, if the total frequency is 20.
Class interval | 0 - 6 | 6 -12 | 12 -18 | 18 - 24 | 24 - 30 |
Frequency | 4 | x | 5 | y | 1 |
Sol.
Class interval | Frequency | Cumulative Frequency |
0-6 | 4 | 4 + 0 = 4 |
6-12 | x | 4 + x = (4 + x) |
12-18 | 5 | 5 + (4 + x) = 9 + x |
18-24 | y | y + (9 + x) = 9 + x + y |
24-30 | 1 | 1 + (9 + x + y) = 10 + x + y |
Since, n = 20
∴ 10 + x + y = 20
⇒ x + y = 20 − 10
⇒ x + y = 10. ...(1)
Also, we have
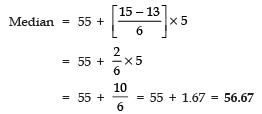
Median = 14.4,
which lies in the class interval 12−18.
∴ The median class is 12−18, such that
l = 12, f = 5, Cf = 4 + x and h = 6
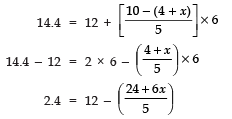
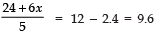
⇒ 24 + 6x = (9.6) × 5
⇒ 24 + 6x =48
⇒ 6 x = 48 − 24 = 24
⇒ x = 24/6 = 4
Now, from (1), we have:
x + y = 10
⇒ 4 + y = 10
⇒ y = 10 − 4 = 6
Thus, x =4 and y = 6
Q6. The distribution below gives the weights of 30 students of a class. Find the mean and the median weight of the students:
Weight (in kg) | Number of students |
40-45 | 2 |
45-50 | 3 |
50-55 | 8 |
55-60 | 6 |
60-65 | 6 |
65-70 | 3 |
70-75 | 2 |
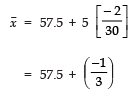
Sol. Let the assumed mean, a = 57.5
∴ h = 5
∴ 
We have the following table:
Weight of students | Class mark | Frequency fi | Cumulative frequency |
| fi ui |
|
|
|
|
|
|
40-45 | 42.5 | 2 | 2 + 0 = 2 | -3 | -6 |
45-50 | 47.5 | 3 | 2 + 3 = 5 | -2 | -6 |
50-55 | 52.5 | 8 | 5 + 8 = 13 | -1 | -8 |
55-60 | 57.5 | 6 | 13 + 6 = 19 | 0 | 0 |
60-65 | 62.5 | 6 | 19 + 6 = 25 | 1 | 6 |
65-70 | 67.5 | 3 | 25 + 3 = 28 | 2 | 6 |
70-75 | 72.5 | 2 | 28 + 2 = 30 | 3 | 6 |
Total |
| ∑ fi = 30 |
|
| ∑fiui = - 2 |

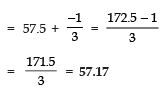
∴ The mean of the given data 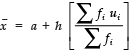
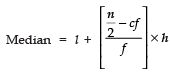
For finding the median:
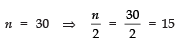
And it lies in the class 55–60.

Q7. The lengths of 40 leaves of a plant are measured correct upto the nearest millimetre and the data is as under:
Length (in mm) | Numbers of Leaves |
118-126 | 4 |
126-134 | 5 |
134-142 | 10 |
142-150 | 12 |
150-158 | 4 |
158-166 | 5 |
Find the mean and median length of the leaves.
Sol. For finding the mean:
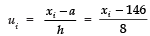
Let the assumed mean a = 146
h = 8
Now, we have the following table:
| Length (in mm) | Class mark (xi) | Frequency (fi) | Cumulative frequency Cf |  | fi ui | |
118-126 | 122 | 4 | 4 + 0 = 4
| -3 | -12 | |
126-134 | 130 | 5 | 4 + 5 = 9
| -2 | -10 | |
134-142 | 138 | 10 | 9 + 10 = 19
| -1 | -10 | |
142-150 | 146 | 12 | 19 + 12 = 31
| 0 | 0 | |
150-158 | 154 | 4 | 31 + 4 = 35
| 1 | 4 | |
158-166 | 162 | 5 | 35 + 5 = 40
| 2 | 10 | |
Total |
| ∑ fi = 40 |
|
| ∑ fi ui =-18 | |
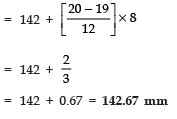
∴ Mean 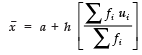
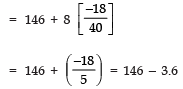
= 142.4 mm
Median: Since 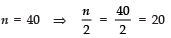 [Median class is 142-150]
l = 142
cf = 19
f = 12 and h = 8

Q8. The table below shows the daily expenditure on food of 30 households in a locality:
Daily expenditure (in Rs) | Numbers of households |
100-150 | 6 |
150-200 | 7 |
200-250 | 12 |
250-300 | 3 |
300-350 | 2 |
Find the mean and median daily expenditure on food.
Sol. For finding the mean
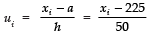
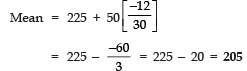
Let the assumed mean a = 225.
h = 50
We have the following table:
| Daily expenditure | xi | fi | c.f. |  | fi ui |
100-150 | 125 | 6 | 6 + 0 = 6 | -2 | (-2) x 6 = -12 |
150-200 | 175 | 7 | 6 + 7 = 13 | -1 | (-1) x 7 = -7 |
200-250 | 225 | 12 | 13 + 12 = 25 | 0 | (0) x 12 = 0 |
250-300 | 275 | 3 | 25 + 3 = 28 | 1 | (1) x 3 = 3 |
300-350 | 325 | 2 | 28 + 2 = 30 | 2 | (2) x 2 = 4 |
Total |
| ∑ fi = 30 |
|
| ∑ fiui =-12 |
∴ Mean 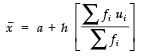
⇒ 
To find median:
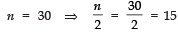
And 15 lies in the class 200−250.
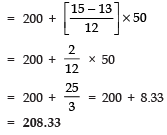
∴ Median class is 200−250.
∴ l = 200
cf = 13
f = 12 and h = 50
Thus, 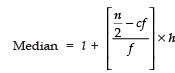
|
127 videos|584 docs|79 tests
|
FAQs on Class 10 Maths Chapter 13 Question Answers - Statistics
| 1. What is statistics and why is it important? |  |
| 2. What are the different types of data in statistics? | |
| 3. How is mean, median, and mode used in statistics? | |
| 4. What is the difference between probability and statistics? | |
| 5. How can statistics be misused or misrepresented? | |


Important questions
,Semester Notes
,Free
,Extra Questions
,Objective type Questions
,Exam
,ppt
,study material
,past year papers
,Previous Year Questions with Solutions
,practice quizzes
,Class 10 Maths Chapter 13 Question Answers - Statistics
,Class 10 Maths Chapter 13 Question Answers - Statistics
,video lectures
,Class 10 Maths Chapter 13 Question Answers - Statistics
,Viva Questions
,mock tests for examination
,Summary
,Sample Paper
,shortcuts and tricks
,MCQs
;


Long Answer Questions: Statistics - 1 Free PDF Download
Importance of Long Answer Questions: Statistics - 1
Long Answer Questions: Statistics - 1 Notes
Long Answer Questions: Statistics - 1 Class 10
Study Long Answer Questions: Statistics - 1 on the App
|
© EduRev
|
Education Revolution
|


|


within 7 days!