Conversion Graphs | Mathematics for GCSE/IGCSE - Class 10 PDF Download

What is a conversion graph?
- A conversion graph visually represents the relationship between two quantities in a linear fashion.
- By examining the graph, one can easily convert between the two units or quantities by extracting values from different locations on the line.
- Conversion graphs find applications in various scenarios:
- Converting between temperature units: For instance, converting degrees Celsius (°C) to degrees Fahrenheit (°F).
- Converting between currencies: Such as converting between Dollars ($) and Yen (¥).
- Converting volume units: For example, converting Litres to Gallons.
- Calculating charges based on usage: Like a taxi driver determining fare based on the distance traveled.
How do I use a conversion graph?
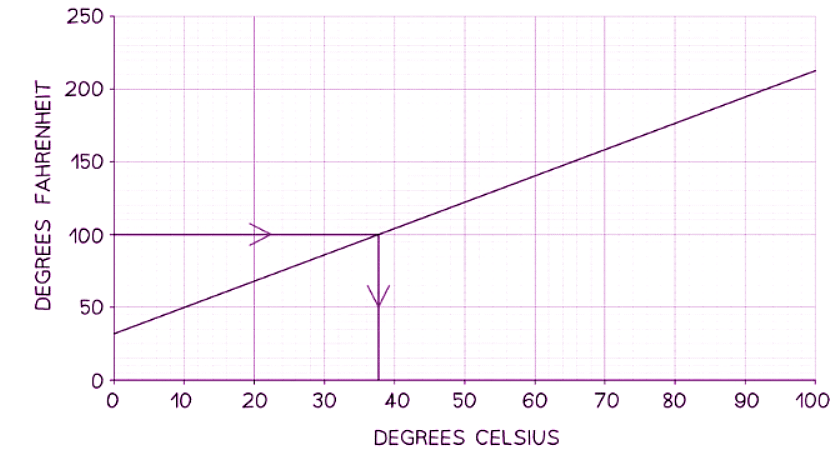
- Using the below graph, which converts temperatures between Celsius (°C) and Fahrenheit (°F), as an example
How to Use a Conversion Graph:
- To convert a value, such as 100 °F to °C:
- Identify the axis you are converting from; in this case, it's °F on the y-axis
- Draw a line from the value on the graph to the graphed line
- From the point of intersection, draw a line to the other axis to find the converted value
- For example, 100 °F is approximately equal to 37.8 °C
Solved Example
Example: The graph below shows the price charged by a plumber for the time spent on a particular job. The y-axis shows the price in dollars, and the x-axis shows the number of hours spent working on the job.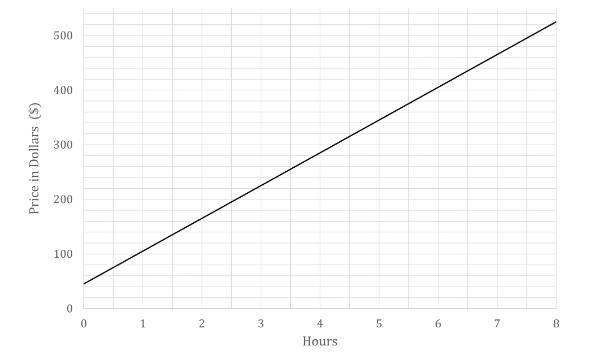
(a) Find the price charged for a job which took 3 hours.
(b) A particular job cost $320. Find the length of time the job took.
(c) The plumber charges a callout fee; a fee charged for travelling to the customer and inspecting the job before starting any work. Find the price of the callout fee.
Ans: (a) Draw a vertical line from the x-axis at 3 hours, and read off the graph on the y-axis.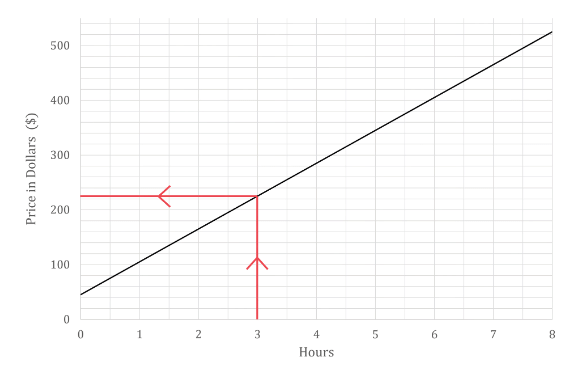 Approximately $225
(b) Draw a horizontal line from the y-axis at $320, and read off the graph on the x-axis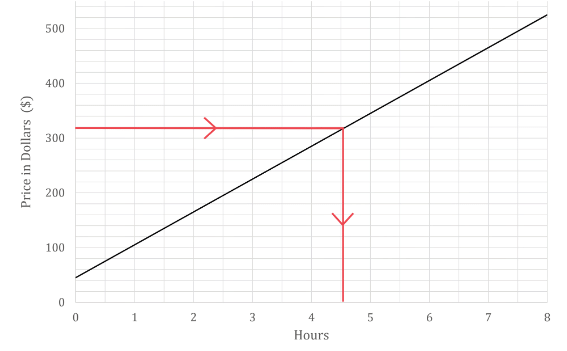 Approximately 4.5 hours
(c) This would be the price charged for 0 hours; the y-intercept of the graph.
Read this value off the graph at the point where the line graph meets the y axis.
Approximately $45.
|
42 videos|395 docs|19 tests
|
FAQs on Conversion Graphs - Mathematics for GCSE/IGCSE - Class 10
| 1. How can conversion graphs help in understanding different units and calculating charges? |  |
| 2. What is the significance of understanding graph scales when interpreting conversion graphs? | |
| 3. How can one read values from a conversion graph accurately? | |
| 4. What are some practical applications of conversion graphs in real-life scenarios? | |
| 5. How can one effectively interpret conversion graphs to make informed decisions based on the information provided? | |


study material
,Important questions
,Previous Year Questions with Solutions
,Conversion Graphs | Mathematics for GCSE/IGCSE - Class 10
,Conversion Graphs | Mathematics for GCSE/IGCSE - Class 10
,Exam
,Conversion Graphs | Mathematics for GCSE/IGCSE - Class 10
,Semester Notes
,Free
,video lectures
,mock tests for examination
,shortcuts and tricks
,past year papers
,Objective type Questions
,Sample Paper
,MCQs
,Summary
,ppt
,Extra Questions
,practice quizzes
,Viva Questions
;


Conversion Graphs Free PDF Download
Importance of Conversion Graphs
Conversion Graphs Notes
Conversion Graphs Class 10 Questions
Study Conversion Graphs on the App
|
© EduRev
|
Education Revolution
|


|


within 7 days!