Graphical methods of Solving a Pair of Linear Equations | Mathematics (Maths) Class 10 PDF Download

A system of linear equations is just a pair of two lines that may or may not intersect. Graph of a linear equation is a line. There are a few methods that can be used to solve two linear equations, for example, Substitution Method, Elimination Method, etc. They can also be solved using graphical methods in which we draw the graph of the equations and try to find that intersection point. First, let’s see some linear equation and their graphs.
Linear Equations and Graphs
To graph two linear equations, we plot them on a coordinate plane and see where they intersect. The intersection points represent the solutions to these equations:
- If the lines cross at a point, that point gives the unique solution of the two equations, making the equations consistent.
- If the lines overlap, there are infinitely many solutions, with each point on the line being a solution, making the equations dependent (also consistent).
- If the lines are parallel, there is no solution, making the equations inconsistent.
Let’s look at two examples of linear equations and their graphs based on real-life situations.
Example 1: Roman went to a stationery shop and purchased 2 pencils and 3 erasers for Rs 9. His friend Sonam saw the new variety of pencils and erasers with Roman, and she also bought 4 pencils and 6 erasers of the same kind for Rs 18. Represent this situation algebraically and graphically.
Solution: Let’s say cost of one pencil is Rs.x and cost of one eraser be Rs. y. Then the equations can be formulated as,
2x + 3y = 9,
4x + 6y = 18,
Let’s plot both of these on graph,
By putting them in intercept form,
2x / 9 + 3y / 9 = 1
4x / 18 + 6y / 18 = 1
The graph of both equations looks as follows,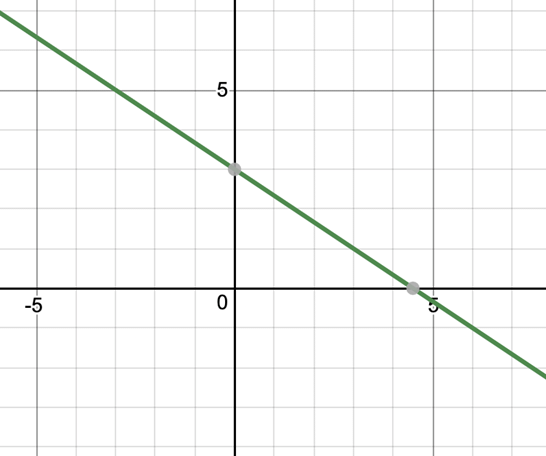 Both of these lines have same equations, and thus they coincide.
Example 2: A coach of the cricket team bought 3 bats and 6 balls for Rs 3900. Later, he bought another bat and 3 more balls of the same kind for Rs 1300. Represent this situation algebraically and geometrically.
Solution: Let’s say that cost of each bat is Rs. “x” and Balls is Rs. “y”.
3x + 6y = 3900
x + 3y = 1300
Let’s make graph of these equations, it can be made through any of the forms that were taught, but we will stick to intercept form
3x / 3900 + 6y / 3900 = 1
x / 1300 + 3y / 1300 = 1
Now the graphs of both equations come out to be,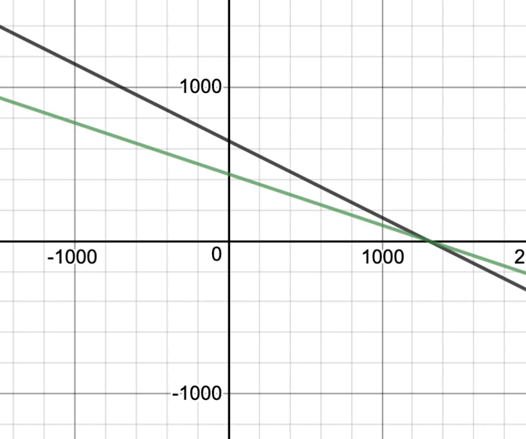 We can see that these lines intersect at one point.
Graphical Method of Solution
In this method, we graph both the equations and then try to find the intersections. Now in graphing and finding the possible intersections, there can be three cases that can occur
- Unique solution
- No Solution Infinitely
- Many Solutions
1. Unique Solution
A pair of linear equations in two variables, which has a solution, is called a consistent pair of linear equations. In such cases, both the lines intersect each other.
For example: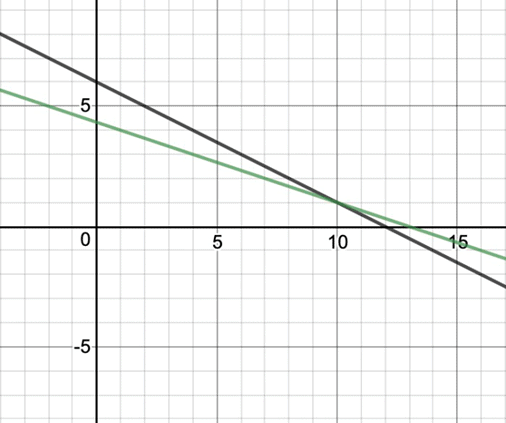 Example 1: Solve the given pair of equations with the graphical method.
x + 3y = 6
2x – 3y = 12
Solution: We need to first plot both of them on to find the solution. Let’s bring them in intercept form,
x / 6 + 3y / 6 = 1
2x / 12 + 3y / 12 = 1
Both of these equations can now be plotted on graph.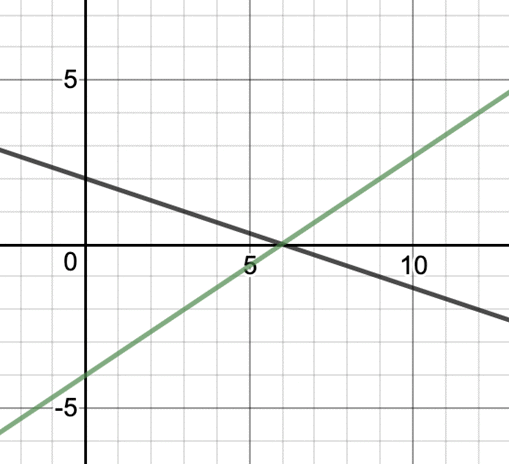 We can see on graph that both these lines intersect on (6,0) so this is the solution to this pair of linear equations.
Example 2: Ragini went to a shop to buy some pants and skirts. When her friends asked her how many of each she had bought, she answered, “The number of skirts is two less than twice the number of pants purchased. Also, the number of skirts is four less than four times the number of pants purchased”. Help her friends to find how many pants and skirts Ragini bought.
Solution: Let’s say there are “x” number of pants and “y” number of Skirts. Then following equations are formed.
y = 2x – 2
y = 4x – 4
Let’s draw graphs for both the equations,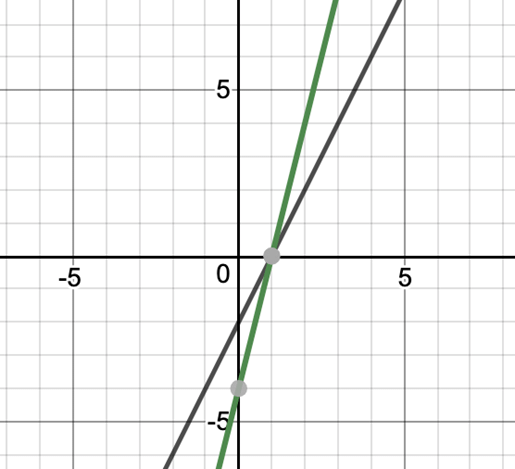 From graph, we can see that these lines intersect at (1, 0). So this is the solution for this system of equations
x = 1 and y = 0
That means that Ragini brought 1 pant and 0 skirts.
2. No Solution
A pair of linear equations in two variables, which has no solution, is called an inconsistent pair of linear equations. In such cases both the lines are parallel, so they never intersect.
For example: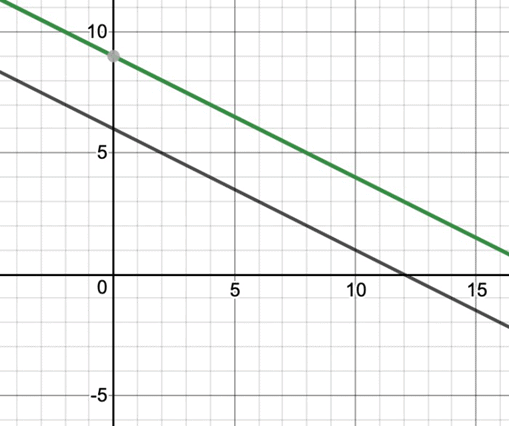 Example: Draw the linear equations on the graph for the given two equations,
7x - 9y = 4
7x - 9y = 12
Solution: The graph for the given two equations will look like,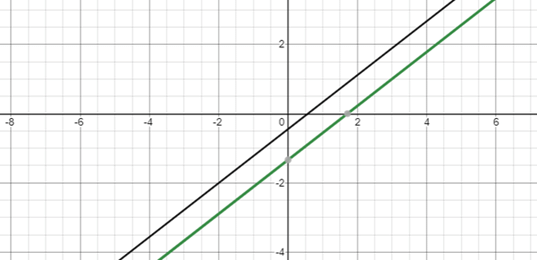 As it is clear that the lines are not intersecting each other at any point, they are parallel in nature. Hence, there is no solution for the given linear equations.
3. Infinitely Many Solutions
A pair of linear equations in two variables, which have infinitely many solutions, is called a dependent pair of linear equations. In such cases, both the lines coincide with each other.
For example: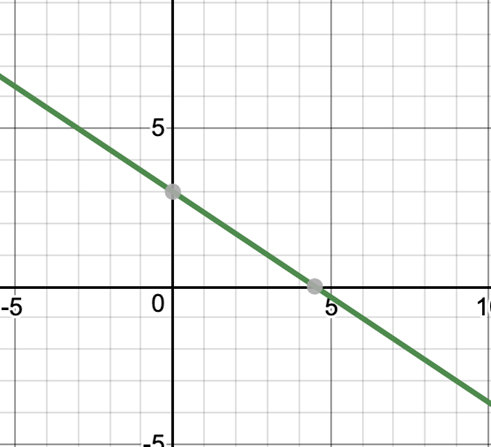 Let’s generalize the above cases,
a1x + b1y + c1 = 0
a2x + b2y + c2 = 0
These equations are,
- Intersecting if, a1 / a2 ≠ b1 / b2
- Coincident if, a1 / a2 = b1 / b2 = c1 / c2
- Parallel if, a1 / a2 = b1 / b2 ≠ c1 / c2
Example: Draw the linear equations on the graph, also find the solution for the two linear equations.
8x + 13y = 17
16x + 26y = 34
Solution: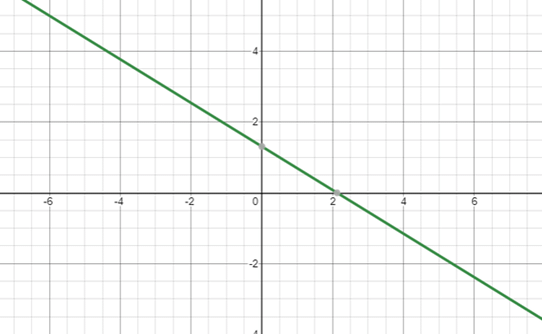 The two equations are not only parallel, they are overlapping each other, hence all the points are intersecting each other. Therefore, there exist infinitely many solutions for the given linear equations.
|
127 videos|584 docs|79 tests
|
FAQs on Graphical methods of Solving a Pair of Linear Equations - Mathematics (Maths) Class 10
| 1. What is the graphical method for solving a pair of linear equations? |  |
| 2. How do you plot linear equations on a graph? | |
| 3. What does it mean if the lines of two linear equations are parallel? | |
| 4. How can you determine if the equations have one solution, no solution, or infinitely many solutions using the graph? | |
| 5. What are some common mistakes to avoid when using the graphical method? | |


Extra Questions
,Free
,Semester Notes
,Graphical methods of Solving a Pair of Linear Equations | Mathematics (Maths) Class 10
,Sample Paper
,Viva Questions
,Summary
,mock tests for examination
,Objective type Questions
,shortcuts and tricks
,MCQs
,past year papers
,practice quizzes
,Exam
,Previous Year Questions with Solutions
,video lectures
,Important questions
,study material
,Graphical methods of Solving a Pair of Linear Equations | Mathematics (Maths) Class 10
,ppt
,Graphical methods of Solving a Pair of Linear Equations | Mathematics (Maths) Class 10
;


Graphical methods of Solving a Pair of Linear Equations Free PDF Download
Importance of Graphical methods of Solving a Pair of Linear Equations
Graphical methods of Solving a Pair of Linear Equations Notes
Graphical methods of Solving a Pair of Linear Equations Class 10 Questions
Study Graphical methods of Solving a Pair of Linear Equations on the App
|
© EduRev
|
Education Revolution
|


|


