Introduction: Analytical Paragraph | English Grammar Advanced - Class 10 PDF Download
| Table of contents |

|
| What Is an Analytical Paragraph? |

|
| Format of an Analytical Paragraph |

|
| Points to Remember |

|
| Practice Questions |

|
What Is an Analytical Paragraph?
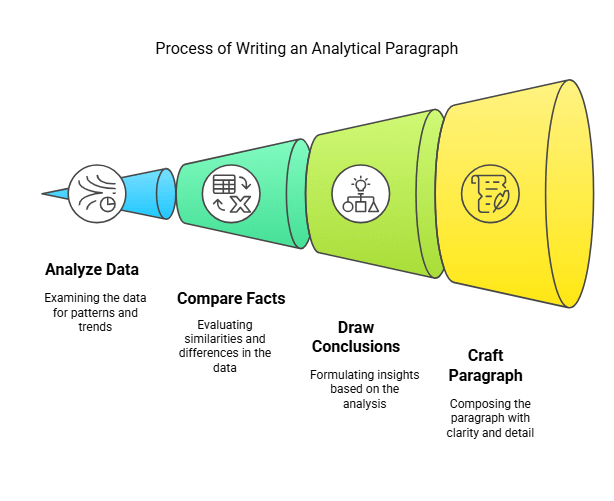
An analytical paragraph is a form of descriptive writing that is written based on a given chart, graph, data, outline, clues, table etc. It requires analysis and comparison of the given facts and drawing conclusions based on the given data. When writing an analytical paragraph, one should remember to describe the facts in the best possible manner and cover the information provided. The paragraph must use clear and crisp language along with providing complete details of the data provided in the question.

Features of an Analytical Paragraph
- It describes the given chart, table, data, graph, cues etc.
- It should be brief and comprehensive but at the same time, include complete information.
- It should state the facts that are provided.
- It should have simple and accurate language.
- It should mention figures and quantities appropriately.
- It should use the same tense throughout, as far as possible.
- It should not provide any personal observation or response.
- It should preferably use the passive form of the verb.
Format of an Analytical Paragraph
Content in 100-120 words
The content of the paragraph must include the following:
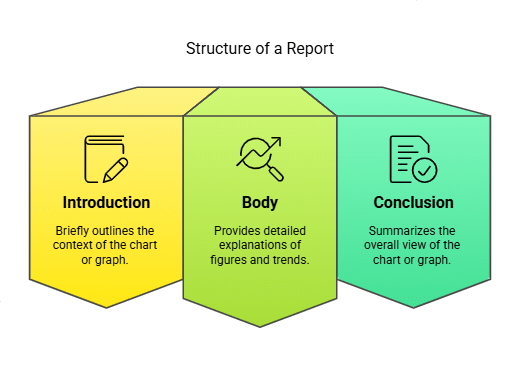
- Introduction (explain in one or two lines the context or what is clearly evident from the chart or graph)
- Body of the paragraph (explain in detail the figure and trends, making comparisons and contrasts)
- Conclusion (give the overall view or summary of the chart or graph)

Let us discuss each of these in detail:
How to Start an Analytical Paragraph
Introduction
The introduction should briefly describe the content of the graph or chart, providing context for the data presented. It serves as an overview and should be concise, summarizing what is immediately evident from the visual representation. Aim to write the introduction in one or two sentences, giving the reader a clear idea of what to expect without delving into detailed analysis.
The Body of the Paragraph
This section provides a detailed analysis of the graph or chart. It should include the key information and be organized for clarity.
- Organizing Information: Highlight significant differences, such as the highest and lowest values, and note any aspects that remain constant. Mention any prominent trends or patterns observed in the data.
- Comparing Information: If the chart compares different groups or time periods, discuss these comparisons clearly. Describe differences or similarities between groups or changes over time, and present comparisons for relevant periods concisely.
- Mentioning Quantities: Ensure accuracy when presenting numbers and figures. Use appropriate methods to describe quantities, such as percentages, fractions, or ratios.
- Connecting Sentences: Use linking phrases to connect different pieces of information logically. Ensure that the sentences flow in a coherent sequence, helping the reader follow the analysis smoothly.
The Conclusion
- The conclusion should summarize the main points of the analysis, reiterating the key findings without introducing personal opinions or additional observations. It should effectively close the paragraph, focusing on summarizing the factual information presented in the body of the analysis.
- In summary, an effective analytical paragraph involves a clear introduction, a detailed and organized body with accurate and well-connected information, and a concise conclusion that wraps up the analysis without adding personal insights.
Points to Remember
- The chart given above describes the data trends over a specific period.
- The data provided gives information about the two groups being analyzed.
- It highlights the aspects that are the largest and the smallest.
- Any aspect that has remained unchanged or is constant throughout is also mentioned.
- For example, one group may have experienced a striking increase while the other declined.
- When discussing quantities, accuracy must be ensured, using percentages or fractions.
- For instance, one-third of the participants reported a change, while nearly one-fourth remained the same.
- Establishing relationships or contrasts can be achieved with terms like similarly or however.
- Furthermore, comparisons can be drawn across the years to highlight trends.
- In conclusion, overall observations can be succinctly summarized.
Practice Questions
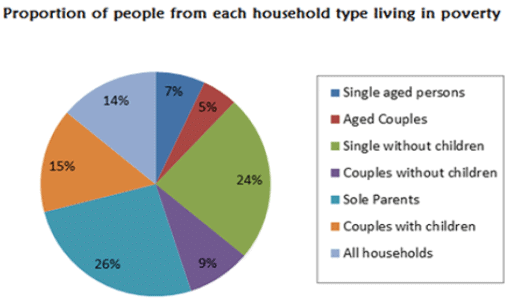
Q1: The given pie chart shows proportion of people from different households living in a state of poverty in the UK in the year 2002. Write an analytical paragraph based on the information provided in about 100-120 words.
 Ans: The given pie chart illustrates seven different categories of households living in poverty in the UK in the year 2002. It is clearly evident from the pie chart that 26% of the total poverty-stricken households were those of sole parents who formed the majority. Single people without children accounted for the second highest proportion of 24%. In contrast to couples without children who accounted for just 9%, couples with children accounted for 15% of the poor households. Single-aged persons formed 7%, whereas aged couples formed 5% of poor households. Overall, 14% of all households in the UK were living under poverty in the year 2002. In all, the younger generation seemed to have a greater poor percentage than their aged counterparts and couples without children had better economic conditions than those with children.
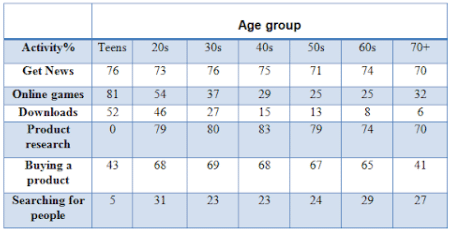
Q2: The following table shows details about the different internet activities for six categories of people according to different age groups. Study the table and write an analytical paragraph based upon it in about 100- 120 words.
 Ans: The given table suggests the internet activities of six age groups ranging from teens to those in their seventies for six different kinds of activities on the internet. The table shows that the younger generation is more interested in online games and news, whereas the older generation spends time on the internet in order to research and buy products. It is evident from the table that 81% of teens mainly use the internet for playing online games, and many are also interested in news and downloads as well as in buying products. The middle-age group, that is, people in the age group ranging from 20s to 60s is highly interested in getting news, doing product research and buying products, with the percentage ranging from 70-80%. The internet activity which gets the least time is searching for people. All the age groups spend less than 30% of their internet time on the same. The amount of time spent on downloads decreases with age and gets as low as 6% for people in 70s. Overall, the table suggests that teenagers are most likely to spend time playing games and doing downloads. On the other hand, older people, on an average, are interested in researching and buying products. It is also significant to note that people spend the least amount of time when it comes to searching for other people online.
|
53 videos|210 docs|40 tests
|
FAQs on Introduction: Analytical Paragraph - English Grammar Advanced - Class 10
| 1. What is an analytical paragraph? |  |
| 2. What is the format of an analytical paragraph? |  |
| 3. What points should be remembered while writing an analytical paragraph? |  |
| 4. How can I practice writing analytical paragraphs? |  |
| 5. Why are analytical paragraphs important in exams? |  |


