Measures of Dispersion Class 11 Economics
Introduction
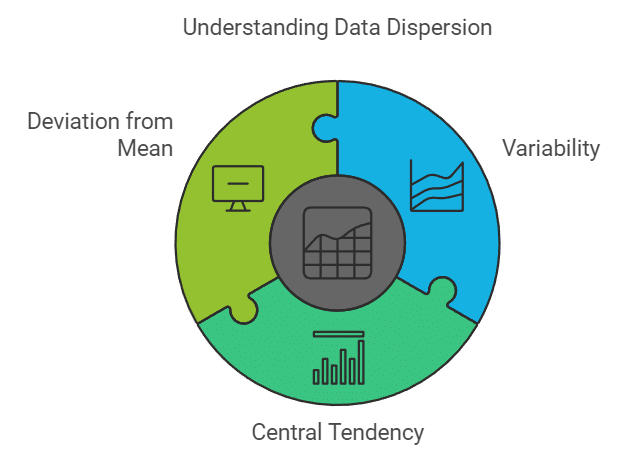
A measure of dispersion reveals how widely the data is spread out. It provides information about the differences between data points, giving a clear picture of their distribution. This measure presents the variability and the central tendency of each item in the data set. To put it differently, dispersion refers to the degree to which values in a distribution deviate from the distribution's mean. It provides insight into how much individual items differ from each other and from the central value.
The variation can be measured in different numerical measures, namely
- Range: The simplest method of measuring dispersion is by calculating the difference between the largest and smallest item in a given distribution, known as the range. If Y max and Y min represent the two extreme values, the range can be calculated as follows:
Range = Y max – Y min - Quartile deviation: Also known as the semi-interquartile range, quartile deviation is half of the difference between the upper and lower quartiles. The first quartile, Q1, is the value that connects the smallest number with the median of the data. The median, Q2, is the second quartile. Finally, the value that connects the largest number with the median is the third quartile, Q3. Quartile deviation can be calculated using the following formula:
Q = ½ × (Q3 – Q1) - Mean deviation: Mean deviation is the arithmetic mean (average) of the absolute deviations of observations from a central value such as the mean or median. The mean deviation can be calculated using the formula:
A = 1⁄n [∑i|xi – A|] - Standard deviation: The standard deviation is the square root of the arithmetic mean of the squared deviations measured from the mean. It is given as follows:
σ = [(Σi (yi – ȳ) ⁄ n] ½ = [(Σ i yi 2 ⁄ n) – ȳ 2] ½
Apart from a numerical value, graphics methods are also applied for estimating dispersion.
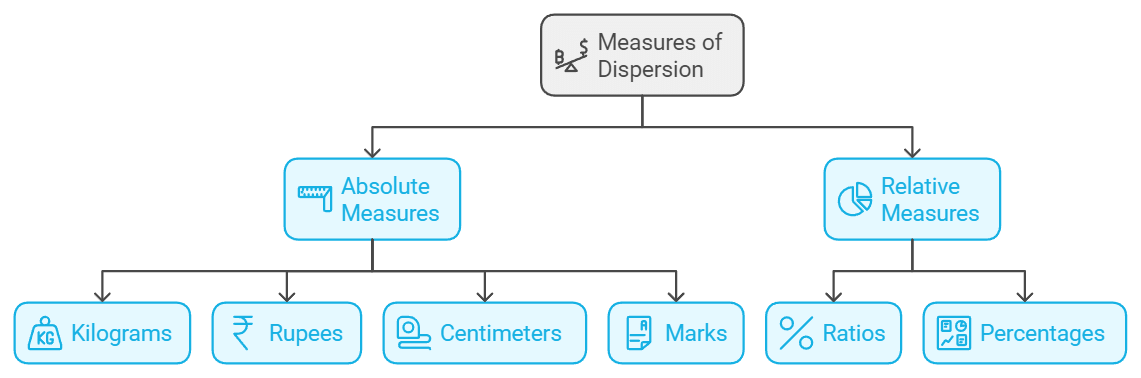
Types of Measures of Dispersion
Absolute Measures:
- Absolute measures of dispersion are expressed in the same units as the variable being measured, such as kilograms, rupees, centimetres, or marks.
Relative Measures:
- Relative measures of dispersion are calculated as ratios or percentages of the central tendency.
- These measures are also referred to as coefficients of dispersion.
- They are dimensionless numbers or percentages that do not depend on the units of measurement.

Characteristics of a Good Measure of Dispersion
- The measure should be straightforward to compute and comprehend.
- The measure should take into account all the data points in the series.
- The measure should have a precise and well-defined formula.
- The measure should not be heavily influenced by outliers.
- The measure should not be excessively impacted by variations due to sampling.
- The measure should be amenable to advanced mathematical and statistical analyses.
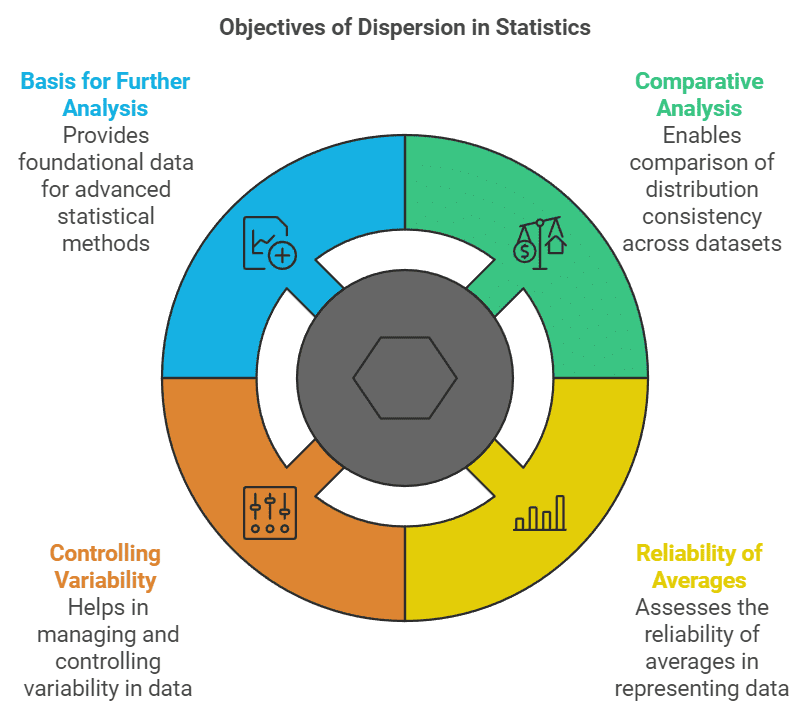
What are the objectives of computing dispersion?
Comparative Analysis:
- Measures of dispersion provide a single value that reflects the consistency or uniformity of distribution, making it possible to compare various distributions.
- The lower the magnitude (value) of dispersion, the higher the consistency or uniformity, and vice versa.
Reliability of Averages:
- A small value of dispersion indicates low variation between observations and the average, making the average a reliable representative of the observations.
- A higher value of dispersion indicates greater deviation among the observations, making the average an unreliable representative.
Controlling Variability:
- Different measures of dispersion provide us with information on variability from different perspectives, and this information can be helpful in controlling variation.
- In financial analysis of business and medicine, these measures of dispersion can prove very useful.
Basis for Further Statistical Analysis:
- Measures of dispersion provide the basis for further statistical analysis, such as computing correlation, regression, and testing of hypotheses.
Relative Measures of Dispersion
- Range
- Inter quartile range
- Quartile deviation or Semi-Inter-quartile range
- Mean deviation
- Standard Deviation
- Lorenz curve
Range
Range is defined as the difference between two extreme observations i.e. the largest and the smallest value.
Symbolically, R = L - S
Where R = Range
L = Largest Value
S = Smallest value
Coefficient of range =

Inter Quartile Range
Inter quartile range is the difference between the upper quartile and the lower quartile.
Inter-quartile range = Q3 - Q1
Where Q3 = Third quartile or upper quartile.
Q1 = First quartile or lower quartile
 |
Download the notes
Chapter Notes - Measures of Dispersion
|
Download as PDF |
Quartile Deviation
Quartile deviation is known as half of the difference between the third quartile (Q3) and the first quartile (Q1). It is also known as semi-inter quartile range.
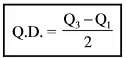
Where Q.D. = Quartile deviation
Q3 = Third quartile or upper quartile.
Q1 = First quartile of lower quartile.
Coefficient of quartile deviation =

Mean Deviation
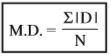
The mean deviation or average deviation is computed as the arithmetic mean of the deviations of individual items from their central value (mean, median, or mode), typically based on the median.
Calculation of mean deviation:
Individual Series
Discrete Series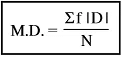
Continuous Series
Where,
MD = Mean deviation
| D | = Deviations from mean or median ignoring + Signs
N = Number of items (Individual Series)
N = Total number of Frequencies (Discrete and continuous series)
F = Number of frequencies.
Coefficient of mean deviation
Merit of Mean deviation:
- Considering every term in the calculation, the mean deviation is a superior measure of dispersion compared to other measures such as range, percentile range, or quartile range.
- Mean deviation finds extensive use in fields such as economics, business, commerce, and related disciplines.
- Mean deviation is less susceptible to sampling fluctuations compared to other measures like range, percentile range, or quartile deviation.
- When comparing two or more series, the mean deviation is arguably the best measure.
- Mean deviation is based on actual measurements, rather than estimates.
- Mean deviation is a precisely defined measure, a critical aspect of any statistical analysis.
- The mean deviation calculated from the median is less influenced by extreme values.
- Because mean deviation is based on deviations from an average, it provides a better measure for comparison.
Demerits of Mean Deviation:
- Compiling M.D. can be difficult if the average is in fractions.
- It lacks a main property - the ability to undergo further algebraic treatment.
- The calculation of X, M, or Z is required before other measures can be calculated, making it less straightforward.
- When calculated from Z, it may not be very reliable as the mode (Z) may not be a true representative of the series.
- The values of M.D. and its coefficient may differ when calculated from X, M, and Z.
- The ignoring of positive and negative signs in M.D. is not mathematically possible, and so Standard Deviation or another measure of dispersion may be more appropriate.
- For mean, open and series cannot be used for obtaining accurate results.
- An increase in range with an increase in the sample may not necessarily lead to a proportional increase in average deviation.
- M.D. is not commonly used in sociological studies.
 |
Take a Practice Test
Test yourself on topics from UPSC exam
|
Practice Now |
Standard Deviation
The most widely used measure of dispersion is the standard deviation, which is calculated as the square root of the arithmetic mean of the squares of the deviations of the items from their arithmetic mean. Standard deviation can be calculated for individual series.
Actual mean method:
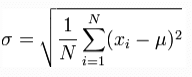
Where σ = Standard Deviation
∑x2 = Sum total of the square of Deviation taken from Mean
N = Number of items
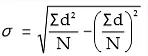
Shortcut Method or assumed mean method: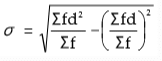
Where d2 = Square of deviation taken from assumed mean.
Calculation of standard deviation in discrete series:
Actual mean method or direct method
Where σ = S.D.
∑x2 = Sum total of the squared deviations multiplied by frequency
N = Number of pairs of observations.
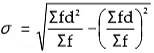
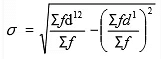
Shortcut method or assumed method:
σ = S.D.
∑fd2 = Sum total of the squared deviations Multiplied by frequency
∑fd2 = Sum total of deviations multiplied by frequency.
N = Number of pairs of observations.
Step deviation method: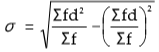 X C
X C
σ = Standard Deviation
∑fd2 = Sum total of the squared step deviations multiplied by frequency.
∑fd2 = Sum total of step deviations multiplied by frequency
C = Common factor
N = Number of pairs of observation
Individual Series:
- Actual Mean Method


- Assumed Mean Method


Discrete/Continuous Series:
- Actual Mean Method

- Assumed Mean Method

- Step Deviation Method
 X C
X C

 X C
X CMerits of standard donation:
- Based on all values
- Rigidly defined
- Less effect of fluctuations
- Capable of algebraic treatment
Demerits of standard donation:
- Difficult to compute
- More stress on extreme items
- Dependent on unit of measurement.
Coefficient of variation:
The coefficient of variation is the most appropriate measure for comparing the stability, uniformity, consistency, or homogeneity of two or more groups of similar data. This measure is calculated by dividing the standard deviation by the mean.
Where C.V. = Coefficient of variation
σ = Standard deviation
X = Arithmetic mean
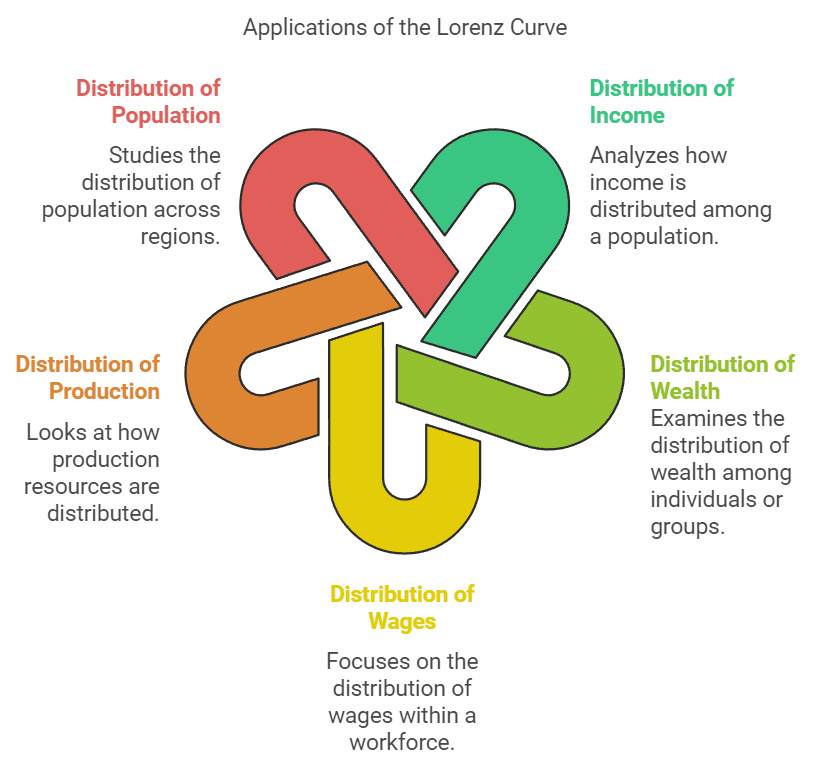
Lorenz Curve
Dr. Max O. Lorenz developed the Lorenz curve as a visual tool to analyze dispersion. Generally, the Lorenz curve is positioned below the line of equal distribution, except when the distribution is uniform. The space between the line of equal distribution and the plotted curve shows the degree of inequality in the items, with a greater area indicating higher inequality.
Application Lorenz Curve:
- Distribution of income
- Distribution of wealth
- Distribution of wages
- Distribution of production
- Distribution of population
|
476 videos|360 docs
|
FAQs on Measures of Dispersion Class 11 Economics
| 1. What are the different types of measures of dispersion? |  |
| 2. Why is it important to compute measures of dispersion? | |
| 3. What are the characteristics of a good measure of dispersion? | |
| 4. What are relative measures of dispersion, and why are they used? | |
| 5. What are the objectives of computing dispersion in statistical analysis? | |


Viva Questions
,practice quizzes
,Measures of Dispersion Class 11 Economics
,Objective type Questions
,ppt
,MCQs
,shortcuts and tricks
,mock tests for examination
,Sample Paper
,Semester Notes
,Extra Questions
,Measures of Dispersion Class 11 Economics
,Important questions
,video lectures
,Exam
,Summary
,Previous Year Questions with Solutions
,Measures of Dispersion Class 11 Economics
,past year papers
,Free
,study material
;


Chapter Notes - Measures of Dispersion Free PDF Download
Importance of Chapter Notes - Measures of Dispersion
Chapter Notes - Measures of Dispersion
Chapter Notes - Measures of Dispersion UPSC Questions
Study Chapter Notes - Measures of Dispersion on the App
|
© EduRev
|
Education Revolution
|


|


